| Tissue | Expression Dynamics | Abbreviation |
| Endometrium | 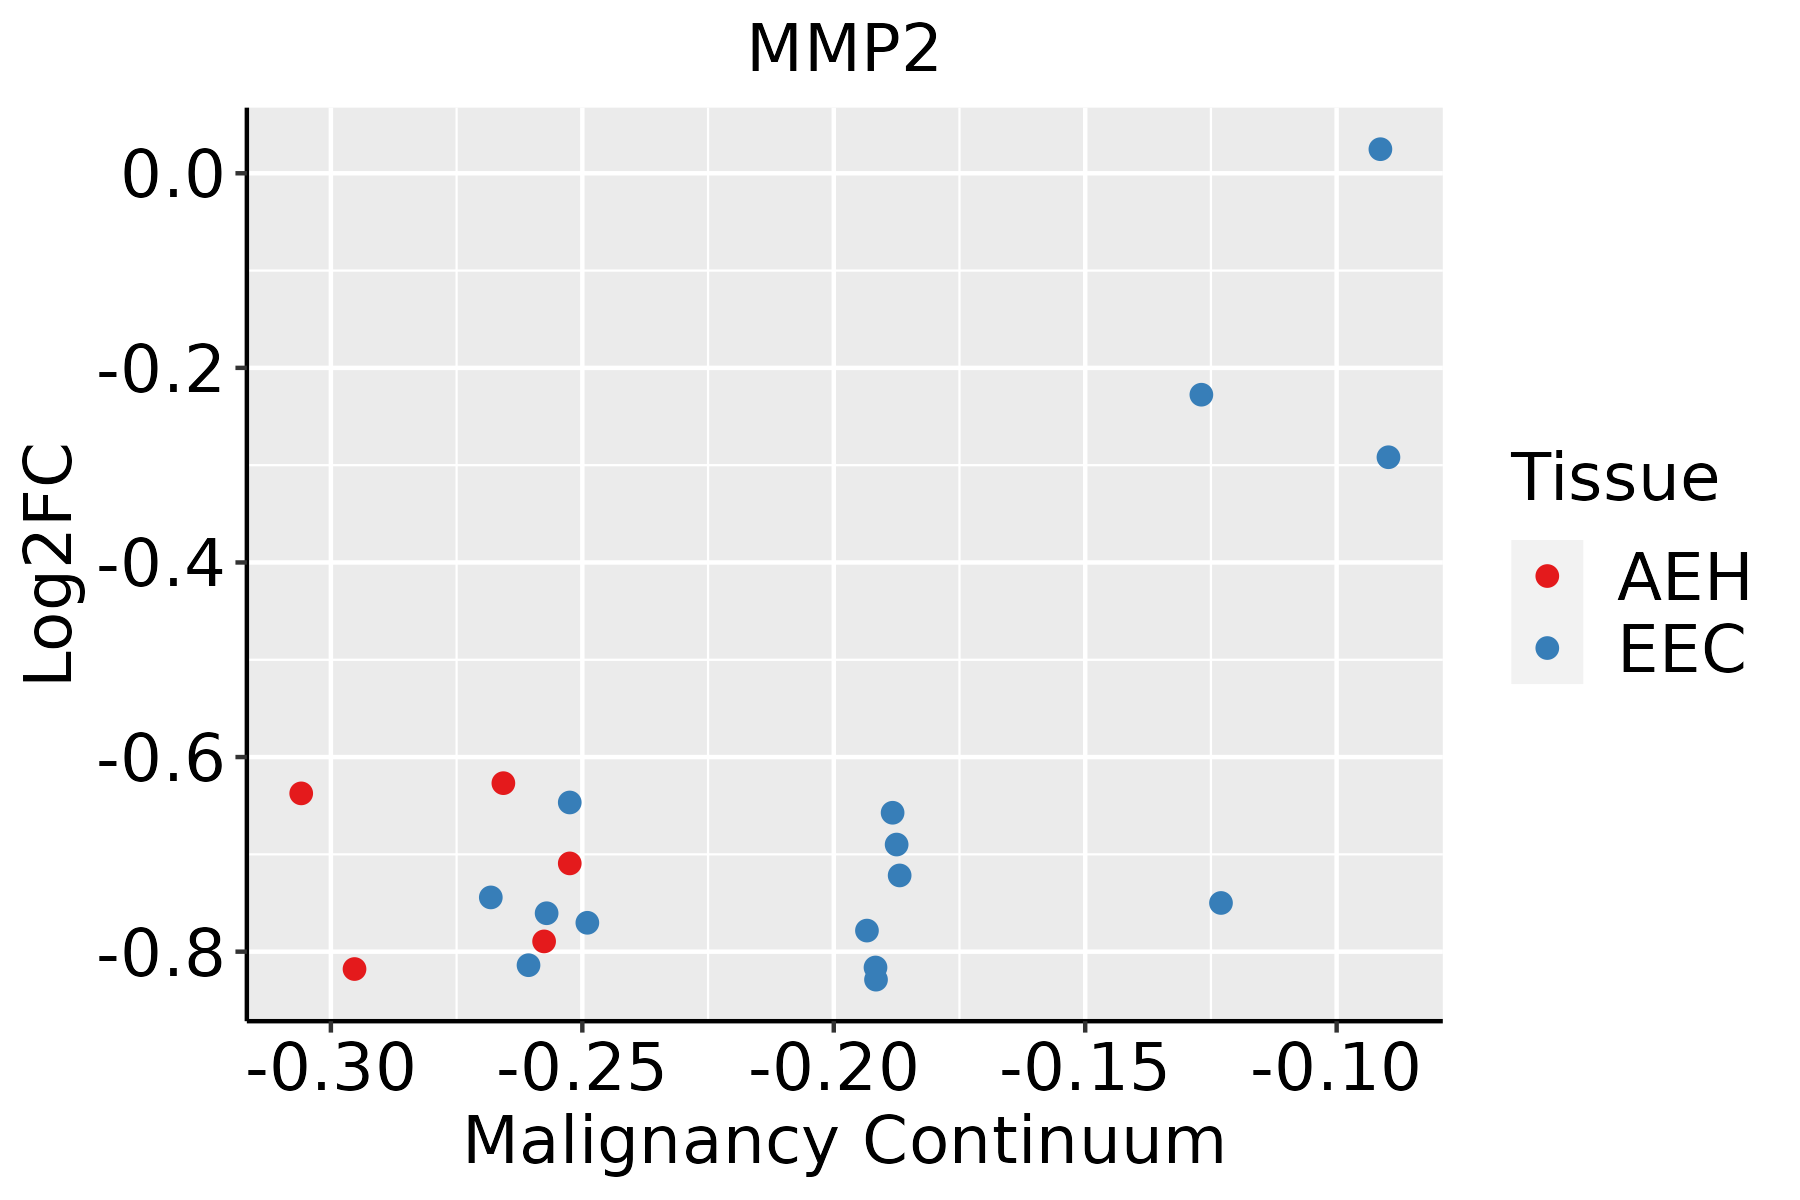 | AEH: Atypical endometrial hyperplasia |
| EEC: Endometrioid Cancer |
| Esophagus |  | ESCC: Esophageal squamous cell carcinoma |
| HGIN: High-grade intraepithelial neoplasias |
| LGIN: Low-grade intraepithelial neoplasias |
| Liver |  | HCC: Hepatocellular carcinoma |
| NAFLD: Non-alcoholic fatty liver disease |
| Oral Cavity |  | EOLP: Erosive Oral lichen planus |
| LP: leukoplakia |
| NEOLP: Non-erosive oral lichen planus |
| OSCC: Oral squamous cell carcinoma |
| Skin | 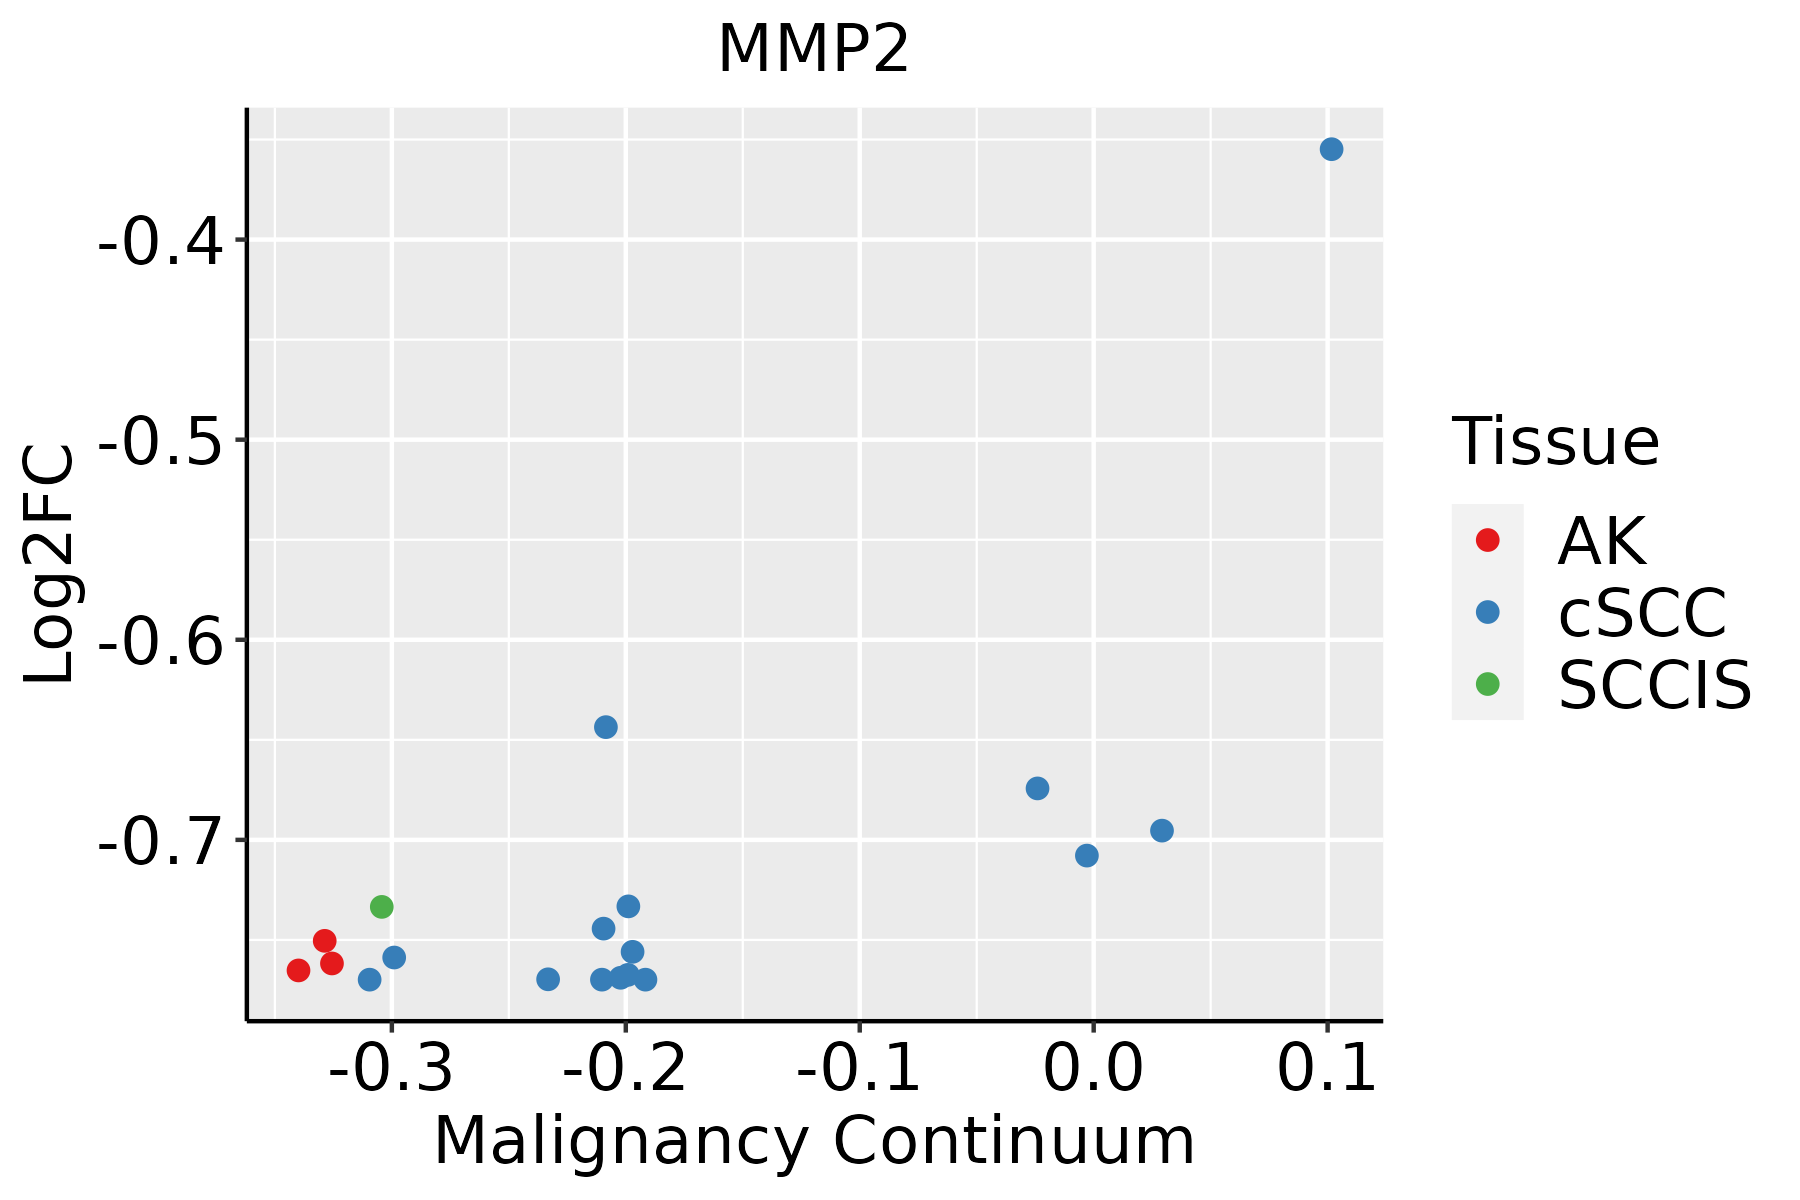 | AK: Actinic keratosis |
| cSCC: Cutaneous squamous cell carcinoma |
| SCCIS:squamous cell carcinoma in situ |
| Thyroid | 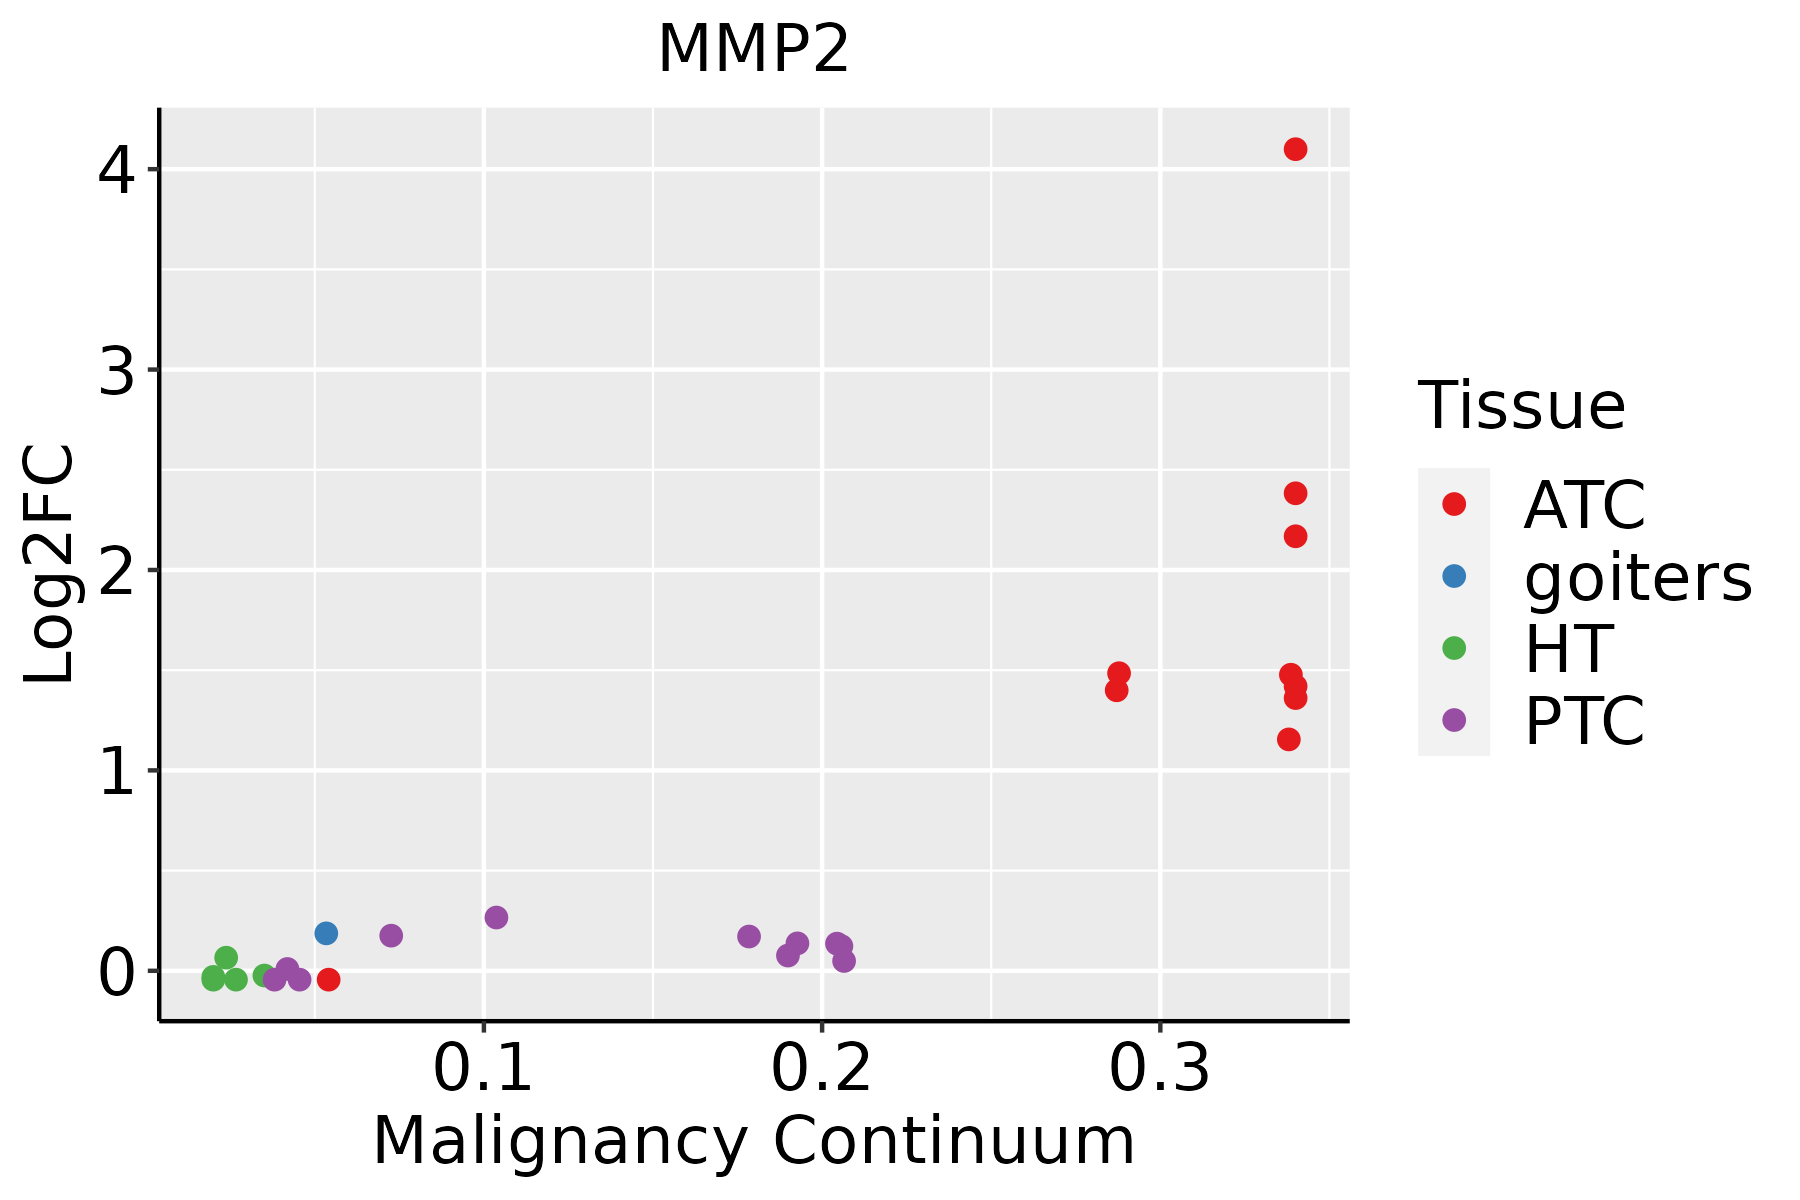 | ATC: Anaplastic thyroid cancer |
| HT: Hashimoto's thyroiditis |
| PTC: Papillary thyroid cancer |
| GO ID | Tissue | Disease Stage | Description | Gene Ratio | Bg Ratio | pvalue | p.adjust | Count |
| GO:00229049 | Cervix | CC | respiratory electron transport chain | 42/2311 | 114/18723 | 1.67e-11 | 4.77e-09 | 42 |
| GO:00453339 | Cervix | CC | cellular respiration | 66/2311 | 230/18723 | 2.07e-11 | 5.39e-09 | 66 |
| GO:00725949 | Cervix | CC | establishment of protein localization to organelle | 99/2311 | 422/18723 | 1.23e-10 | 2.11e-08 | 99 |
| GO:00229009 | Cervix | CC | electron transport chain | 53/2311 | 175/18723 | 2.23e-10 | 3.43e-08 | 53 |
| GO:00060919 | Cervix | CC | generation of precursor metabolites and energy | 105/2311 | 490/18723 | 7.40e-09 | 6.61e-07 | 105 |
| GO:00026837 | Cervix | CC | negative regulation of immune system process | 94/2311 | 434/18723 | 2.63e-08 | 1.87e-06 | 94 |
| GO:00603267 | Cervix | CC | cell chemotaxis | 73/2311 | 310/18723 | 2.82e-08 | 1.96e-06 | 73 |
| GO:00159809 | Cervix | CC | energy derivation by oxidation of organic compounds | 74/2311 | 318/18723 | 3.83e-08 | 2.53e-06 | 74 |
| GO:00975298 | Cervix | CC | myeloid leukocyte migration | 56/2311 | 220/18723 | 7.21e-08 | 4.15e-06 | 56 |
| GO:00305957 | Cervix | CC | leukocyte chemotaxis | 57/2311 | 230/18723 | 1.48e-07 | 7.07e-06 | 57 |
| GO:00068399 | Cervix | CC | mitochondrial transport | 60/2311 | 254/18723 | 4.21e-07 | 1.67e-05 | 60 |
| GO:00509007 | Cervix | CC | leukocyte migration | 78/2311 | 369/18723 | 1.09e-06 | 3.80e-05 | 78 |
| GO:00614588 | Cervix | CC | reproductive system development | 87/2311 | 427/18723 | 1.37e-06 | 4.55e-05 | 87 |
| GO:00486088 | Cervix | CC | reproductive structure development | 86/2311 | 424/18723 | 1.90e-06 | 5.97e-05 | 86 |
| GO:000660510 | Cervix | CC | protein targeting | 68/2311 | 314/18723 | 2.17e-06 | 6.55e-05 | 68 |
| GO:00026857 | Cervix | CC | regulation of leukocyte migration | 50/2311 | 210/18723 | 2.95e-06 | 8.31e-05 | 50 |
| GO:00026888 | Cervix | CC | regulation of leukocyte chemotaxis | 34/2311 | 122/18723 | 3.00e-06 | 8.38e-05 | 34 |
| GO:00509203 | Cervix | CC | regulation of chemotaxis | 51/2311 | 223/18723 | 8.03e-06 | 1.86e-04 | 51 |
| GO:00705859 | Cervix | CC | protein localization to mitochondrion | 33/2311 | 125/18723 | 1.46e-05 | 2.90e-04 | 33 |
| GO:00512713 | Cervix | CC | negative regulation of cellular component movement | 73/2311 | 367/18723 | 2.22e-05 | 3.95e-04 | 73 |
| Pathway ID | Tissue | Disease Stage | Description | Gene Ratio | Bg Ratio | pvalue | p.adjust | qvalue | Count |
| hsa0541525 | Endometrium | AEH | Diabetic cardiomyopathy | 86/1197 | 203/8465 | 2.62e-23 | 1.22e-21 | 8.90e-22 | 86 |
| hsa0541826 | Endometrium | AEH | Fluid shear stress and atherosclerosis | 43/1197 | 139/8465 | 2.47e-07 | 3.49e-06 | 2.55e-06 | 43 |
| hsa0467026 | Endometrium | AEH | Leukocyte transendothelial migration | 37/1197 | 114/8465 | 4.51e-07 | 6.11e-06 | 4.47e-06 | 37 |
| hsa0520518 | Endometrium | AEH | Proteoglycans in cancer | 53/1197 | 205/8465 | 5.43e-06 | 6.53e-05 | 4.78e-05 | 53 |
| hsa049337 | Endometrium | AEH | AGE-RAGE signaling pathway in diabetic complications | 28/1197 | 100/8465 | 2.11e-04 | 1.80e-03 | 1.32e-03 | 28 |
| hsa0491525 | Endometrium | AEH | Estrogen signaling pathway | 35/1197 | 138/8465 | 3.10e-04 | 2.40e-03 | 1.75e-03 | 35 |
| hsa05415111 | Endometrium | AEH | Diabetic cardiomyopathy | 86/1197 | 203/8465 | 2.62e-23 | 1.22e-21 | 8.90e-22 | 86 |
| hsa05418112 | Endometrium | AEH | Fluid shear stress and atherosclerosis | 43/1197 | 139/8465 | 2.47e-07 | 3.49e-06 | 2.55e-06 | 43 |
| hsa04670111 | Endometrium | AEH | Leukocyte transendothelial migration | 37/1197 | 114/8465 | 4.51e-07 | 6.11e-06 | 4.47e-06 | 37 |
| hsa0520519 | Endometrium | AEH | Proteoglycans in cancer | 53/1197 | 205/8465 | 5.43e-06 | 6.53e-05 | 4.78e-05 | 53 |
| hsa0493314 | Endometrium | AEH | AGE-RAGE signaling pathway in diabetic complications | 28/1197 | 100/8465 | 2.11e-04 | 1.80e-03 | 1.32e-03 | 28 |
| hsa04915111 | Endometrium | AEH | Estrogen signaling pathway | 35/1197 | 138/8465 | 3.10e-04 | 2.40e-03 | 1.75e-03 | 35 |
| hsa0541526 | Endometrium | EEC | Diabetic cardiomyopathy | 86/1237 | 203/8465 | 2.59e-22 | 9.46e-21 | 7.05e-21 | 86 |
| hsa0541827 | Endometrium | EEC | Fluid shear stress and atherosclerosis | 45/1237 | 139/8465 | 7.76e-08 | 1.22e-06 | 9.07e-07 | 45 |
| hsa0467027 | Endometrium | EEC | Leukocyte transendothelial migration | 36/1237 | 114/8465 | 2.97e-06 | 3.91e-05 | 2.91e-05 | 36 |
| hsa0520524 | Endometrium | EEC | Proteoglycans in cancer | 52/1237 | 205/8465 | 3.01e-05 | 3.19e-04 | 2.38e-04 | 52 |
| hsa0493321 | Endometrium | EEC | AGE-RAGE signaling pathway in diabetic complications | 28/1237 | 100/8465 | 3.68e-04 | 3.03e-03 | 2.26e-03 | 28 |
| hsa0491526 | Endometrium | EEC | Estrogen signaling pathway | 34/1237 | 138/8465 | 1.19e-03 | 8.02e-03 | 5.98e-03 | 34 |
| hsa0541535 | Endometrium | EEC | Diabetic cardiomyopathy | 86/1237 | 203/8465 | 2.59e-22 | 9.46e-21 | 7.05e-21 | 86 |
| hsa0541836 | Endometrium | EEC | Fluid shear stress and atherosclerosis | 45/1237 | 139/8465 | 7.76e-08 | 1.22e-06 | 9.07e-07 | 45 |
| Hugo Symbol | Variant Class | Variant Classification | dbSNP RS | HGVSc | HGVSp | HGVSp Short | SWISSPROT | BIOTYPE | SIFT | PolyPhen | Tumor Sample Barcode | Tissue | Histology | Sex | Age | Stage | Therapy Types | Drugs | Outcome |
| MMP2 | SNV | Missense_Mutation | | c.1116N>C | p.Lys372Asn | p.K372N | P08253 | protein_coding | deleterious(0.02) | probably_damaging(0.994) | TCGA-AC-A23H-01 | Breast | breast invasive carcinoma | Female | >=65 | I/II | Unknown | Unknown | PD |
| MMP2 | SNV | Missense_Mutation | rs759302357 | c.682G>A | p.Ala228Thr | p.A228T | P08253 | protein_coding | deleterious(0) | probably_damaging(0.935) | TCGA-AR-A0U2-01 | Breast | breast invasive carcinoma | Female | <65 | III/IV | Hormone Therapy | tamoxiphen | PD |
| MMP2 | SNV | Missense_Mutation | novel | c.1512N>T | p.Met504Ile | p.M504I | P08253 | protein_coding | tolerated(0.2) | benign(0) | TCGA-EW-A6S9-01 | Breast | breast invasive carcinoma | Female | <65 | I/II | Unknown | Unknown | SD |
| MMP2 | SNV | Missense_Mutation | | c.970G>A | p.Asp324Asn | p.D324N | P08253 | protein_coding | deleterious(0.01) | benign(0.074) | TCGA-2W-A8YY-01 | Cervix | cervical & endocervical cancer | Female | <65 | I/II | Chemotherapy | cisplatin | CR |
| MMP2 | SNV | Missense_Mutation | rs772094112 | c.275N>G | p.Asn92Ser | p.N92S | P08253 | protein_coding | tolerated(0.73) | benign(0) | TCGA-C5-A3HL-01 | Cervix | cervical & endocervical cancer | Female | >=65 | I/II | Unknown | Unknown | SD |
| MMP2 | SNV | Missense_Mutation | | c.1295G>C | p.Arg432Pro | p.R432P | P08253 | protein_coding | tolerated(0.35) | probably_damaging(0.999) | TCGA-EK-A2PI-01 | Cervix | cervical & endocervical cancer | Female | <65 | III/IV | Unknown | Unknown | SD |
| MMP2 | SNV | Missense_Mutation | | c.1116N>C | p.Lys372Asn | p.K372N | P08253 | protein_coding | deleterious(0.02) | probably_damaging(0.994) | TCGA-IR-A3LA-01 | Cervix | cervical & endocervical cancer | Female | <65 | I/II | Chemotherapy | cisplatin | CR |
| MMP2 | SNV | Missense_Mutation | | c.1345C>G | p.Pro449Ala | p.P449A | P08253 | protein_coding | deleterious(0.01) | benign(0.001) | TCGA-IR-A3LH-01 | Cervix | cervical & endocervical cancer | Female | <65 | I/II | Chemotherapy | cisplatin | CR |
| MMP2 | SNV | Missense_Mutation | | c.1818C>G | p.Ile606Met | p.I606M | P08253 | protein_coding | tolerated(0.14) | probably_damaging(0.999) | TCGA-Q1-A73O-01 | Cervix | cervical & endocervical cancer | Female | <65 | I/II | Chemotherapy | cisplatin | CR |
| MMP2 | SNV | Missense_Mutation | | c.1896C>G | p.Phe632Leu | p.F632L | P08253 | protein_coding | tolerated(0.24) | probably_damaging(0.966) | TCGA-Q1-A73O-01 | Cervix | cervical & endocervical cancer | Female | <65 | I/II | Chemotherapy | cisplatin | CR |
| Entrez ID | Symbol | Category | Interaction Types | Drug Claim Name | Drug Name | PMIDs |
| 4313 | MMP2 | NEUTRAL ZINC METALLOPEPTIDASE, ENZYME, DRUGGABLE GENOME, PROTEASE | inhibitor | 178101832 | | |
| 4313 | MMP2 | NEUTRAL ZINC METALLOPEPTIDASE, ENZYME, DRUGGABLE GENOME, PROTEASE | | SERMS | | 15576828 |
| 4313 | MMP2 | NEUTRAL ZINC METALLOPEPTIDASE, ENZYME, DRUGGABLE GENOME, PROTEASE | | MARIMASTAT | MARIMASTAT | |
| 4313 | MMP2 | NEUTRAL ZINC METALLOPEPTIDASE, ENZYME, DRUGGABLE GENOME, PROTEASE | | PMID29130358-Compound-SB-3CT | | |
| 4313 | MMP2 | NEUTRAL ZINC METALLOPEPTIDASE, ENZYME, DRUGGABLE GENOME, PROTEASE | | BMS-275291 | REBIMASTAT | 15041713 |
| 4313 | MMP2 | NEUTRAL ZINC METALLOPEPTIDASE, ENZYME, DRUGGABLE GENOME, PROTEASE | | SIMVASTATIN | SIMVASTATIN | 16436088 |
| 4313 | MMP2 | NEUTRAL ZINC METALLOPEPTIDASE, ENZYME, DRUGGABLE GENOME, PROTEASE | | POLYPHENOL | | 15324350 |
| 4313 | MMP2 | NEUTRAL ZINC METALLOPEPTIDASE, ENZYME, DRUGGABLE GENOME, PROTEASE | | HEPARAN SULFATE | | 12972284 |
| 4313 | MMP2 | NEUTRAL ZINC METALLOPEPTIDASE, ENZYME, DRUGGABLE GENOME, PROTEASE | | PRAVASTATIN | PRAVASTATIN | 15842807 |
| 4313 | MMP2 | NEUTRAL ZINC METALLOPEPTIDASE, ENZYME, DRUGGABLE GENOME, PROTEASE | | RO-26-2853 | | |


