
|
|||||
|
 | |
| |
| |
| |
| |
| |
|
Gene: MMP16 |
Gene summary for MMP16 |
| Gene information | Species | Human | Gene symbol | MMP16 | Gene ID | 4325 |
| Gene name | matrix metallopeptidase 16 | |
| Gene Alias | C8orf57 | |
| Cytomap | 8q21.3 | |
| Gene Type | protein-coding | GO ID | GO:0001501 | UniProtAcc | P51512 |
Top |
Malignant transformation analysis |
| Identification of the aberrant gene expression in precancerous and cancerous lesions by comparing the gene expression of stem-like cells in diseased tissues with normal stem cells |
| Entrez ID | Symbol | Replicates | Species | Organ | Tissue | Adj P-value | Log2FC | Malignancy |
| 4325 | MMP16 | HTA12-15-2 | Human | Pancreas | PDAC | 4.32e-07 | 4.42e-01 | 0.2315 |
| 4325 | MMP16 | HTA12-23-1 | Human | Pancreas | PDAC | 5.20e-08 | 7.24e-01 | 0.3405 |
| 4325 | MMP16 | HTA12-25-1 | Human | Pancreas | PDAC | 2.41e-10 | 7.08e-01 | 0.313 |
| 4325 | MMP16 | HTA12-26-1 | Human | Pancreas | PDAC | 9.17e-18 | 9.07e-01 | 0.3728 |
| 4325 | MMP16 | HTA12-29-1 | Human | Pancreas | PDAC | 5.92e-54 | 1.13e+00 | 0.3722 |
| 4325 | MMP16 | HTA12-30-1 | Human | Pancreas | PDAC | 1.14e-02 | 7.33e-01 | 0.3671 |
| 4325 | MMP16 | HTA12-32-1 | Human | Pancreas | PDAC | 4.65e-02 | 5.96e-01 | 0.3624 |
| 4325 | MMP16 | male-WTA | Human | Thyroid | PTC | 5.95e-07 | 1.39e-01 | 0.1037 |
| 4325 | MMP16 | PTC04 | Human | Thyroid | PTC | 5.14e-03 | 1.03e-01 | 0.1927 |
| 4325 | MMP16 | PTC05 | Human | Thyroid | PTC | 6.87e-11 | 4.50e-01 | 0.2065 |
| 4325 | MMP16 | PTC06 | Human | Thyroid | PTC | 1.25e-13 | 3.86e-01 | 0.2057 |
| 4325 | MMP16 | PTC07 | Human | Thyroid | PTC | 4.25e-14 | 3.00e-01 | 0.2044 |
| 4325 | MMP16 | ATC12 | Human | Thyroid | ATC | 5.95e-07 | 1.69e-01 | 0.34 |
| 4325 | MMP16 | ATC13 | Human | Thyroid | ATC | 1.89e-58 | 9.83e-01 | 0.34 |
| 4325 | MMP16 | ATC4 | Human | Thyroid | ATC | 1.51e-10 | 2.25e-01 | 0.34 |
| 4325 | MMP16 | ATC5 | Human | Thyroid | ATC | 5.67e-56 | 1.05e+00 | 0.34 |
| Page: 1 |
| Tissue | Expression Dynamics | Abbreviation |
| Thyroid | 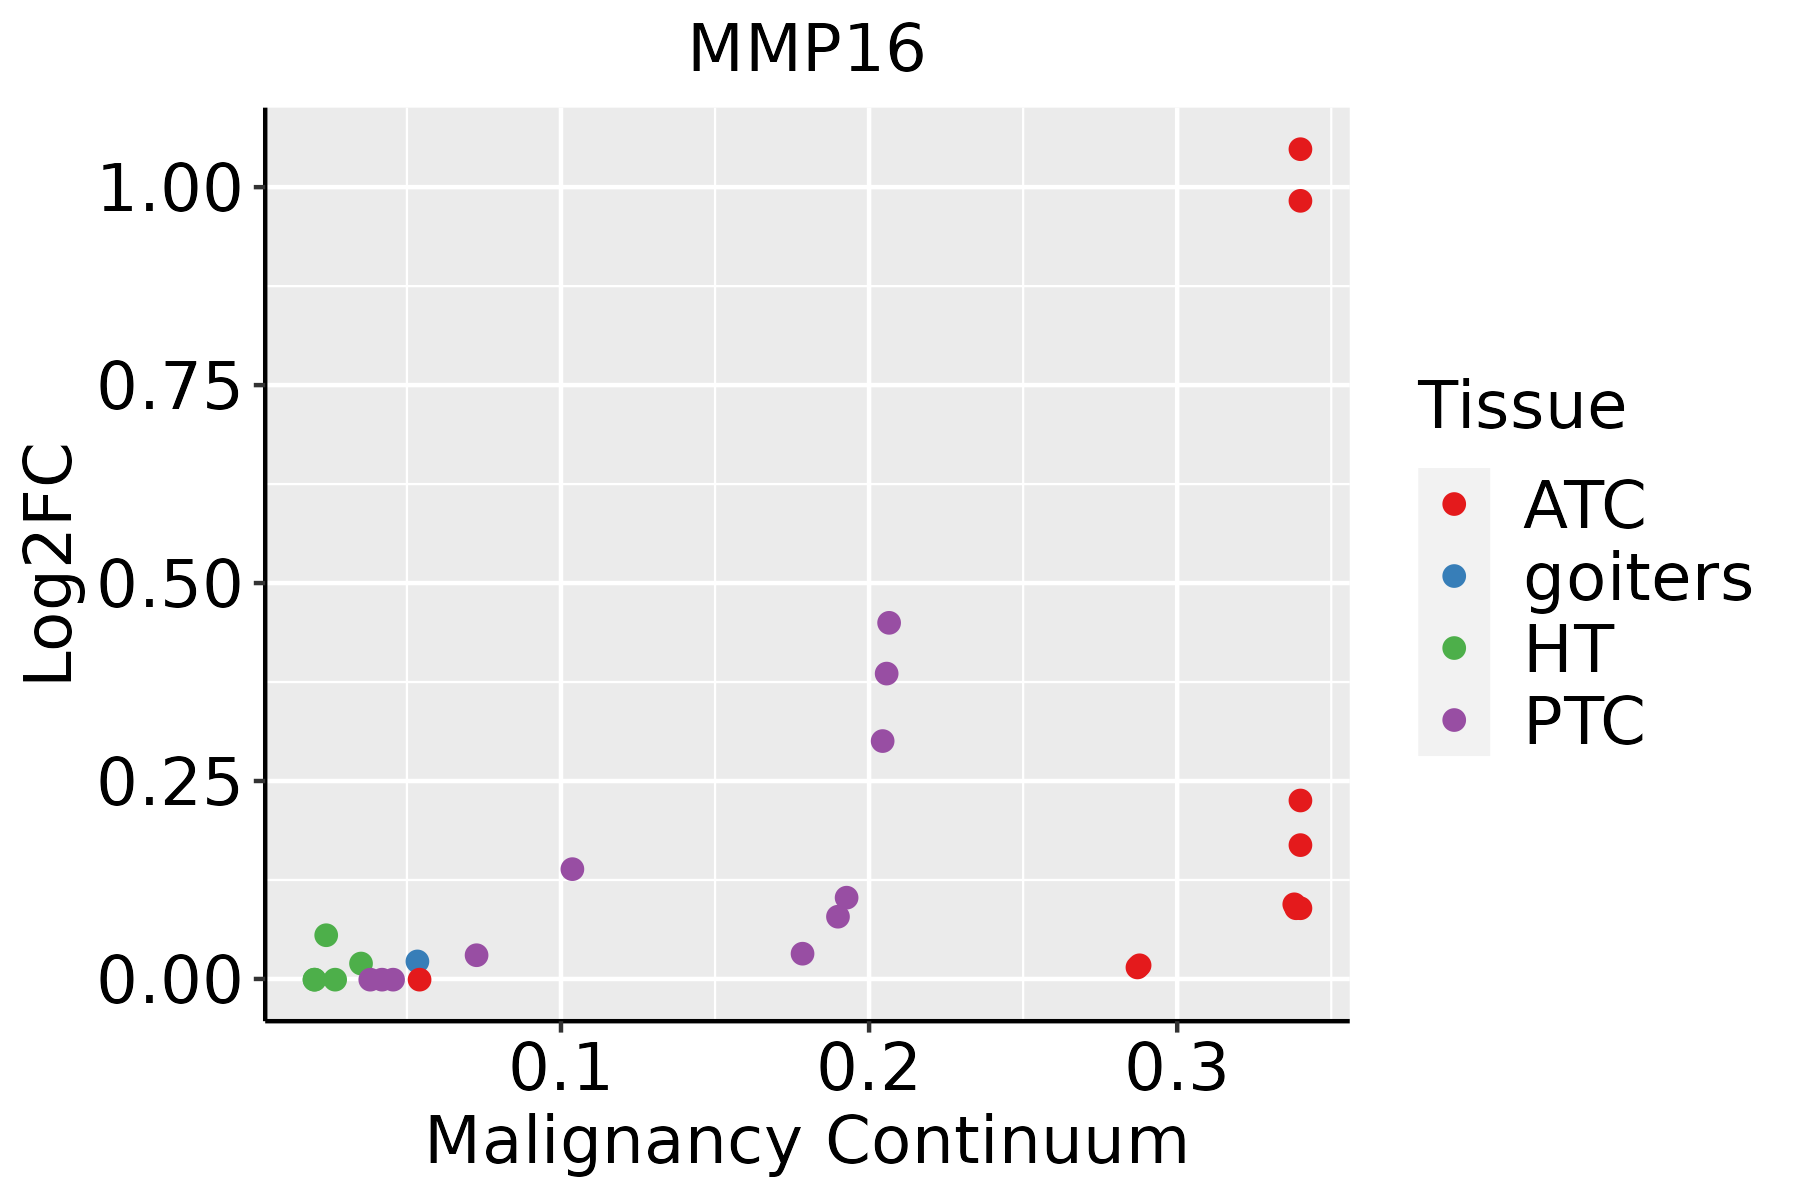 | ATC: Anaplastic thyroid cancer |
| HT: Hashimoto's thyroiditis | ||
| PTC: Papillary thyroid cancer |
| ∗log2FC in expression of this searched gene in stem-like cells from each diseased tissue sample relative to stem-like cells in normal samples in each tissue plotted against the malignancy continuum. Samples are colored based on if they are from different disease stage. |
Top |
Malignant transformation related pathway analysis |
| Find out the enriched GO biological processes and KEGG pathways involved in transition from healthy to precancer to cancer |
| Tissue | Disease Stage | Enriched GO biological Processes |
| Colorectum | AD |  |
| Colorectum | SER |  |
| Colorectum | MSS |  |
| Colorectum | MSI-H |  |
| Colorectum | FAP |  |
| ∗Top 15 enriched GO BP terms are showed in the bar plot of each disease state in each tissue. Each row represents a significant GO biological process which is colored according to the -log10(p.adjust). |
| Page: 1 2 3 4 5 6 7 8 9 |
| GO ID | Tissue | Disease Stage | Description | Gene Ratio | Bg Ratio | pvalue | p.adjust | Count |
| GO:0001503110 | Thyroid | PTC | ossification | 176/5968 | 408/18723 | 9.26e-07 | 1.40e-05 | 176 |
| GO:005160420 | Thyroid | PTC | protein maturation | 132/5968 | 294/18723 | 1.71e-06 | 2.39e-05 | 132 |
| GO:00603486 | Thyroid | PTC | bone development | 90/5968 | 205/18723 | 1.89e-04 | 1.42e-03 | 90 |
| GO:00301986 | Thyroid | PTC | extracellular matrix organization | 124/5968 | 301/18723 | 3.75e-04 | 2.53e-03 | 124 |
| GO:00430626 | Thyroid | PTC | extracellular structure organization | 124/5968 | 302/18723 | 4.38e-04 | 2.92e-03 | 124 |
| GO:00452296 | Thyroid | PTC | external encapsulating structure organization | 124/5968 | 304/18723 | 5.96e-04 | 3.79e-03 | 124 |
| GO:00164859 | Thyroid | PTC | protein processing | 95/5968 | 225/18723 | 6.60e-04 | 4.15e-03 | 95 |
| GO:000150332 | Thyroid | ATC | ossification | 206/6293 | 408/18723 | 9.23e-13 | 3.95e-11 | 206 |
| GO:003019812 | Thyroid | ATC | extracellular matrix organization | 152/6293 | 301/18723 | 8.63e-10 | 2.24e-08 | 152 |
| GO:004306212 | Thyroid | ATC | extracellular structure organization | 152/6293 | 302/18723 | 1.17e-09 | 2.94e-08 | 152 |
| GO:004522912 | Thyroid | ATC | external encapsulating structure organization | 152/6293 | 304/18723 | 2.11e-09 | 5.08e-08 | 152 |
| GO:006034813 | Thyroid | ATC | bone development | 102/6293 | 205/18723 | 1.18e-06 | 1.52e-05 | 102 |
| GO:0051604110 | Thyroid | ATC | protein maturation | 136/6293 | 294/18723 | 4.00e-06 | 4.42e-05 | 136 |
| GO:0060349 | Thyroid | ATC | bone morphogenesis | 50/6293 | 93/18723 | 4.87e-05 | 3.88e-04 | 50 |
| GO:00487053 | Thyroid | ATC | skeletal system morphogenesis | 101/6293 | 220/18723 | 9.48e-05 | 6.93e-04 | 101 |
| GO:00329633 | Thyroid | ATC | collagen metabolic process | 52/6293 | 104/18723 | 3.94e-04 | 2.38e-03 | 52 |
| GO:001648515 | Thyroid | ATC | protein processing | 100/6293 | 225/18723 | 4.39e-04 | 2.62e-03 | 100 |
| GO:19048882 | Thyroid | ATC | cranial skeletal system development | 35/6293 | 68/18723 | 1.76e-03 | 8.71e-03 | 35 |
| GO:00485688 | Thyroid | ATC | embryonic organ development | 172/6293 | 427/18723 | 2.08e-03 | 9.84e-03 | 172 |
| GO:0060350 | Thyroid | ATC | endochondral bone morphogenesis | 28/6293 | 54/18723 | 4.27e-03 | 1.80e-02 | 28 |
| Page: 1 2 |
| Pathway ID | Tissue | Disease Stage | Description | Gene Ratio | Bg Ratio | pvalue | p.adjust | qvalue | Count |
| Page: 1 |
Top |
Cell-cell communication analysis |
| Identification of potential cell-cell interactions between two cell types and their ligand-receptor pairs for different disease states |
| Ligand | Receptor | LRpair | Pathway | Tissue | Disease Stage |
| Page: 1 |
Top |
Single-cell gene regulatory network inference analysis |
| Find out the significant the regulons (TFs) and the target genes of each regulon across cell types for different disease states |
| TF | Cell Type | Tissue | Disease Stage | Target Gene | RSS | Regulon Activity |
| ∗The dot plots of a searched regulon are shown for all cell subpopulations in each disease state of each tissue based on the regulon specific score inferred using pySCENIC and by calculating the average expression. |
| Page: 1 |
Top |
Somatic mutation of malignant transformation related genes |
| Annotation of somatic variants for genes involved in malignant transformation |
| Hugo Symbol | Variant Class | Variant Classification | dbSNP RS | HGVSc | HGVSp | HGVSp Short | SWISSPROT | BIOTYPE | SIFT | PolyPhen | Tumor Sample Barcode | Tissue | Histology | Sex | Age | Stage | Therapy Types | Drugs | Outcome |
| MMP16 | SNV | Missense_Mutation | c.1639G>A | p.Asp547Asn | p.D547N | P51512 | protein_coding | tolerated(0.13) | benign(0.081) | TCGA-A7-A5ZX-01 | Breast | breast invasive carcinoma | Female | <65 | III/IV | Chemotherapy | doxorubicin | CR | |
| MMP16 | SNV | Missense_Mutation | c.1197N>A | p.Ser399Arg | p.S399R | P51512 | protein_coding | tolerated(0.36) | benign(0.009) | TCGA-A8-A09Q-01 | Breast | breast invasive carcinoma | Female | >=65 | III/IV | Hormone Therapy | anastrozole | SD | |
| MMP16 | SNV | Missense_Mutation | novel | c.713N>T | p.Asn238Ile | p.N238I | P51512 | protein_coding | tolerated(0.11) | possibly_damaging(0.861) | TCGA-B6-A400-01 | Breast | breast invasive carcinoma | Female | <65 | III/IV | Unknown | Unknown | SD |
| MMP16 | SNV | Missense_Mutation | c.1215C>A | p.Phe405Leu | p.F405L | P51512 | protein_coding | deleterious(0.01) | probably_damaging(0.966) | TCGA-BH-A0HY-01 | Breast | breast invasive carcinoma | Female | <65 | I/II | Hormone Therapy | taxotere | CR | |
| MMP16 | SNV | Missense_Mutation | c.1106G>C | p.Arg369Thr | p.R369T | P51512 | protein_coding | deleterious(0) | probably_damaging(0.989) | TCGA-E2-A10C-01 | Breast | breast invasive carcinoma | Female | <65 | I/II | Chemotherapy | cytoxan | SD | |
| MMP16 | SNV | Missense_Mutation | rs780118679 | c.272A>G | p.Asn91Ser | p.N91S | P51512 | protein_coding | tolerated(0.42) | benign(0.021) | TCGA-E2-A15S-01 | Breast | breast invasive carcinoma | Female | <65 | I/II | Chemotherapy | doxorubicin | SD |
| MMP16 | SNV | Missense_Mutation | c.182C>T | p.Ser61Leu | p.S61L | P51512 | protein_coding | deleterious(0) | possibly_damaging(0.673) | TCGA-E2-A1LI-01 | Breast | breast invasive carcinoma | Female | <65 | I/II | Chemotherapy | adriamycin | SD | |
| MMP16 | insertion | Nonsense_Mutation | novel | c.1605_1606insGTGTAATTTGTCCTAACAGCAGTATTGTCATTTTCATGTGACCTGC | p.Thr536ValfsTer2 | p.T536Vfs*2 | P51512 | protein_coding | TCGA-AR-A0TY-01 | Breast | breast invasive carcinoma | Female | <65 | I/II | Unspecific | Paclitaxel | PD | ||
| MMP16 | insertion | In_Frame_Ins | novel | c.1525_1526insTGCTCGATTTCCTCTGCCTCTCTCTTTGCCGAGCTTTCCGCG | p.Lys509delinsMetLeuAspPheLeuCysLeuSerLeuCysArgAlaPheArgGlu | p.K509delinsMLDFLCLSLCRAFRE | P51512 | protein_coding | TCGA-B6-A0IJ-01 | Breast | breast invasive carcinoma | Female | <65 | I/II | Unknown | Unknown | SD | ||
| MMP16 | SNV | Missense_Mutation | novel | c.1705N>C | p.Ile569Leu | p.I569L | P51512 | protein_coding | tolerated(0.26) | benign(0.163) | TCGA-DS-A7WI-01 | Cervix | cervical & endocervical cancer | Female | <65 | I/II | Chemotherapy | cisplatin | PD |
| Page: 1 2 3 4 5 6 7 8 9 10 11 12 13 14 15 16 17 18 19 20 |
Top |
Related drugs of malignant transformation related genes |
| Identification of chemicals and drugs interact with genes involved in malignant transfromation |
| (DGIdb 4.0) |
| Entrez ID | Symbol | Category | Interaction Types | Drug Claim Name | Drug Name | PMIDs |
| 4325 | MMP16 | CELL SURFACE, DRUGGABLE GENOME, PROTEASE, ENZYME | inhibitor | 252166829 | ||
| 4325 | MMP16 | CELL SURFACE, DRUGGABLE GENOME, PROTEASE, ENZYME | inhibitor | 178103981 | ILOMASTAT |
| Page: 1 |

Copyright 2023-Present -The University of Texas Health Science Center at Houston |