
|
|||||
|
 | |
| |
| |
| |
| |
| |
|
Gene: MMP15 |
Gene summary for MMP15 |
| Gene information | Species | Human | Gene symbol | MMP15 | Gene ID | 4324 |
| Gene name | matrix metallopeptidase 15 | |
| Gene Alias | MMP-15 | |
| Cytomap | 16q21 | |
| Gene Type | protein-coding | GO ID | GO:0001704 | UniProtAcc | A0A024R6U8 |
Top |
Malignant transformation analysis |
| Identification of the aberrant gene expression in precancerous and cancerous lesions by comparing the gene expression of stem-like cells in diseased tissues with normal stem cells |
| Entrez ID | Symbol | Replicates | Species | Organ | Tissue | Adj P-value | Log2FC | Malignancy |
| 4324 | MMP15 | P1T-E | Human | Esophagus | ESCC | 3.62e-02 | 2.49e-01 | 0.0875 |
| 4324 | MMP15 | P4T-E | Human | Esophagus | ESCC | 4.44e-04 | 1.74e-01 | 0.1323 |
| 4324 | MMP15 | P5T-E | Human | Esophagus | ESCC | 8.24e-04 | 5.14e-02 | 0.1327 |
| 4324 | MMP15 | P8T-E | Human | Esophagus | ESCC | 2.04e-09 | 3.12e-01 | 0.0889 |
| 4324 | MMP15 | P11T-E | Human | Esophagus | ESCC | 1.43e-03 | 3.60e-01 | 0.1426 |
| 4324 | MMP15 | P17T-E | Human | Esophagus | ESCC | 6.52e-03 | 2.86e-01 | 0.1278 |
| 4324 | MMP15 | P19T-E | Human | Esophagus | ESCC | 3.84e-02 | 2.54e-01 | 0.1662 |
| 4324 | MMP15 | P21T-E | Human | Esophagus | ESCC | 5.07e-08 | 1.35e-01 | 0.1617 |
| 4324 | MMP15 | P23T-E | Human | Esophagus | ESCC | 2.38e-03 | 1.64e-01 | 0.108 |
| 4324 | MMP15 | P24T-E | Human | Esophagus | ESCC | 1.06e-06 | 1.11e-01 | 0.1287 |
| 4324 | MMP15 | P26T-E | Human | Esophagus | ESCC | 2.02e-03 | 1.83e-02 | 0.1276 |
| 4324 | MMP15 | P28T-E | Human | Esophagus | ESCC | 1.48e-11 | 1.57e-01 | 0.1149 |
| 4324 | MMP15 | P37T-E | Human | Esophagus | ESCC | 1.78e-04 | 2.04e-01 | 0.1371 |
| 4324 | MMP15 | P39T-E | Human | Esophagus | ESCC | 1.30e-03 | 6.61e-02 | 0.0894 |
| 4324 | MMP15 | P42T-E | Human | Esophagus | ESCC | 1.75e-02 | 1.98e-01 | 0.1175 |
| 4324 | MMP15 | P47T-E | Human | Esophagus | ESCC | 2.21e-10 | 8.03e-02 | 0.1067 |
| 4324 | MMP15 | P48T-E | Human | Esophagus | ESCC | 3.41e-03 | 5.04e-02 | 0.0959 |
| 4324 | MMP15 | P52T-E | Human | Esophagus | ESCC | 2.82e-05 | 8.85e-02 | 0.1555 |
| 4324 | MMP15 | P54T-E | Human | Esophagus | ESCC | 1.40e-03 | 1.22e-01 | 0.0975 |
| 4324 | MMP15 | P57T-E | Human | Esophagus | ESCC | 9.92e-07 | 5.95e-02 | 0.0926 |
| Page: 1 2 3 |
| Tissue | Expression Dynamics | Abbreviation |
| Esophagus | 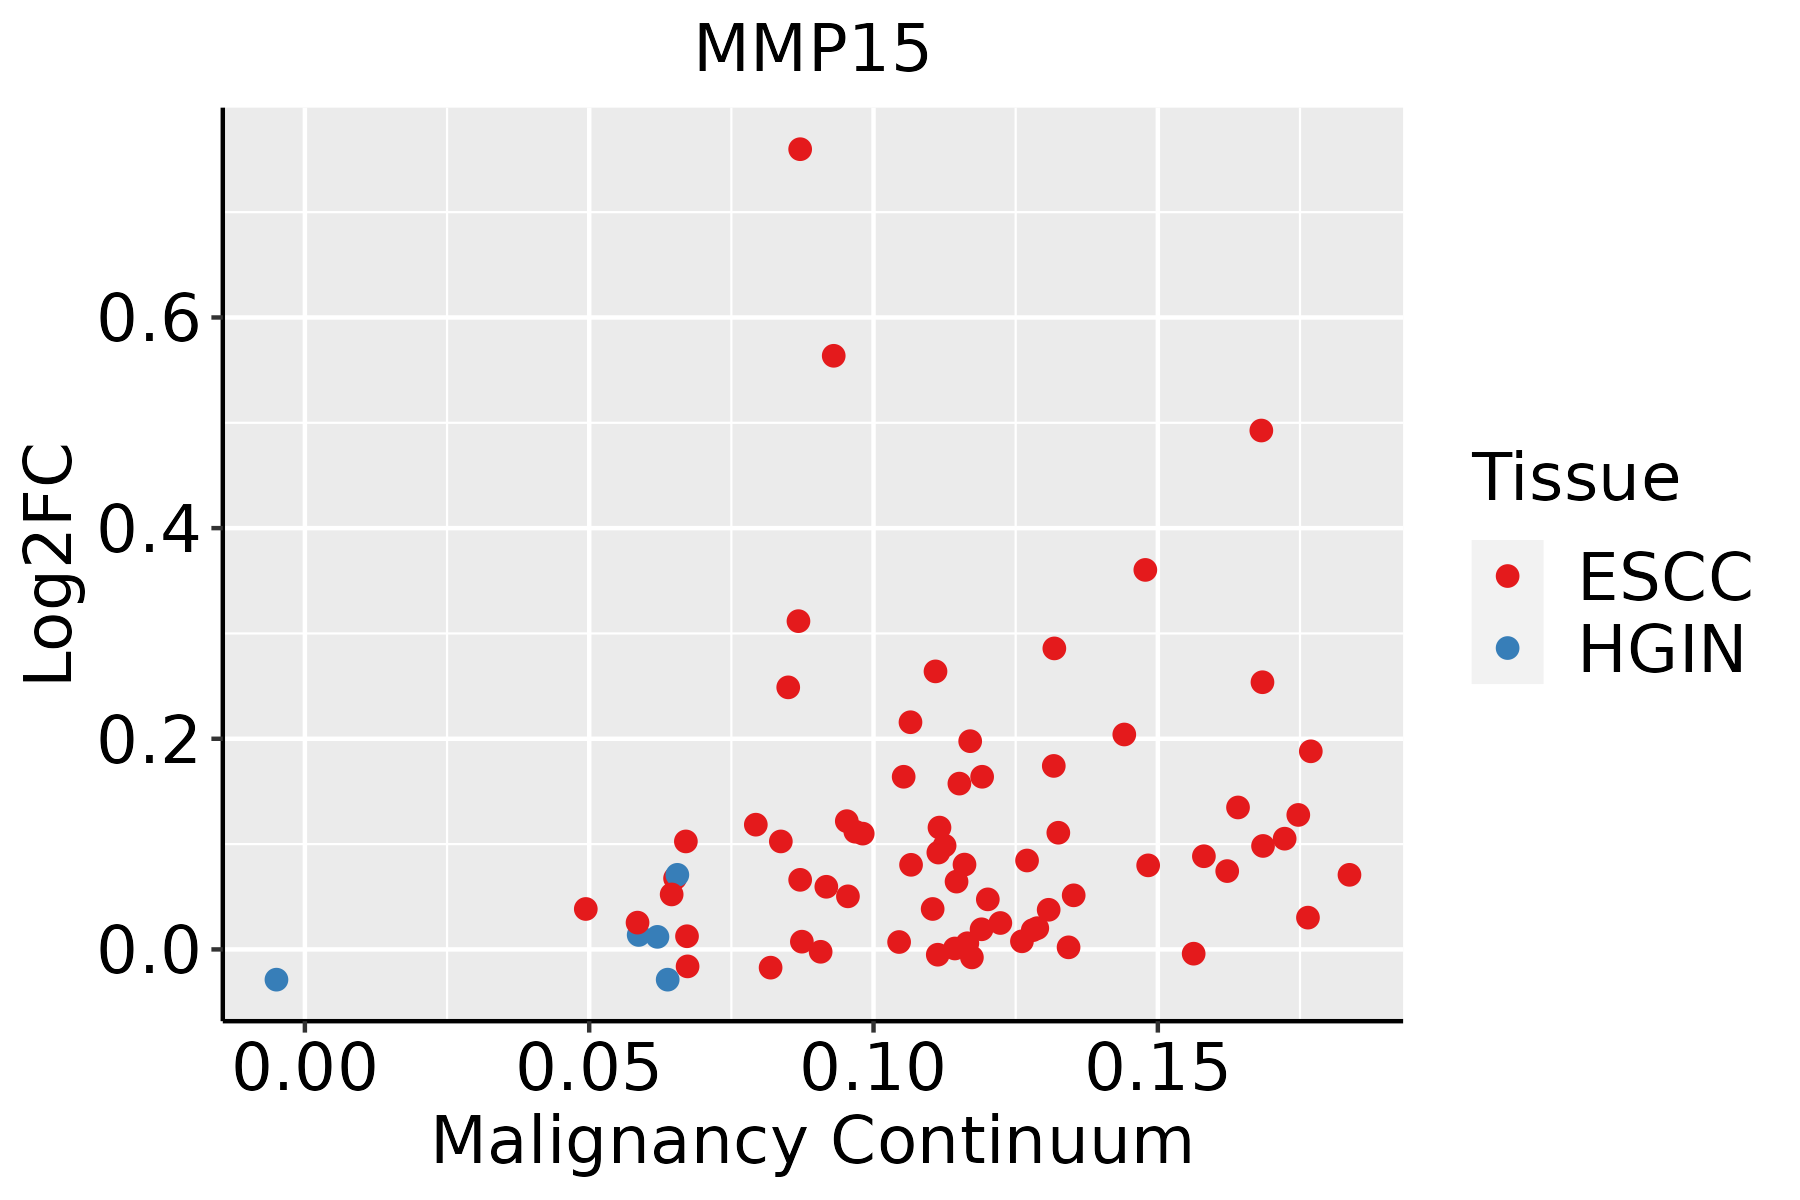 | ESCC: Esophageal squamous cell carcinoma |
| HGIN: High-grade intraepithelial neoplasias | ||
| LGIN: Low-grade intraepithelial neoplasias | ||
| Liver |  | HCC: Hepatocellular carcinoma |
| NAFLD: Non-alcoholic fatty liver disease | ||
| Thyroid | 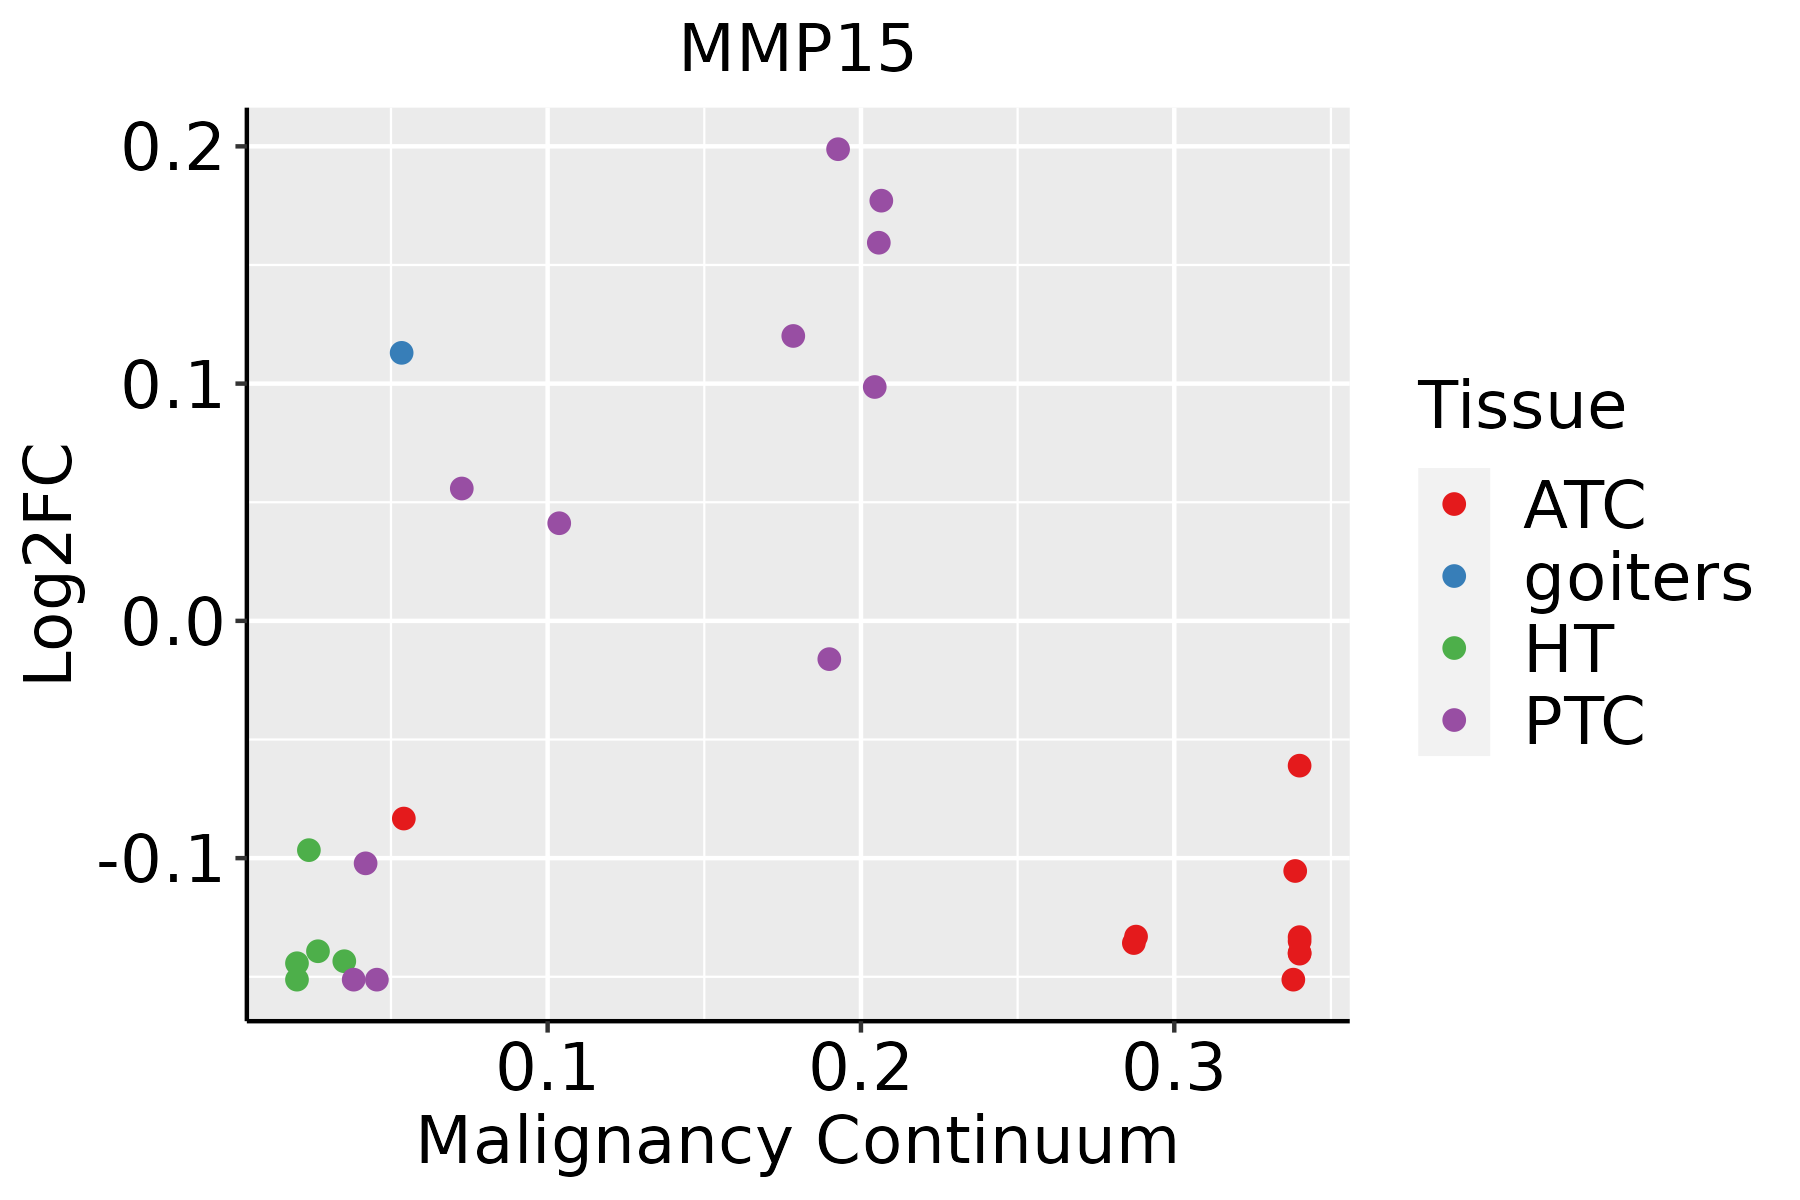 | ATC: Anaplastic thyroid cancer |
| HT: Hashimoto's thyroiditis | ||
| PTC: Papillary thyroid cancer |
| ∗log2FC in expression of this searched gene in stem-like cells from each diseased tissue sample relative to stem-like cells in normal samples in each tissue plotted against the malignancy continuum. Samples are colored based on if they are from different disease stage. |
Top |
Malignant transformation related pathway analysis |
| Find out the enriched GO biological processes and KEGG pathways involved in transition from healthy to precancer to cancer |
| Tissue | Disease Stage | Enriched GO biological Processes |
| Colorectum | AD |  |
| Colorectum | SER |  |
| Colorectum | MSS |  |
| Colorectum | MSI-H |  |
| Colorectum | FAP |  |
| ∗Top 15 enriched GO BP terms are showed in the bar plot of each disease state in each tissue. Each row represents a significant GO biological process which is colored according to the -log10(p.adjust). |
| Page: 1 2 3 4 5 6 7 8 9 |
| GO ID | Tissue | Disease Stage | Description | Gene Ratio | Bg Ratio | pvalue | p.adjust | Count |
| GO:0022411111 | Esophagus | ESCC | cellular component disassembly | 305/8552 | 443/18723 | 1.94e-23 | 4.57e-21 | 305 |
| GO:00073698 | Esophagus | ESCC | gastrulation | 115/8552 | 185/18723 | 4.35e-06 | 4.64e-05 | 115 |
| GO:00074926 | Esophagus | ESCC | endoderm development | 54/8552 | 77/18723 | 1.20e-05 | 1.12e-04 | 54 |
| GO:00301984 | Esophagus | ESCC | extracellular matrix organization | 171/8552 | 301/18723 | 6.08e-05 | 4.67e-04 | 171 |
| GO:00430624 | Esophagus | ESCC | extracellular structure organization | 171/8552 | 302/18723 | 7.73e-05 | 5.76e-04 | 171 |
| GO:00452294 | Esophagus | ESCC | external encapsulating structure organization | 172/8552 | 304/18723 | 7.80e-05 | 5.80e-04 | 172 |
| GO:00017064 | Esophagus | ESCC | endoderm formation | 38/8552 | 54/18723 | 2.08e-04 | 1.31e-03 | 38 |
| GO:00017044 | Esophagus | ESCC | formation of primary germ layer | 75/8552 | 121/18723 | 2.17e-04 | 1.36e-03 | 75 |
| GO:00359873 | Esophagus | ESCC | endodermal cell differentiation | 32/8552 | 45/18723 | 4.87e-04 | 2.70e-03 | 32 |
| GO:00329631 | Esophagus | ESCC | collagen metabolic process | 62/8552 | 104/18723 | 2.90e-03 | 1.22e-02 | 62 |
| GO:00226172 | Esophagus | ESCC | extracellular matrix disassembly | 39/8552 | 63/18723 | 6.92e-03 | 2.52e-02 | 39 |
| GO:00224117 | Liver | Cirrhotic | cellular component disassembly | 182/4634 | 443/18723 | 1.59e-14 | 1.54e-12 | 182 |
| GO:00323551 | Liver | Cirrhotic | response to estradiol | 51/4634 | 141/18723 | 1.60e-03 | 1.04e-02 | 51 |
| GO:0007492 | Liver | Cirrhotic | endoderm development | 29/4634 | 77/18723 | 8.02e-03 | 3.76e-02 | 29 |
| GO:002241112 | Liver | HCC | cellular component disassembly | 282/7958 | 443/18723 | 1.02e-19 | 1.38e-17 | 282 |
| GO:00323552 | Liver | HCC | response to estradiol | 81/7958 | 141/18723 | 2.39e-04 | 1.79e-03 | 81 |
| GO:00074921 | Liver | HCC | endoderm development | 43/7958 | 77/18723 | 1.24e-02 | 4.51e-02 | 43 |
| GO:0022411113 | Thyroid | PTC | cellular component disassembly | 232/5968 | 443/18723 | 1.36e-19 | 1.75e-17 | 232 |
| GO:000736910 | Thyroid | PTC | gastrulation | 84/5968 | 185/18723 | 7.58e-05 | 6.52e-04 | 84 |
| GO:00017046 | Thyroid | PTC | formation of primary germ layer | 57/5968 | 121/18723 | 3.23e-04 | 2.23e-03 | 57 |
| Page: 1 2 |
| Pathway ID | Tissue | Disease Stage | Description | Gene Ratio | Bg Ratio | pvalue | p.adjust | qvalue | Count |
| hsa0492816 | Esophagus | ESCC | Parathyroid hormone synthesis, secretion and action | 66/4205 | 106/8465 | 5.86e-03 | 1.47e-02 | 7.51e-03 | 66 |
| hsa0492817 | Esophagus | ESCC | Parathyroid hormone synthesis, secretion and action | 66/4205 | 106/8465 | 5.86e-03 | 1.47e-02 | 7.51e-03 | 66 |
| Page: 1 |
Top |
Cell-cell communication analysis |
| Identification of potential cell-cell interactions between two cell types and their ligand-receptor pairs for different disease states |
| Ligand | Receptor | LRpair | Pathway | Tissue | Disease Stage |
| Page: 1 |
Top |
Single-cell gene regulatory network inference analysis |
| Find out the significant the regulons (TFs) and the target genes of each regulon across cell types for different disease states |
| TF | Cell Type | Tissue | Disease Stage | Target Gene | RSS | Regulon Activity |
| ∗The dot plots of a searched regulon are shown for all cell subpopulations in each disease state of each tissue based on the regulon specific score inferred using pySCENIC and by calculating the average expression. |
| Page: 1 |
Top |
Somatic mutation of malignant transformation related genes |
| Annotation of somatic variants for genes involved in malignant transformation |
| Hugo Symbol | Variant Class | Variant Classification | dbSNP RS | HGVSc | HGVSp | HGVSp Short | SWISSPROT | BIOTYPE | SIFT | PolyPhen | Tumor Sample Barcode | Tissue | Histology | Sex | Age | Stage | Therapy Types | Drugs | Outcome |
| MMP15 | SNV | Missense_Mutation | rs201766277 | c.172N>T | p.Arg58Trp | p.R58W | P51511 | protein_coding | deleterious(0) | probably_damaging(0.949) | TCGA-AO-A128-01 | Breast | breast invasive carcinoma | Female | <65 | I/II | Chemotherapy | doxorubicin | SD |
| MMP15 | SNV | Missense_Mutation | c.749G>A | p.Gly250Glu | p.G250E | P51511 | protein_coding | deleterious(0) | probably_damaging(1) | TCGA-D8-A1JA-01 | Breast | breast invasive carcinoma | Female | <65 | III/IV | Chemotherapy | adriamycin | PD | |
| MMP15 | SNV | Missense_Mutation | c.1015N>A | p.Pro339Thr | p.P339T | P51511 | protein_coding | tolerated(0.28) | benign(0.42) | TCGA-E2-A10A-01 | Breast | breast invasive carcinoma | Female | <65 | I/II | Hormone Therapy | zoladex | SD | |
| MMP15 | SNV | Missense_Mutation | novel | c.1209N>G | p.Asn403Lys | p.N403K | P51511 | protein_coding | deleterious(0.04) | possibly_damaging(0.856) | TCGA-LL-A5YP-01 | Breast | breast invasive carcinoma | Female | <65 | I/II | Chemotherapy | cytoxan | SD |
| MMP15 | SNV | Missense_Mutation | novel | c.816C>A | p.Asn272Lys | p.N272K | P51511 | protein_coding | deleterious(0) | possibly_damaging(0.871) | TCGA-OL-A5D6-01 | Breast | breast invasive carcinoma | Female | >=65 | I/II | Unknown | Unknown | SD |
| MMP15 | SNV | Missense_Mutation | rs757782458 | c.1225G>A | p.Gly409Arg | p.G409R | P51511 | protein_coding | deleterious(0.02) | benign(0.393) | TCGA-2W-A8YY-01 | Cervix | cervical & endocervical cancer | Female | <65 | I/II | Chemotherapy | cisplatin | CR |
| MMP15 | SNV | Missense_Mutation | rs757678463 | c.385N>T | p.Arg129Trp | p.R129W | P51511 | protein_coding | deleterious(0) | probably_damaging(0.972) | TCGA-FU-A3WB-01 | Cervix | cervical & endocervical cancer | Female | <65 | I/II | Chemotherapy | cisplatin | CR |
| MMP15 | SNV | Missense_Mutation | rs751230902 | c.1403N>T | p.Thr468Met | p.T468M | P51511 | protein_coding | deleterious(0.03) | possibly_damaging(0.835) | TCGA-VS-A8EH-01 | Cervix | cervical & endocervical cancer | Female | <65 | III/IV | Chemotherapy | cisplatin | CR |
| MMP15 | SNV | Missense_Mutation | c.1267T>C | p.Tyr423His | p.Y423H | P51511 | protein_coding | deleterious(0) | probably_damaging(0.998) | TCGA-A6-3809-01 | Colorectum | colon adenocarcinoma | Female | >=65 | I/II | Unknown | Unknown | SD | |
| MMP15 | SNV | Missense_Mutation | c.644C>A | p.Thr215Asn | p.T215N | P51511 | protein_coding | deleterious(0.03) | benign(0.024) | TCGA-AA-3697-01 | Colorectum | colon adenocarcinoma | Male | >=65 | I/II | Unknown | Unknown | SD |
| Page: 1 2 3 4 5 6 |
Top |
Related drugs of malignant transformation related genes |
| Identification of chemicals and drugs interact with genes involved in malignant transfromation |
| (DGIdb 4.0) |
| Entrez ID | Symbol | Category | Interaction Types | Drug Claim Name | Drug Name | PMIDs |
| 4324 | MMP15 | DRUGGABLE GENOME, PROTEASE, ENZYME | inhibitor | 252166829 | ||
| 4324 | MMP15 | DRUGGABLE GENOME, PROTEASE, ENZYME | inhibitor | 178103981 | ILOMASTAT |
| Page: 1 |

Copyright 2023-Present -The University of Texas Health Science Center at Houston |