
|
|||||
|
 | |
| |
| |
| |
| |
| |
|
Gene: MMP14 |
Gene summary for MMP14 |
| Gene information | Species | Human | Gene symbol | MMP14 | Gene ID | 4323 |
| Gene name | matrix metallopeptidase 14 | |
| Gene Alias | MMP-14 | |
| Cytomap | 14q11.2 | |
| Gene Type | protein-coding | GO ID | GO:0000003 | UniProtAcc | P50281 |
Top |
Malignant transformation analysis |
| Identification of the aberrant gene expression in precancerous and cancerous lesions by comparing the gene expression of stem-like cells in diseased tissues with normal stem cells |
| Entrez ID | Symbol | Replicates | Species | Organ | Tissue | Adj P-value | Log2FC | Malignancy |
| 4323 | MMP14 | LZE2T | Human | Esophagus | ESCC | 5.56e-03 | 4.30e-01 | 0.082 |
| 4323 | MMP14 | LZE4T | Human | Esophagus | ESCC | 1.19e-11 | 5.76e-01 | 0.0811 |
| 4323 | MMP14 | LZE5T | Human | Esophagus | ESCC | 1.80e-04 | 2.44e-01 | 0.0514 |
| 4323 | MMP14 | LZE8T | Human | Esophagus | ESCC | 1.21e-05 | 2.94e-01 | 0.067 |
| 4323 | MMP14 | LZE22D1 | Human | Esophagus | HGIN | 3.39e-02 | -2.12e-02 | 0.0595 |
| 4323 | MMP14 | LZE22T | Human | Esophagus | ESCC | 1.15e-10 | 2.68e-01 | 0.068 |
| 4323 | MMP14 | LZE24T | Human | Esophagus | ESCC | 5.98e-12 | 3.45e-01 | 0.0596 |
| 4323 | MMP14 | P2T-E | Human | Esophagus | ESCC | 7.68e-28 | 7.48e-01 | 0.1177 |
| 4323 | MMP14 | P4T-E | Human | Esophagus | ESCC | 2.18e-24 | 1.03e+00 | 0.1323 |
| 4323 | MMP14 | P5T-E | Human | Esophagus | ESCC | 3.37e-21 | 7.76e-01 | 0.1327 |
| 4323 | MMP14 | P8T-E | Human | Esophagus | ESCC | 7.91e-22 | 5.82e-01 | 0.0889 |
| 4323 | MMP14 | P9T-E | Human | Esophagus | ESCC | 3.01e-18 | 8.26e-01 | 0.1131 |
| 4323 | MMP14 | P10T-E | Human | Esophagus | ESCC | 1.43e-56 | 1.48e+00 | 0.116 |
| 4323 | MMP14 | P11T-E | Human | Esophagus | ESCC | 4.71e-34 | 1.89e+00 | 0.1426 |
| 4323 | MMP14 | P12T-E | Human | Esophagus | ESCC | 1.19e-60 | 1.50e+00 | 0.1122 |
| 4323 | MMP14 | P15T-E | Human | Esophagus | ESCC | 2.83e-58 | 1.90e+00 | 0.1149 |
| 4323 | MMP14 | P16T-E | Human | Esophagus | ESCC | 1.92e-32 | 7.07e-01 | 0.1153 |
| 4323 | MMP14 | P17T-E | Human | Esophagus | ESCC | 1.33e-07 | 8.85e-01 | 0.1278 |
| 4323 | MMP14 | P19T-E | Human | Esophagus | ESCC | 9.37e-12 | 2.02e+00 | 0.1662 |
| 4323 | MMP14 | P20T-E | Human | Esophagus | ESCC | 2.43e-14 | 4.27e-01 | 0.1124 |
| Page: 1 2 3 4 5 6 |
| Tissue | Expression Dynamics | Abbreviation |
| Esophagus |  | ESCC: Esophageal squamous cell carcinoma |
| HGIN: High-grade intraepithelial neoplasias | ||
| LGIN: Low-grade intraepithelial neoplasias | ||
| Liver | 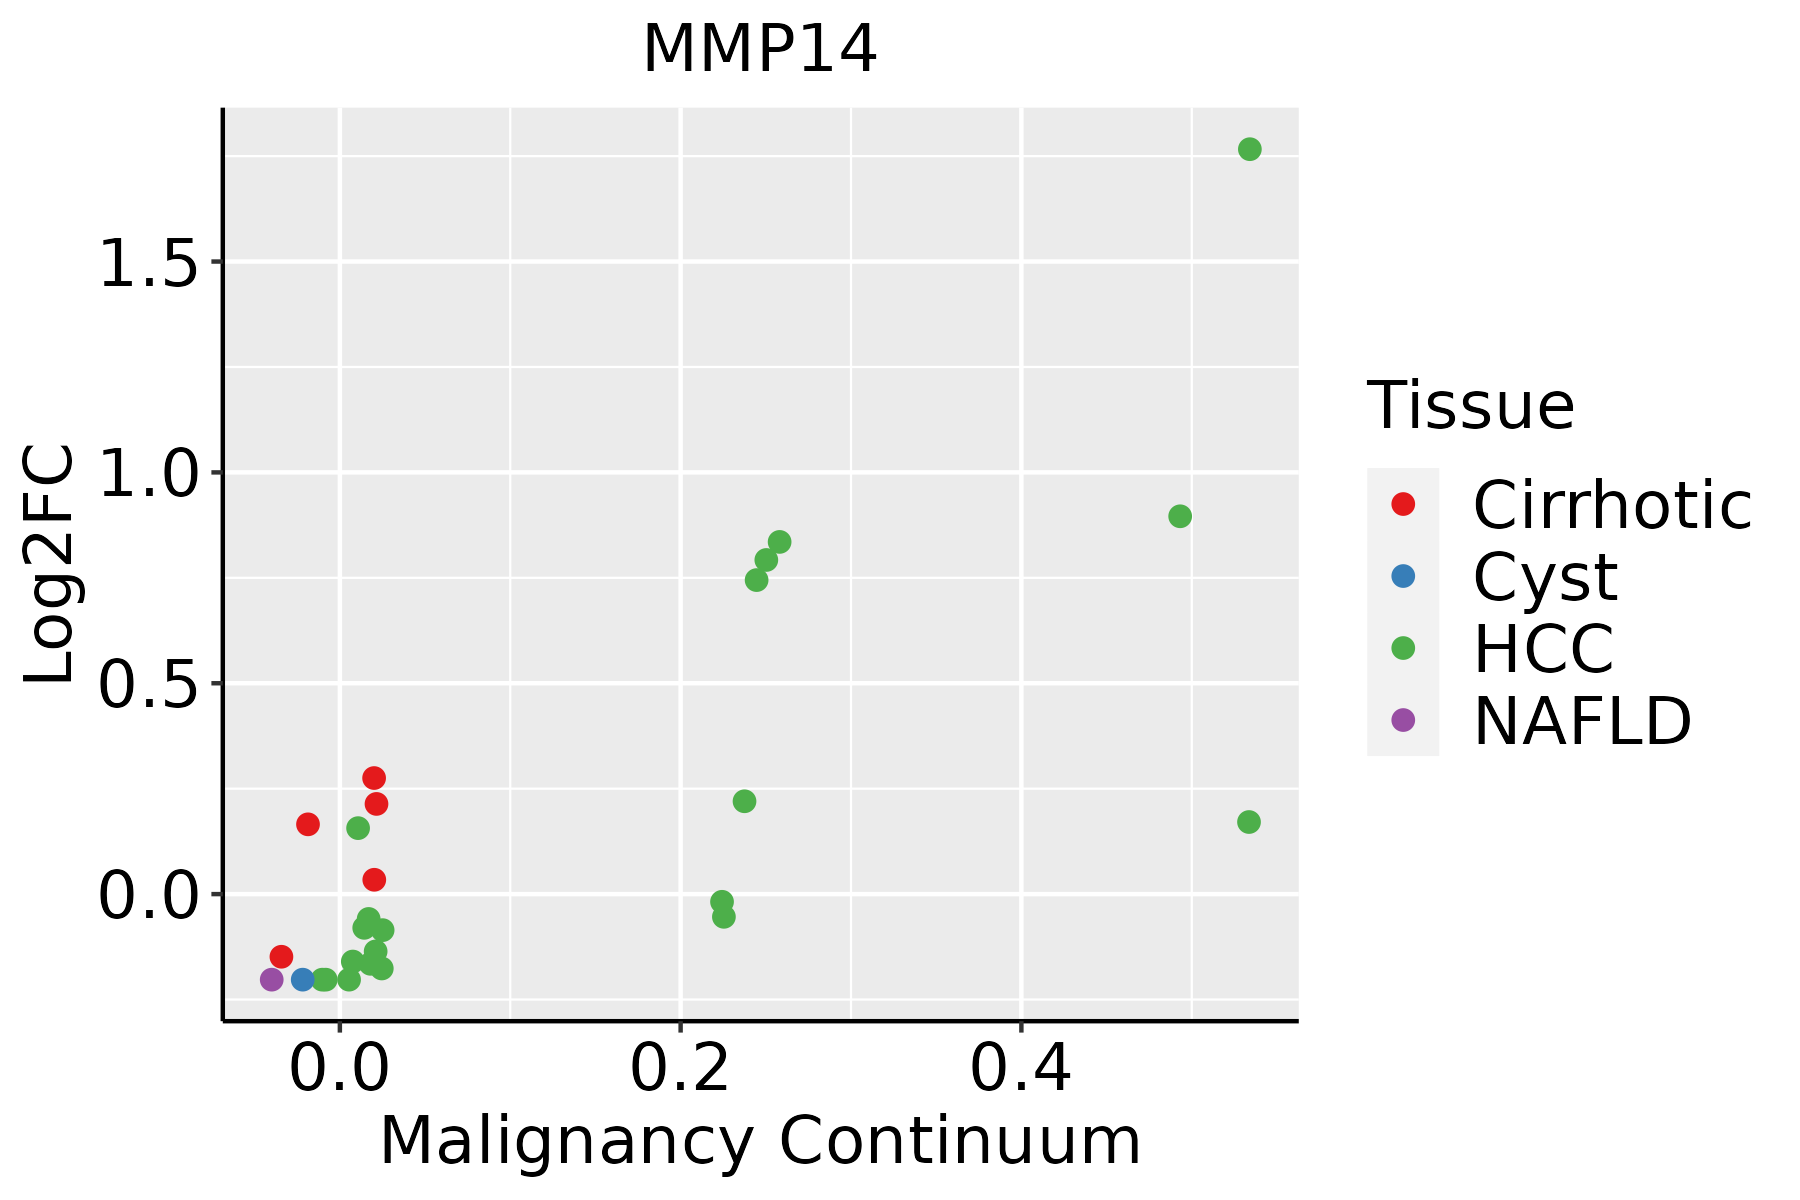 | HCC: Hepatocellular carcinoma |
| NAFLD: Non-alcoholic fatty liver disease | ||
| Oral Cavity | 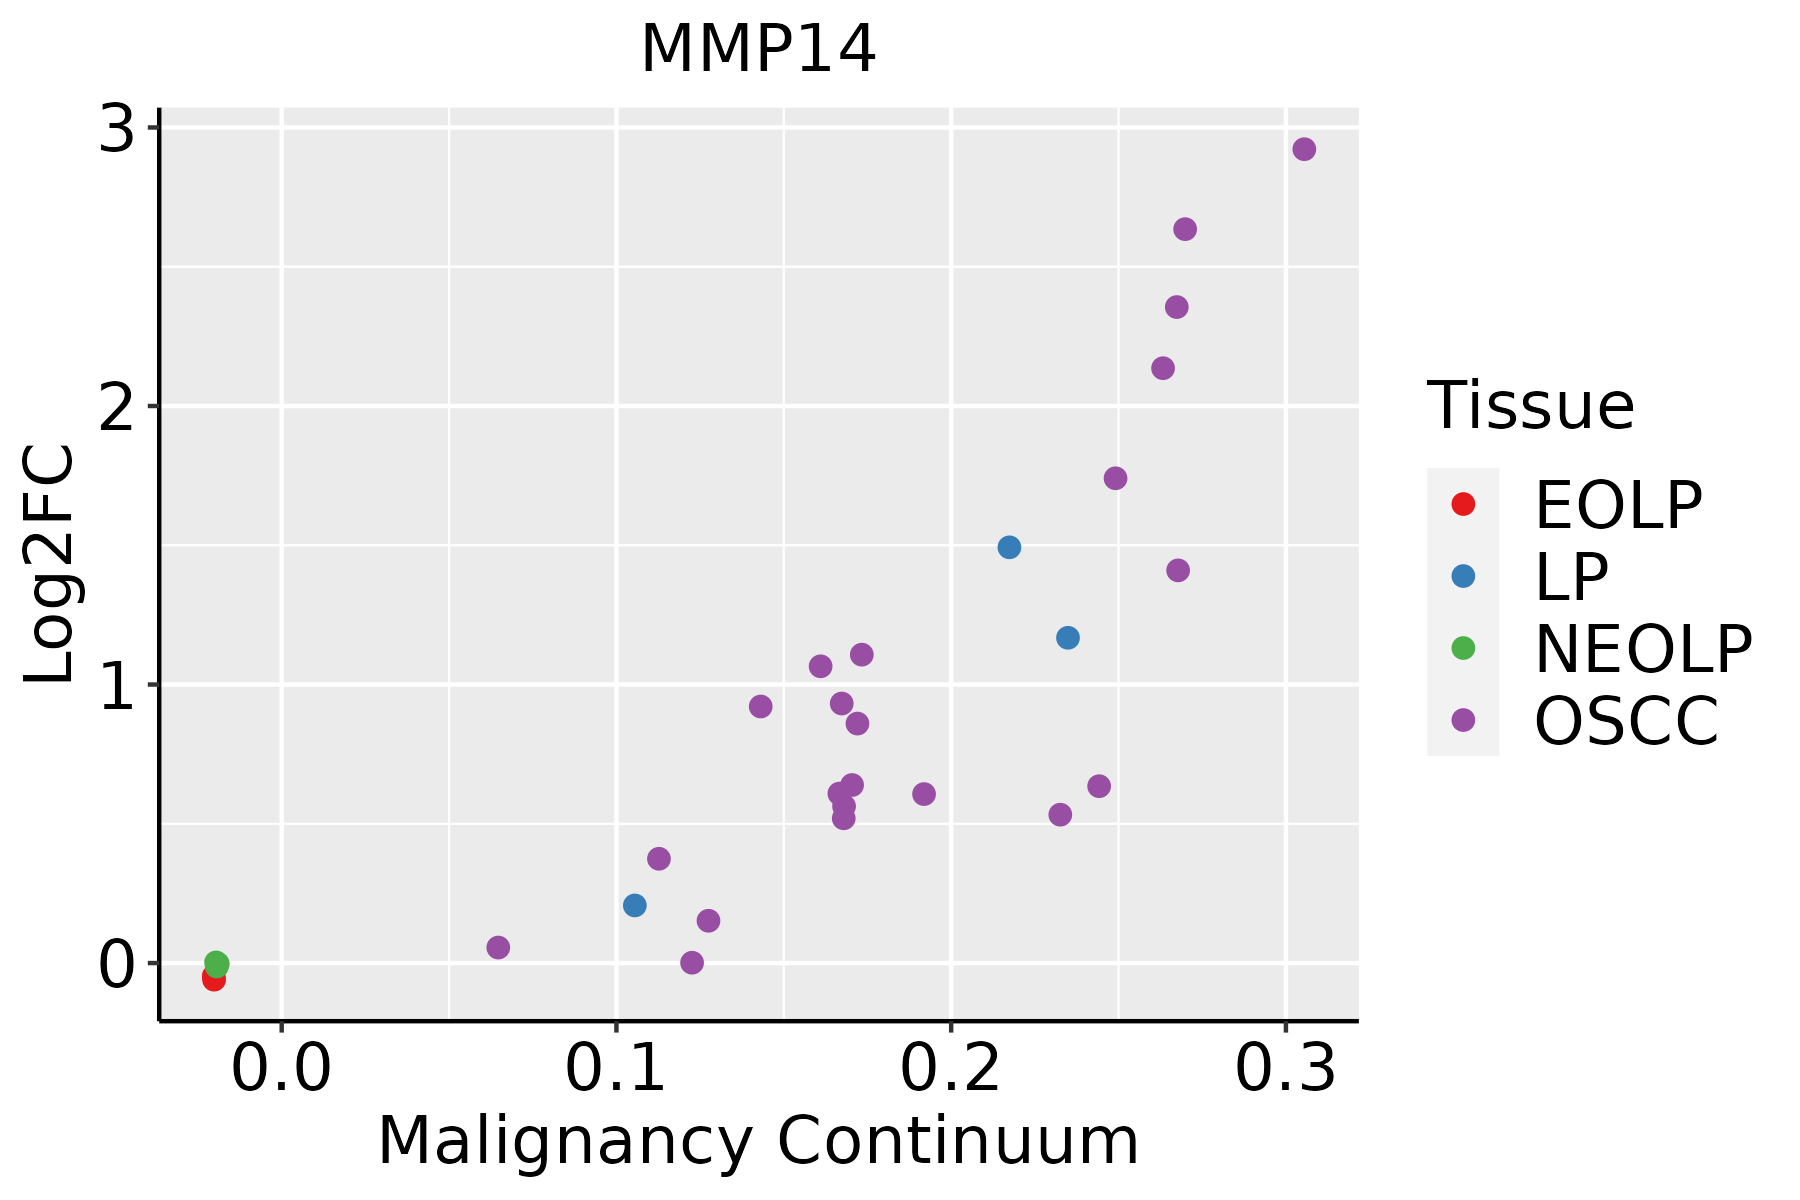 | EOLP: Erosive Oral lichen planus |
| LP: leukoplakia | ||
| NEOLP: Non-erosive oral lichen planus | ||
| OSCC: Oral squamous cell carcinoma | ||
| Skin | 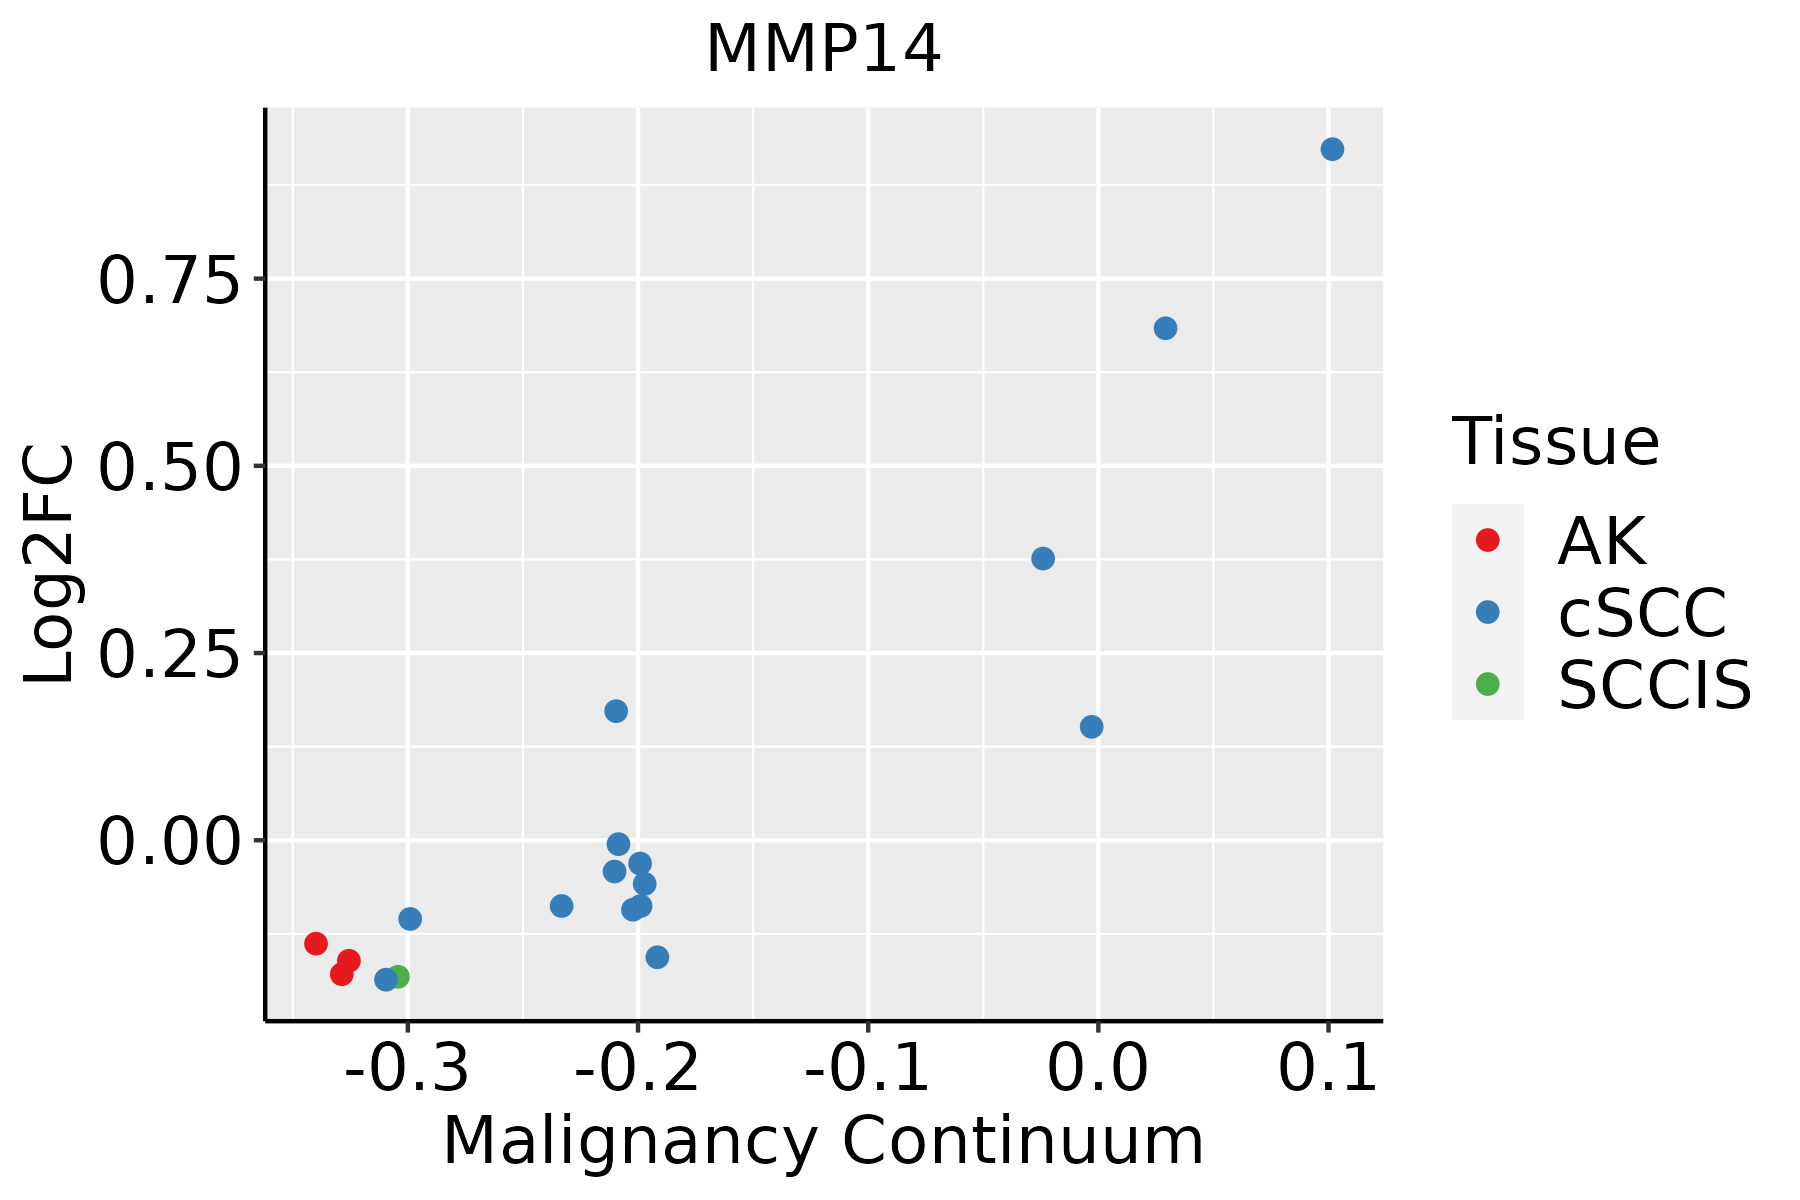 | AK: Actinic keratosis |
| cSCC: Cutaneous squamous cell carcinoma | ||
| SCCIS:squamous cell carcinoma in situ | ||
| Thyroid | 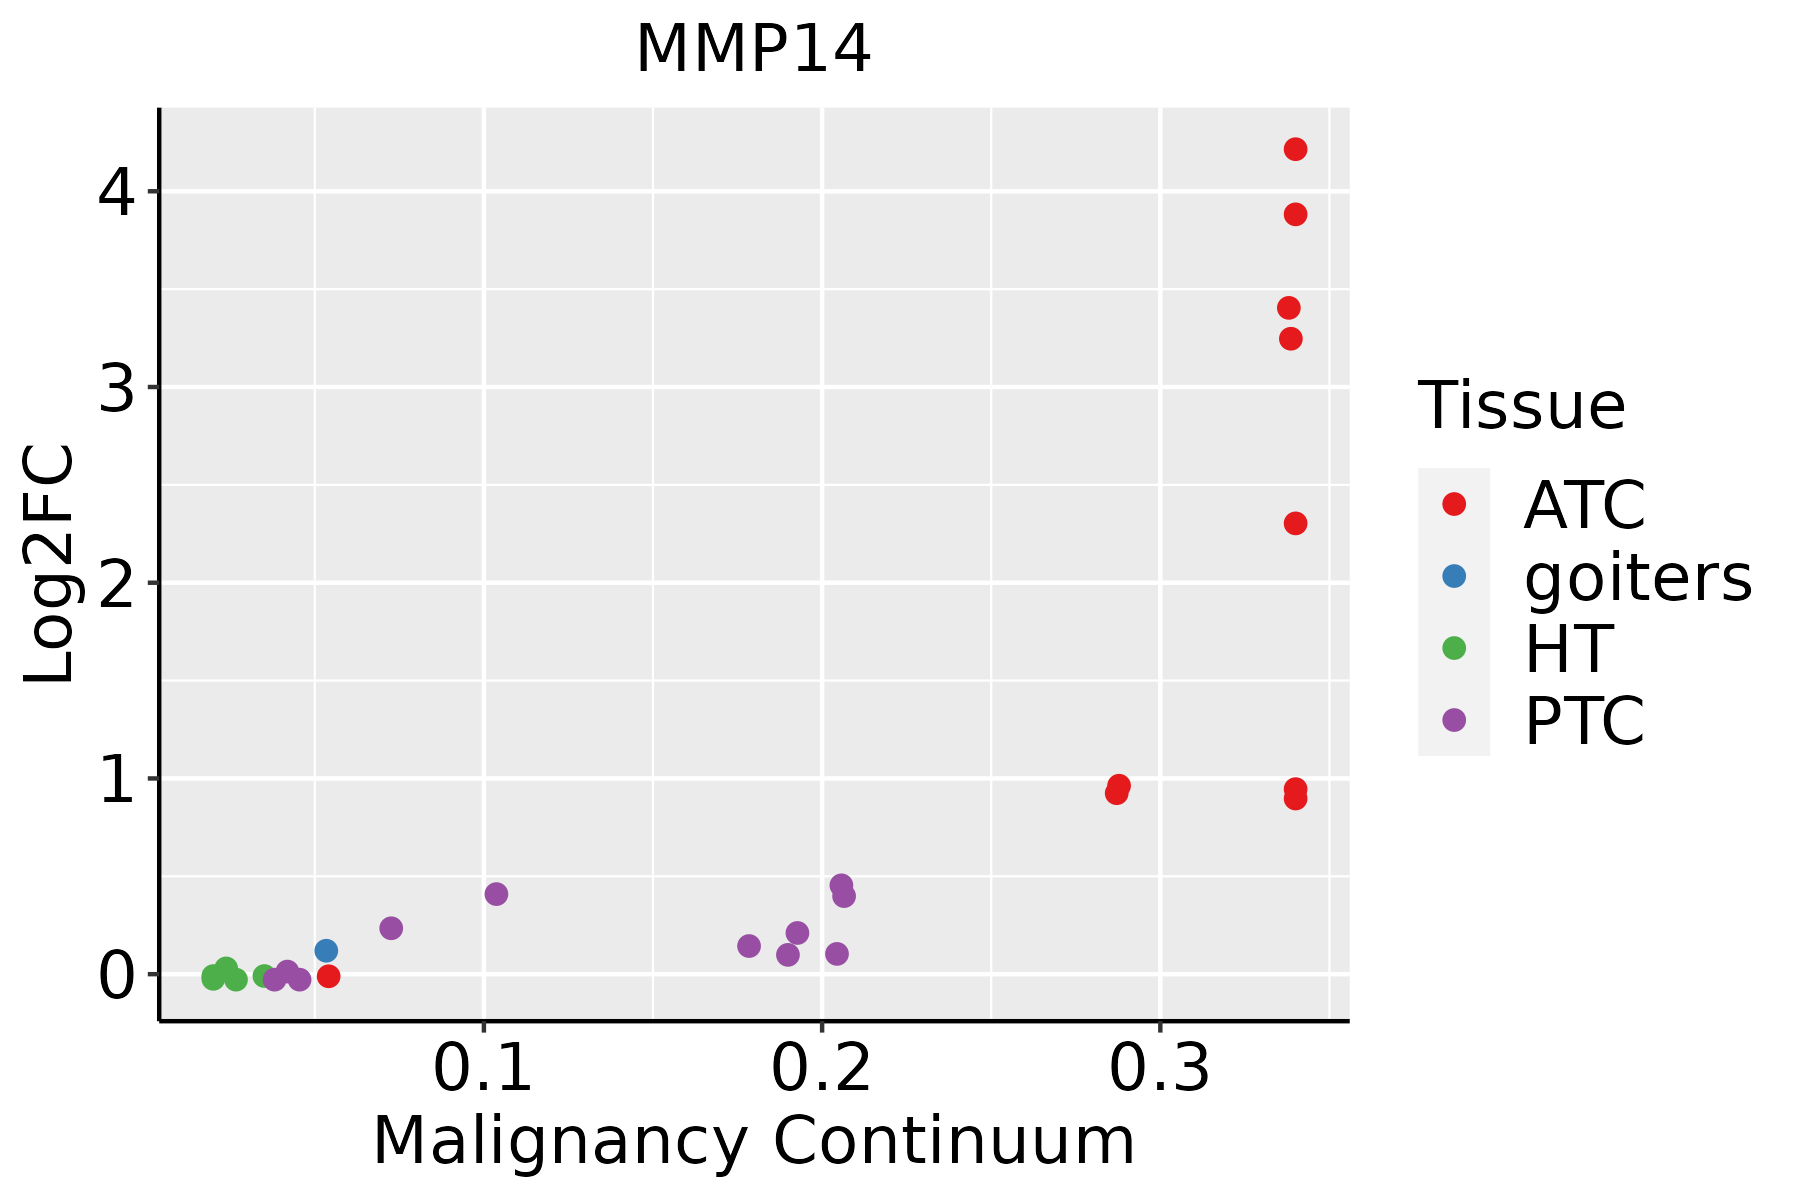 | ATC: Anaplastic thyroid cancer |
| HT: Hashimoto's thyroiditis | ||
| PTC: Papillary thyroid cancer |
| ∗log2FC in expression of this searched gene in stem-like cells from each diseased tissue sample relative to stem-like cells in normal samples in each tissue plotted against the malignancy continuum. Samples are colored based on if they are from different disease stage. |
Top |
Malignant transformation related pathway analysis |
| Find out the enriched GO biological processes and KEGG pathways involved in transition from healthy to precancer to cancer |
| Tissue | Disease Stage | Enriched GO biological Processes |
| Colorectum | AD |  |
| Colorectum | SER |  |
| Colorectum | MSS |  |
| Colorectum | MSI-H |  |
| Colorectum | FAP |  |
| ∗Top 15 enriched GO BP terms are showed in the bar plot of each disease state in each tissue. Each row represents a significant GO biological process which is colored according to the -log10(p.adjust). |
| Page: 1 2 3 4 5 6 7 8 9 |
| GO ID | Tissue | Disease Stage | Description | Gene Ratio | Bg Ratio | pvalue | p.adjust | Count |
| GO:004586227 | Esophagus | HGIN | positive regulation of proteolysis | 107/2587 | 372/18723 | 2.61e-14 | 4.60e-12 | 107 |
| GO:000697927 | Esophagus | HGIN | response to oxidative stress | 107/2587 | 446/18723 | 3.91e-09 | 2.76e-07 | 107 |
| GO:002241120 | Esophagus | HGIN | cellular component disassembly | 102/2587 | 443/18723 | 8.31e-08 | 4.33e-06 | 102 |
| GO:005160417 | Esophagus | HGIN | protein maturation | 68/2587 | 294/18723 | 9.77e-06 | 2.86e-04 | 68 |
| GO:007265920 | Esophagus | HGIN | protein localization to plasma membrane | 66/2587 | 284/18723 | 1.11e-05 | 3.18e-04 | 66 |
| GO:007048220 | Esophagus | HGIN | response to oxygen levels | 76/2587 | 347/18723 | 2.36e-05 | 6.25e-04 | 76 |
| GO:003629320 | Esophagus | HGIN | response to decreased oxygen levels | 70/2587 | 322/18723 | 6.23e-05 | 1.44e-03 | 70 |
| GO:000166620 | Esophagus | HGIN | response to hypoxia | 67/2587 | 307/18723 | 7.82e-05 | 1.75e-03 | 67 |
| GO:190547518 | Esophagus | HGIN | regulation of protein localization to membrane | 43/2587 | 175/18723 | 9.45e-05 | 2.03e-03 | 43 |
| GO:199077818 | Esophagus | HGIN | protein localization to cell periphery | 71/2587 | 333/18723 | 1.05e-04 | 2.24e-03 | 71 |
| GO:190307619 | Esophagus | HGIN | regulation of protein localization to plasma membrane | 28/2587 | 104/18723 | 3.07e-04 | 5.15e-03 | 28 |
| GO:190437518 | Esophagus | HGIN | regulation of protein localization to cell periphery | 32/2587 | 125/18723 | 3.23e-04 | 5.39e-03 | 32 |
| GO:001604919 | Esophagus | HGIN | cell growth | 93/2587 | 482/18723 | 4.49e-04 | 6.62e-03 | 93 |
| GO:00164857 | Esophagus | HGIN | protein processing | 49/2587 | 225/18723 | 7.04e-04 | 9.52e-03 | 49 |
| GO:19033173 | Esophagus | HGIN | regulation of protein maturation | 18/2587 | 67/18723 | 3.52e-03 | 3.24e-02 | 18 |
| GO:190370620 | Esophagus | HGIN | regulation of hemopoiesis | 69/2587 | 367/18723 | 4.39e-03 | 3.86e-02 | 69 |
| GO:015011519 | Esophagus | HGIN | cell-substrate junction organization | 24/2587 | 101/18723 | 4.85e-03 | 4.16e-02 | 24 |
| GO:000155818 | Esophagus | HGIN | regulation of cell growth | 76/2587 | 414/18723 | 5.40e-03 | 4.42e-02 | 76 |
| GO:000150316 | Esophagus | HGIN | ossification | 75/2587 | 408/18723 | 5.49e-03 | 4.49e-02 | 75 |
| GO:006145819 | Esophagus | HGIN | reproductive system development | 78/2587 | 427/18723 | 5.53e-03 | 4.52e-02 | 78 |
| Page: 1 2 3 4 5 6 7 8 9 10 11 12 13 14 15 16 17 18 19 20 21 22 |
| Pathway ID | Tissue | Disease Stage | Description | Gene Ratio | Bg Ratio | pvalue | p.adjust | qvalue | Count |
| hsa0466810 | Esophagus | ESCC | TNF signaling pathway | 89/4205 | 114/8465 | 3.36e-10 | 4.01e-09 | 2.06e-09 | 89 |
| hsa0492816 | Esophagus | ESCC | Parathyroid hormone synthesis, secretion and action | 66/4205 | 106/8465 | 5.86e-03 | 1.47e-02 | 7.51e-03 | 66 |
| hsa0466817 | Esophagus | ESCC | TNF signaling pathway | 89/4205 | 114/8465 | 3.36e-10 | 4.01e-09 | 2.06e-09 | 89 |
| hsa0492817 | Esophagus | ESCC | Parathyroid hormone synthesis, secretion and action | 66/4205 | 106/8465 | 5.86e-03 | 1.47e-02 | 7.51e-03 | 66 |
| hsa046684 | Liver | HCC | TNF signaling pathway | 73/4020 | 114/8465 | 2.53e-04 | 1.19e-03 | 6.63e-04 | 73 |
| hsa0466811 | Liver | HCC | TNF signaling pathway | 73/4020 | 114/8465 | 2.53e-04 | 1.19e-03 | 6.63e-04 | 73 |
| hsa046689 | Oral cavity | OSCC | TNF signaling pathway | 82/3704 | 114/8465 | 8.30e-10 | 9.59e-09 | 4.88e-09 | 82 |
| hsa0466816 | Oral cavity | OSCC | TNF signaling pathway | 82/3704 | 114/8465 | 8.30e-10 | 9.59e-09 | 4.88e-09 | 82 |
| hsa0466822 | Oral cavity | LP | TNF signaling pathway | 49/2418 | 114/8465 | 6.51e-04 | 3.29e-03 | 2.12e-03 | 49 |
| hsa0466832 | Oral cavity | LP | TNF signaling pathway | 49/2418 | 114/8465 | 6.51e-04 | 3.29e-03 | 2.12e-03 | 49 |
| Page: 1 |
Top |
Cell-cell communication analysis |
| Identification of potential cell-cell interactions between two cell types and their ligand-receptor pairs for different disease states |
| Ligand | Receptor | LRpair | Pathway | Tissue | Disease Stage |
| Page: 1 |
Top |
Single-cell gene regulatory network inference analysis |
| Find out the significant the regulons (TFs) and the target genes of each regulon across cell types for different disease states |
| TF | Cell Type | Tissue | Disease Stage | Target Gene | RSS | Regulon Activity |
| ∗The dot plots of a searched regulon are shown for all cell subpopulations in each disease state of each tissue based on the regulon specific score inferred using pySCENIC and by calculating the average expression. |
| Page: 1 |
Top |
Somatic mutation of malignant transformation related genes |
| Annotation of somatic variants for genes involved in malignant transformation |
| Hugo Symbol | Variant Class | Variant Classification | dbSNP RS | HGVSc | HGVSp | HGVSp Short | SWISSPROT | BIOTYPE | SIFT | PolyPhen | Tumor Sample Barcode | Tissue | Histology | Sex | Age | Stage | Therapy Types | Drugs | Outcome |
| MMP14 | SNV | Missense_Mutation | c.679N>A | p.Asp227Asn | p.D227N | P50281 | protein_coding | tolerated(0.88) | benign(0.015) | TCGA-AC-A23H-01 | Breast | breast invasive carcinoma | Female | >=65 | I/II | Unknown | Unknown | PD | |
| MMP14 | SNV | Missense_Mutation | rs774971754 | c.1027C>T | p.Arg343Trp | p.R343W | P50281 | protein_coding | deleterious(0) | probably_damaging(1) | TCGA-AC-A5XU-01 | Breast | breast invasive carcinoma | Female | >=65 | I/II | Hormone Therapy | letrozole | SD |
| MMP14 | SNV | Missense_Mutation | c.1369G>A | p.Glu457Lys | p.E457K | P50281 | protein_coding | tolerated(1) | benign(0.003) | TCGA-AR-A1AP-01 | Breast | breast invasive carcinoma | Female | >=65 | I/II | Hormone Therapy | anastrozole | SD | |
| MMP14 | SNV | Missense_Mutation | c.384C>G | p.Ile128Met | p.I128M | P50281 | protein_coding | deleterious(0) | probably_damaging(0.975) | TCGA-D8-A1JC-01 | Breast | breast invasive carcinoma | Female | <65 | III/IV | Chemotherapy | adriamycin | SD | |
| MMP14 | SNV | Missense_Mutation | rs770606883 | c.1186G>A | p.Glu396Lys | p.E396K | P50281 | protein_coding | deleterious(0.02) | possibly_damaging(0.806) | TCGA-VS-A9UR-01 | Cervix | cervical & endocervical cancer | Female | <65 | I/II | Chemotherapy | cisplatin | PD |
| MMP14 | SNV | Missense_Mutation | rs748601843 | c.445N>T | p.Arg149Cys | p.R149C | P50281 | protein_coding | deleterious(0.03) | possibly_damaging(0.832) | TCGA-A6-A565-01 | Colorectum | colon adenocarcinoma | Female | <65 | III/IV | Unspecific | 5FU | PD |
| MMP14 | SNV | Missense_Mutation | c.790N>G | p.Met264Val | p.M264V | P50281 | protein_coding | deleterious(0.03) | benign(0.382) | TCGA-AA-3966-01 | Colorectum | colon adenocarcinoma | Female | >=65 | I/II | Unknown | Unknown | SD | |
| MMP14 | SNV | Missense_Mutation | c.433C>T | p.Arg145Cys | p.R145C | P50281 | protein_coding | deleterious(0) | probably_damaging(0.999) | TCGA-AA-3977-01 | Colorectum | colon adenocarcinoma | Male | >=65 | I/II | Unknown | Unknown | SD | |
| MMP14 | SNV | Missense_Mutation | c.5N>A | p.Ser2Tyr | p.S2Y | P50281 | protein_coding | tolerated_low_confidence(0.06) | benign(0) | TCGA-AA-A010-01 | Colorectum | colon adenocarcinoma | Female | <65 | I/II | Chemotherapy | folinic | CR | |
| MMP14 | SNV | Missense_Mutation | rs758484236 | c.1607C>T | p.Ala536Val | p.A536V | P50281 | protein_coding | tolerated(0.21) | benign(0.012) | TCGA-EI-6507-01 | Colorectum | rectum adenocarcinoma | Male | <65 | I/II | Unknown | Unknown | SD |
| Page: 1 2 3 4 5 6 |
Top |
Related drugs of malignant transformation related genes |
| Identification of chemicals and drugs interact with genes involved in malignant transfromation |
| (DGIdb 4.0) |
| Entrez ID | Symbol | Category | Interaction Types | Drug Claim Name | Drug Name | PMIDs |
| 4323 | MMP14 | PROTEASE, DRUGGABLE GENOME, ENZYME | inhibitor | 252166779 | ||
| 4323 | MMP14 | PROTEASE, DRUGGABLE GENOME, ENZYME | inhibitor | 252827503 | CGS-27023A | |
| 4323 | MMP14 | PROTEASE, DRUGGABLE GENOME, ENZYME | CARMINIC ACID | CARMINIC ACID | ||
| 4323 | MMP14 | PROTEASE, DRUGGABLE GENOME, ENZYME | inhibitor | 178103981 | ILOMASTAT | |
| 4323 | MMP14 | PROTEASE, DRUGGABLE GENOME, ENZYME | vaccine | PRINOMASTAT | PRINOMASTAT | |
| 4323 | MMP14 | PROTEASE, DRUGGABLE GENOME, ENZYME | Epigallocatechin gallate | |||
| 4323 | MMP14 | PROTEASE, DRUGGABLE GENOME, ENZYME | BT-1718 | |||
| 4323 | MMP14 | PROTEASE, DRUGGABLE GENOME, ENZYME | inhibitor | 405560328 | ||
| 4323 | MMP14 | PROTEASE, DRUGGABLE GENOME, ENZYME | PYROGALLOL RED | PYROGALLOL RED | ||
| 4323 | MMP14 | PROTEASE, DRUGGABLE GENOME, ENZYME | GM6001 |
| Page: 1 |

Copyright 2023-Present -The University of Texas Health Science Center at Houston |