
|
|||||
|
 | |
| |
| |
| |
| |
| |
|
Gene: MMP13 |
Gene summary for MMP13 |
| Gene information | Species | Human | Gene symbol | MMP13 | Gene ID | 4322 |
| Gene name | matrix metallopeptidase 13 | |
| Gene Alias | CLG3 | |
| Cytomap | 11q22.2 | |
| Gene Type | protein-coding | GO ID | GO:0001501 | UniProtAcc | P45452 |
Top |
Malignant transformation analysis |
| Identification of the aberrant gene expression in precancerous and cancerous lesions by comparing the gene expression of stem-like cells in diseased tissues with normal stem cells |
| Entrez ID | Symbol | Replicates | Species | Organ | Tissue | Adj P-value | Log2FC | Malignancy |
| 4322 | MMP13 | CA_HPV_2 | Human | Cervix | CC | 5.08e-08 | 3.09e-01 | 0.0391 |
| 4322 | MMP13 | Tumor | Human | Cervix | CC | 1.05e-35 | 7.73e-01 | 0.1241 |
| 4322 | MMP13 | sample3 | Human | Cervix | CC | 1.81e-29 | 7.02e-01 | 0.1387 |
| 4322 | MMP13 | T3 | Human | Cervix | CC | 4.19e-29 | 6.74e-01 | 0.1389 |
| 4322 | MMP13 | LZE5T | Human | Esophagus | ESCC | 1.57e-02 | 3.63e-01 | 0.0514 |
| 4322 | MMP13 | LZE20T | Human | Esophagus | ESCC | 1.85e-18 | 1.07e+00 | 0.0662 |
| 4322 | MMP13 | P5T-E | Human | Esophagus | ESCC | 3.97e-04 | 1.69e-01 | 0.1327 |
| 4322 | MMP13 | P8T-E | Human | Esophagus | ESCC | 4.44e-08 | 5.10e-01 | 0.0889 |
| 4322 | MMP13 | P11T-E | Human | Esophagus | ESCC | 4.80e-15 | 2.15e+00 | 0.1426 |
| 4322 | MMP13 | P21T-E | Human | Esophagus | ESCC | 7.90e-03 | 2.47e-01 | 0.1617 |
| 4322 | MMP13 | P26T-E | Human | Esophagus | ESCC | 7.90e-03 | 1.90e-01 | 0.1276 |
| 4322 | MMP13 | P31T-E | Human | Esophagus | ESCC | 4.31e-06 | 6.06e-01 | 0.1251 |
| 4322 | MMP13 | P32T-E | Human | Esophagus | ESCC | 2.86e-20 | 1.07e+00 | 0.1666 |
| 4322 | MMP13 | P37T-E | Human | Esophagus | ESCC | 9.12e-49 | 2.36e+00 | 0.1371 |
| 4322 | MMP13 | P40T-E | Human | Esophagus | ESCC | 7.96e-15 | 9.77e-01 | 0.109 |
| 4322 | MMP13 | P44T-E | Human | Esophagus | ESCC | 1.46e-07 | 7.64e-01 | 0.1096 |
| 4322 | MMP13 | P47T-E | Human | Esophagus | ESCC | 2.02e-06 | 4.34e-01 | 0.1067 |
| 4322 | MMP13 | P54T-E | Human | Esophagus | ESCC | 5.47e-11 | 4.56e-01 | 0.0975 |
| 4322 | MMP13 | P57T-E | Human | Esophagus | ESCC | 4.12e-11 | 9.83e-01 | 0.0926 |
| 4322 | MMP13 | P62T-E | Human | Esophagus | ESCC | 4.71e-09 | 6.87e-01 | 0.1302 |
| Page: 1 2 |
| Tissue | Expression Dynamics | Abbreviation |
| Cervix | 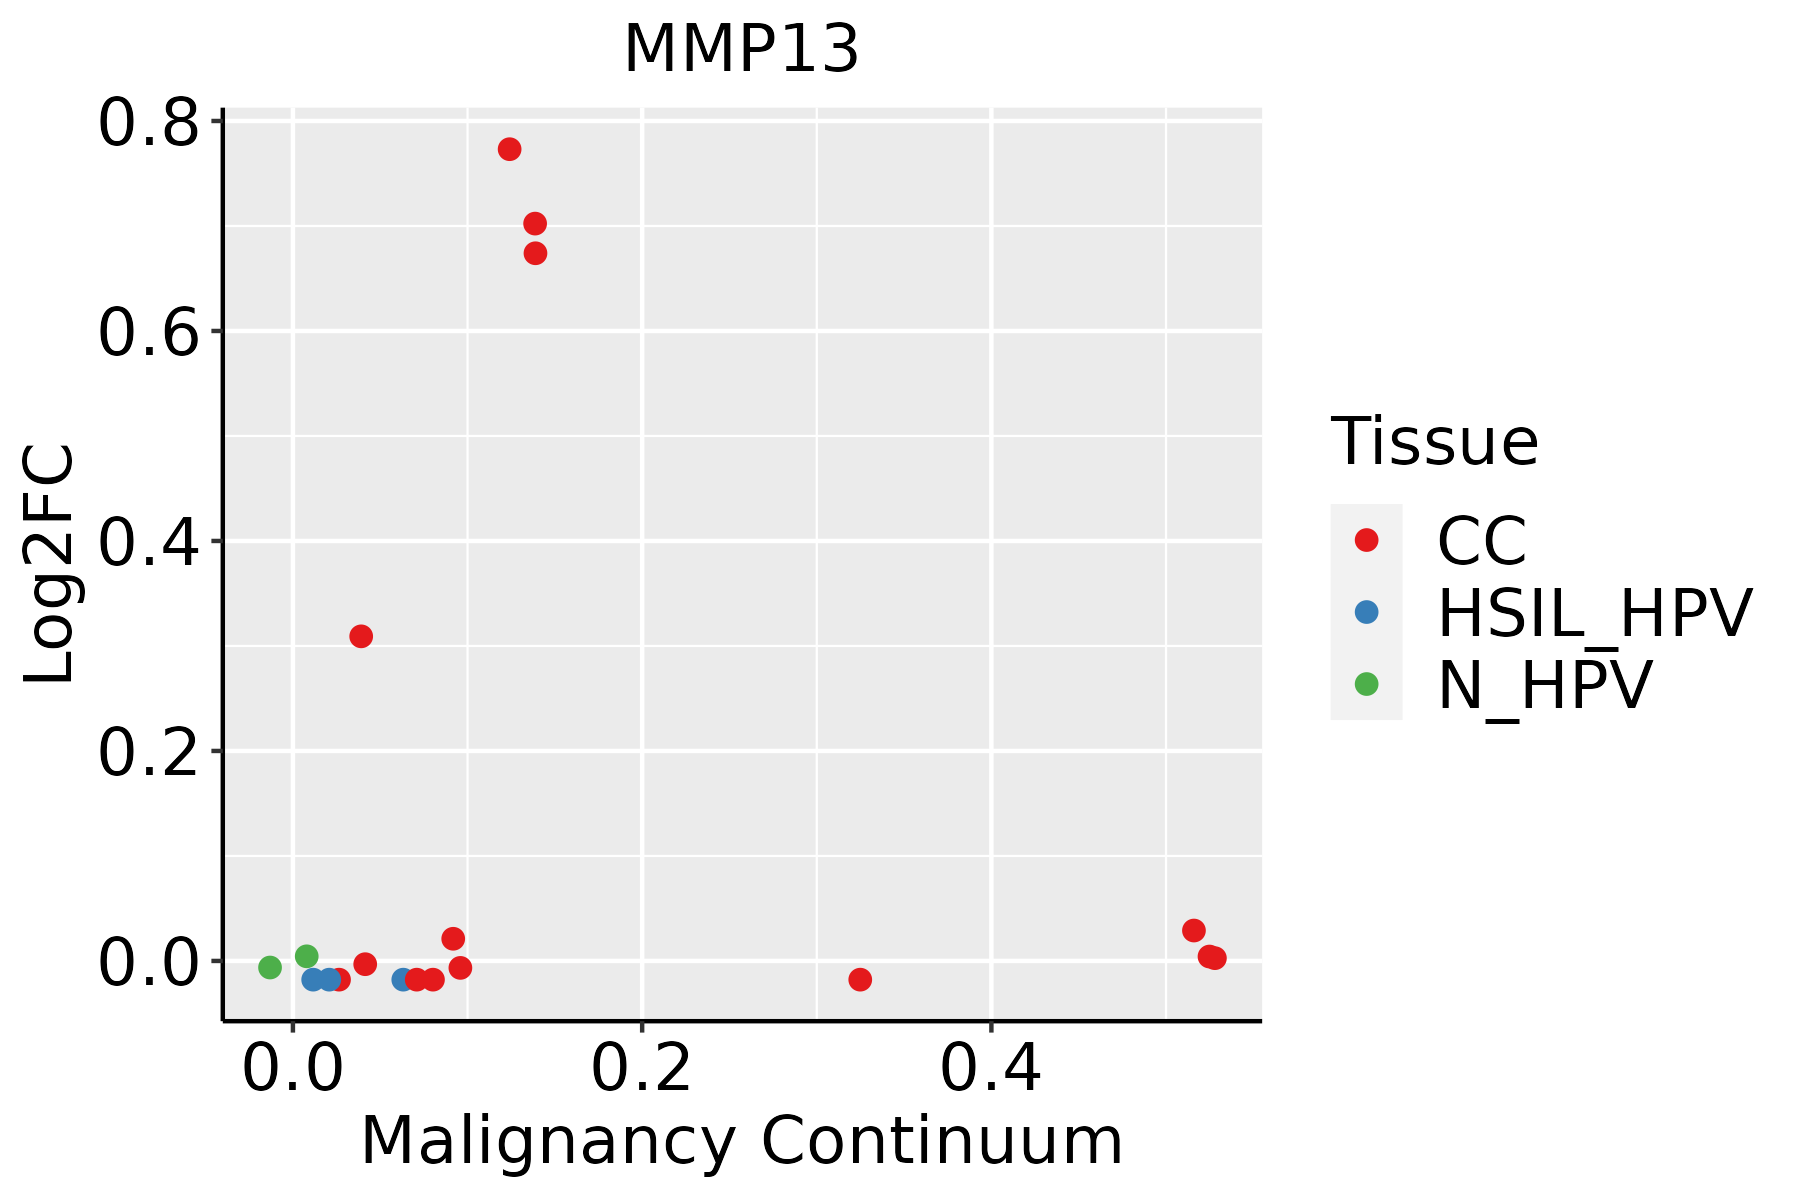 | CC: Cervix cancer |
| HSIL_HPV: HPV-infected high-grade squamous intraepithelial lesions | ||
| N_HPV: HPV-infected normal cervix | ||
| Esophagus | 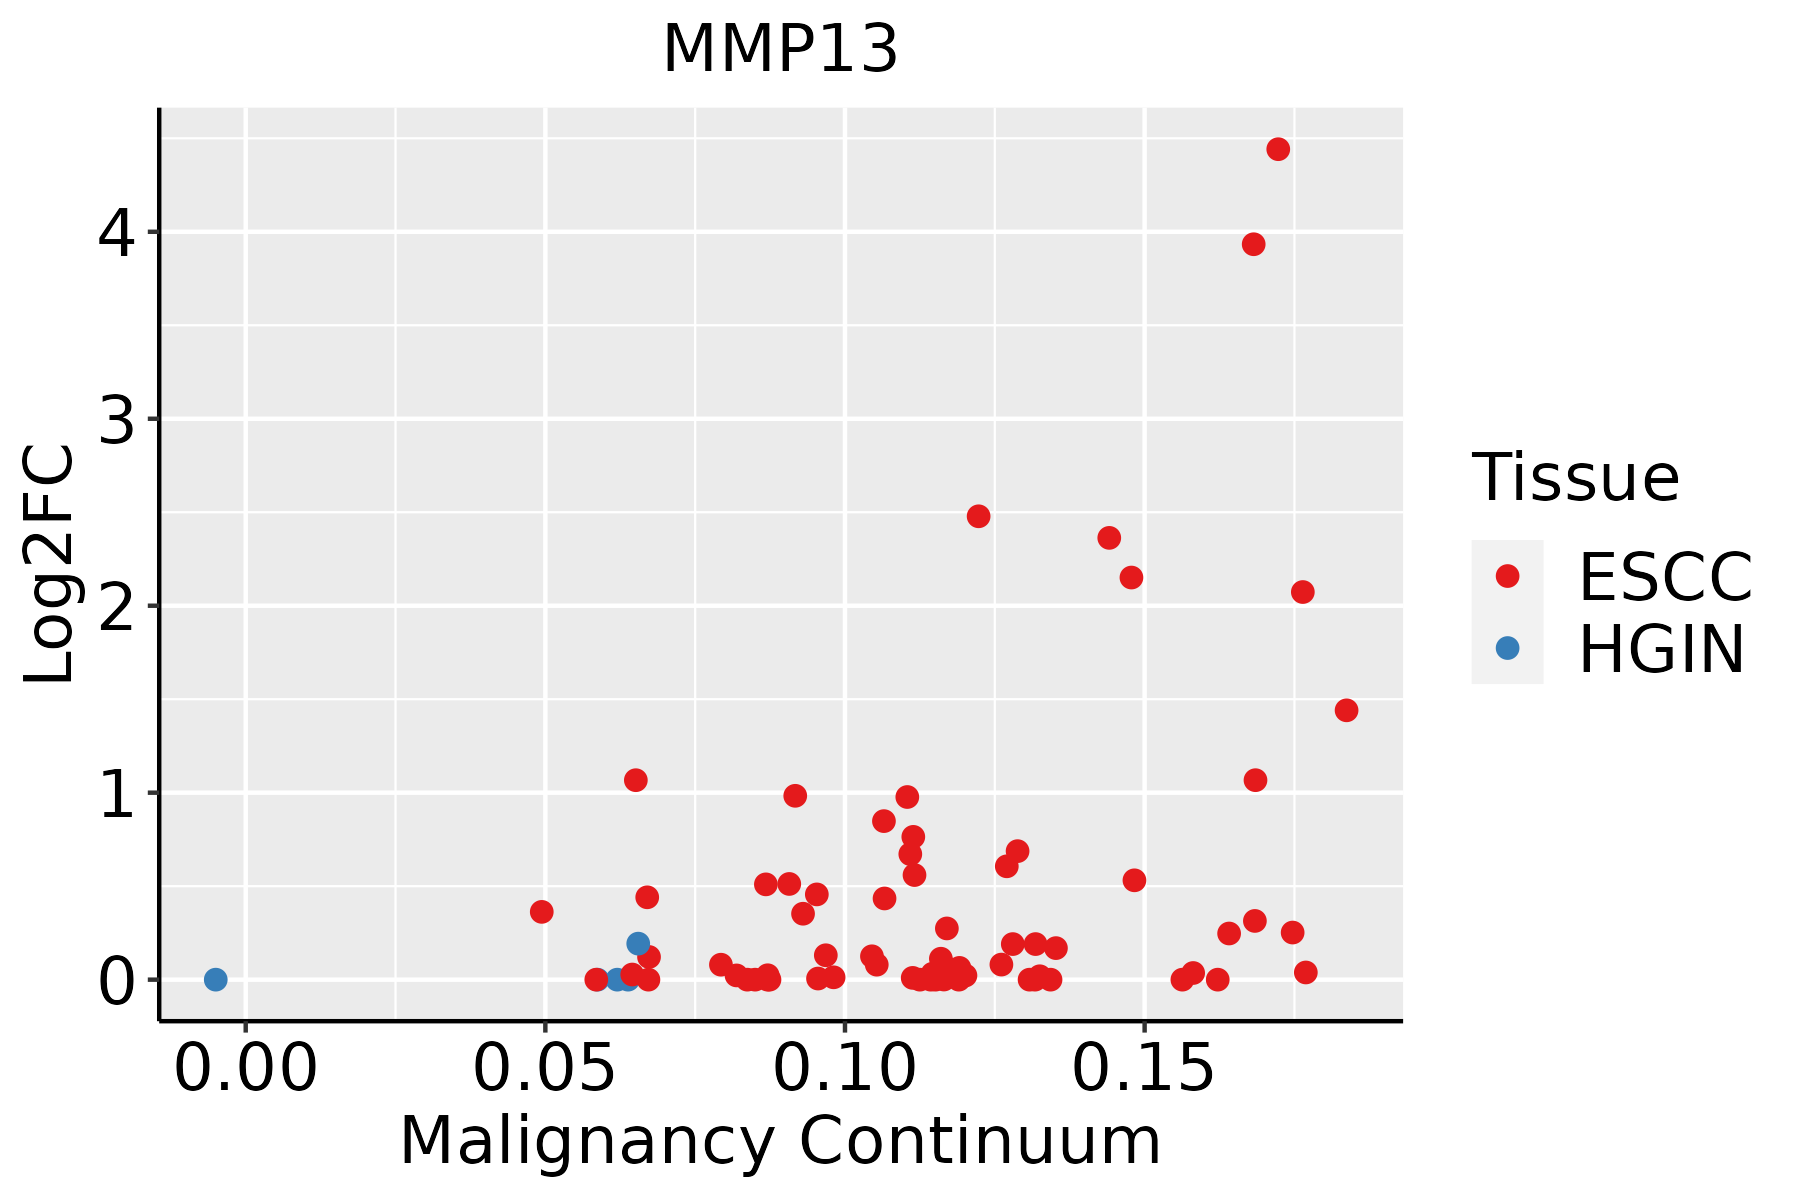 | ESCC: Esophageal squamous cell carcinoma |
| HGIN: High-grade intraepithelial neoplasias | ||
| LGIN: Low-grade intraepithelial neoplasias | ||
| Oral Cavity | 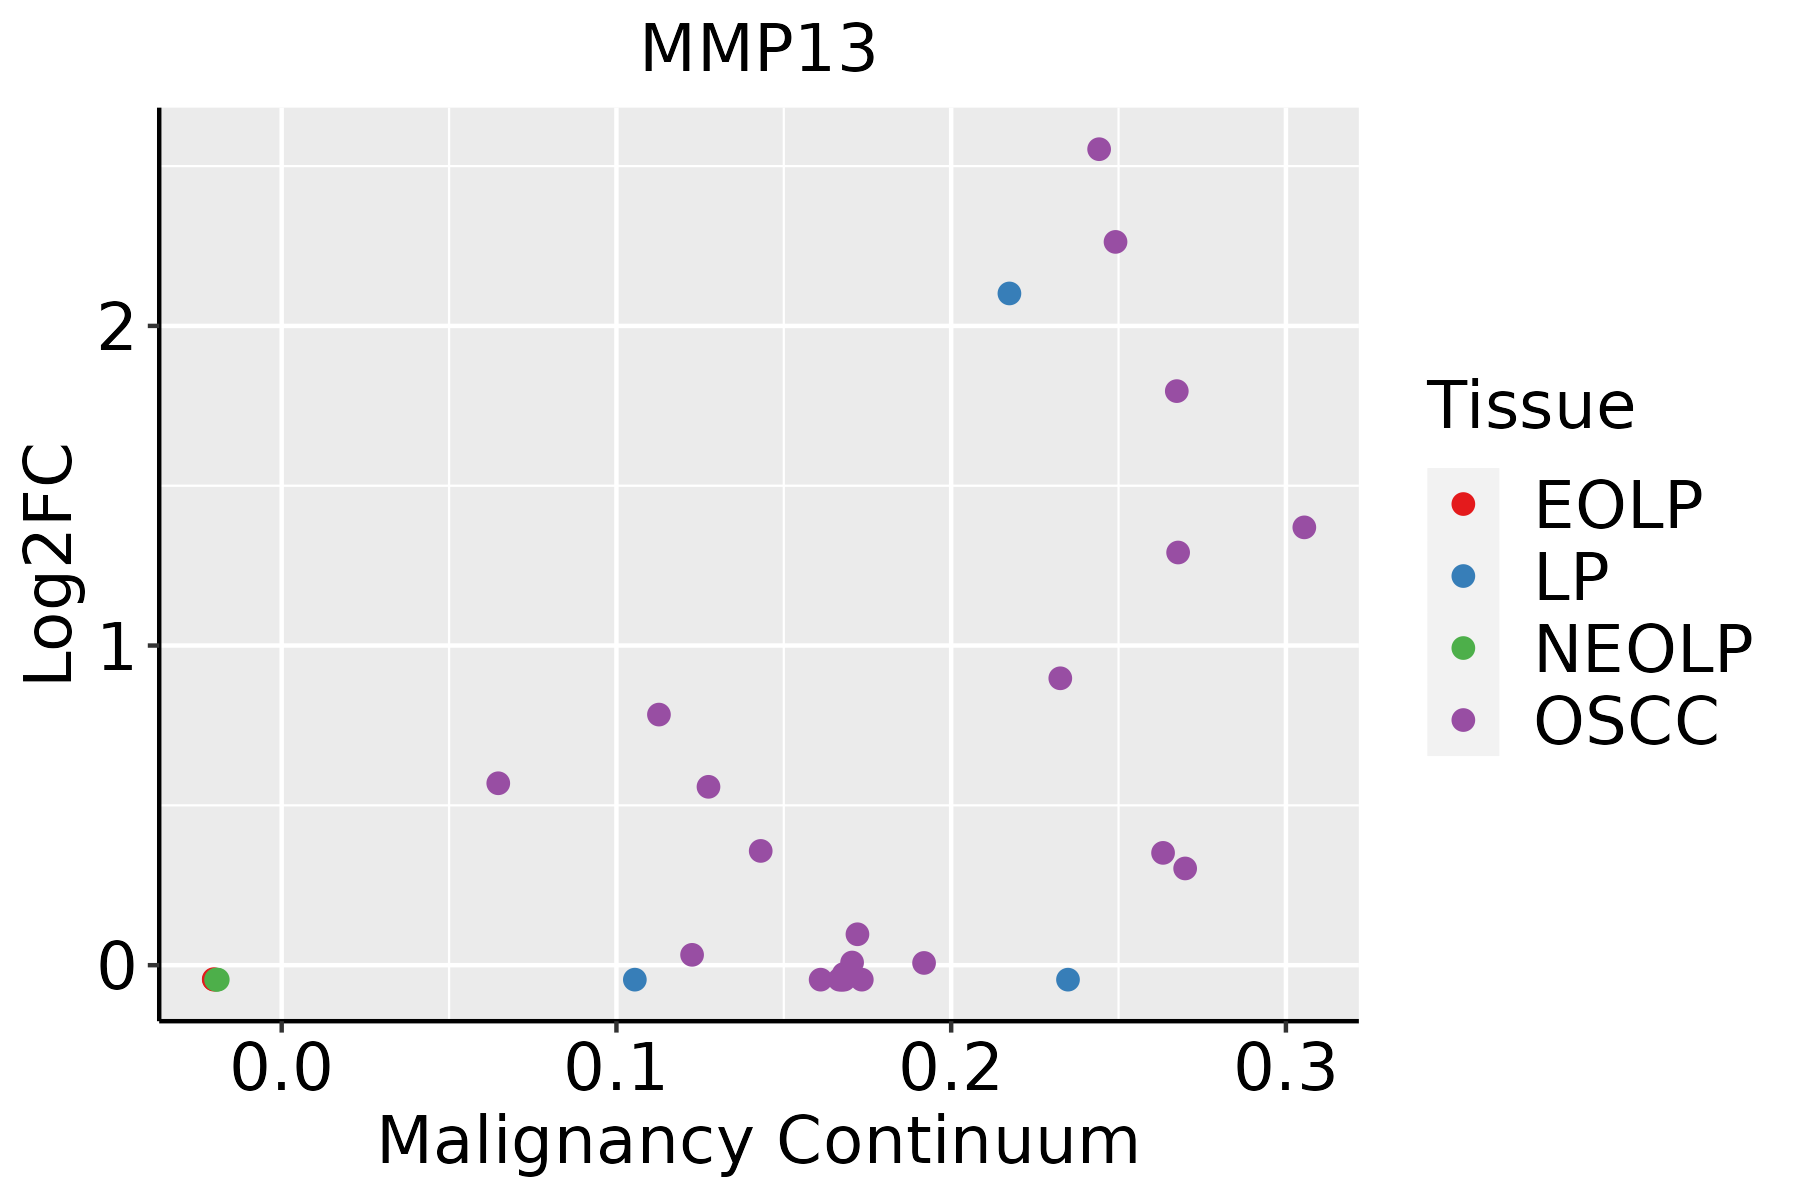 | EOLP: Erosive Oral lichen planus |
| LP: leukoplakia | ||
| NEOLP: Non-erosive oral lichen planus | ||
| OSCC: Oral squamous cell carcinoma |
| ∗log2FC in expression of this searched gene in stem-like cells from each diseased tissue sample relative to stem-like cells in normal samples in each tissue plotted against the malignancy continuum. Samples are colored based on if they are from different disease stage. |
Top |
Malignant transformation related pathway analysis |
| Find out the enriched GO biological processes and KEGG pathways involved in transition from healthy to precancer to cancer |
| Tissue | Disease Stage | Enriched GO biological Processes |
| Colorectum | AD |  |
| Colorectum | SER |  |
| Colorectum | MSS |  |
| Colorectum | MSI-H |  |
| Colorectum | FAP |  |
| ∗Top 15 enriched GO BP terms are showed in the bar plot of each disease state in each tissue. Each row represents a significant GO biological process which is colored according to the -log10(p.adjust). |
| Page: 1 2 3 4 5 6 7 8 9 |
| GO ID | Tissue | Disease Stage | Description | Gene Ratio | Bg Ratio | pvalue | p.adjust | Count |
| GO:002241110 | Cervix | CC | cellular component disassembly | 83/2311 | 443/18723 | 6.04e-05 | 8.68e-04 | 83 |
| GO:00015037 | Cervix | CC | ossification | 71/2311 | 408/18723 | 1.67e-03 | 1.28e-02 | 71 |
| GO:0030198 | Cervix | CC | extracellular matrix organization | 52/2311 | 301/18723 | 7.43e-03 | 3.98e-02 | 52 |
| GO:0043062 | Cervix | CC | extracellular structure organization | 52/2311 | 302/18723 | 7.92e-03 | 4.17e-02 | 52 |
| GO:0022617 | Cervix | CC | extracellular matrix disassembly | 15/2311 | 63/18723 | 8.52e-03 | 4.40e-02 | 15 |
| GO:0031214 | Cervix | CC | biomineral tissue development | 32/2311 | 169/18723 | 8.73e-03 | 4.48e-02 | 32 |
| GO:0045229 | Cervix | CC | external encapsulating structure organization | 52/2311 | 304/18723 | 9.00e-03 | 4.57e-02 | 52 |
| GO:0030282 | Cervix | CC | bone mineralization | 24/2311 | 119/18723 | 1.00e-02 | 4.89e-02 | 24 |
| GO:0110148 | Cervix | CC | biomineralization | 32/2311 | 171/18723 | 1.04e-02 | 4.97e-02 | 32 |
| GO:0022411111 | Esophagus | ESCC | cellular component disassembly | 305/8552 | 443/18723 | 1.94e-23 | 4.57e-21 | 305 |
| GO:000150317 | Esophagus | ESCC | ossification | 232/8552 | 408/18723 | 3.00e-06 | 3.40e-05 | 232 |
| GO:00301984 | Esophagus | ESCC | extracellular matrix organization | 171/8552 | 301/18723 | 6.08e-05 | 4.67e-04 | 171 |
| GO:00430624 | Esophagus | ESCC | extracellular structure organization | 171/8552 | 302/18723 | 7.73e-05 | 5.76e-04 | 171 |
| GO:00452294 | Esophagus | ESCC | external encapsulating structure organization | 172/8552 | 304/18723 | 7.80e-05 | 5.80e-04 | 172 |
| GO:00603485 | Esophagus | ESCC | bone development | 115/8552 | 205/18723 | 1.67e-03 | 7.72e-03 | 115 |
| GO:00329631 | Esophagus | ESCC | collagen metabolic process | 62/8552 | 104/18723 | 2.90e-03 | 1.22e-02 | 62 |
| GO:0003416 | Esophagus | ESCC | endochondral bone growth | 19/8552 | 26/18723 | 4.31e-03 | 1.71e-02 | 19 |
| GO:00487052 | Esophagus | ESCC | skeletal system morphogenesis | 120/8552 | 220/18723 | 4.90e-03 | 1.89e-02 | 120 |
| GO:00226172 | Esophagus | ESCC | extracellular matrix disassembly | 39/8552 | 63/18723 | 6.92e-03 | 2.52e-02 | 39 |
| GO:00512161 | Esophagus | ESCC | cartilage development | 103/8552 | 190/18723 | 1.08e-02 | 3.67e-02 | 103 |
| Page: 1 2 |
| Pathway ID | Tissue | Disease Stage | Description | Gene Ratio | Bg Ratio | pvalue | p.adjust | qvalue | Count |
| hsa0465718 | Cervix | CC | IL-17 signaling pathway | 31/1267 | 94/8465 | 8.71e-06 | 7.43e-05 | 4.39e-05 | 31 |
| hsa0492812 | Cervix | CC | Parathyroid hormone synthesis, secretion and action | 27/1267 | 106/8465 | 3.12e-03 | 1.19e-02 | 7.03e-03 | 27 |
| hsa049265 | Cervix | CC | Relaxin signaling pathway | 30/1267 | 129/8465 | 7.92e-03 | 2.56e-02 | 1.51e-02 | 30 |
| hsa0465719 | Cervix | CC | IL-17 signaling pathway | 31/1267 | 94/8465 | 8.71e-06 | 7.43e-05 | 4.39e-05 | 31 |
| hsa0492813 | Cervix | CC | Parathyroid hormone synthesis, secretion and action | 27/1267 | 106/8465 | 3.12e-03 | 1.19e-02 | 7.03e-03 | 27 |
| hsa0492613 | Cervix | CC | Relaxin signaling pathway | 30/1267 | 129/8465 | 7.92e-03 | 2.56e-02 | 1.51e-02 | 30 |
| hsa0465727 | Esophagus | ESCC | IL-17 signaling pathway | 66/4205 | 94/8465 | 3.93e-05 | 1.75e-04 | 8.99e-05 | 66 |
| hsa049268 | Esophagus | ESCC | Relaxin signaling pathway | 81/4205 | 129/8465 | 1.72e-03 | 5.09e-03 | 2.61e-03 | 81 |
| hsa0492816 | Esophagus | ESCC | Parathyroid hormone synthesis, secretion and action | 66/4205 | 106/8465 | 5.86e-03 | 1.47e-02 | 7.51e-03 | 66 |
| hsa0465734 | Esophagus | ESCC | IL-17 signaling pathway | 66/4205 | 94/8465 | 3.93e-05 | 1.75e-04 | 8.99e-05 | 66 |
| hsa0492616 | Esophagus | ESCC | Relaxin signaling pathway | 81/4205 | 129/8465 | 1.72e-03 | 5.09e-03 | 2.61e-03 | 81 |
| hsa0492817 | Esophagus | ESCC | Parathyroid hormone synthesis, secretion and action | 66/4205 | 106/8465 | 5.86e-03 | 1.47e-02 | 7.51e-03 | 66 |
| hsa0465724 | Oral cavity | OSCC | IL-17 signaling pathway | 64/3704 | 94/8465 | 1.48e-06 | 7.87e-06 | 4.01e-06 | 64 |
| hsa049267 | Oral cavity | OSCC | Relaxin signaling pathway | 74/3704 | 129/8465 | 1.20e-03 | 3.37e-03 | 1.72e-03 | 74 |
| hsa04657112 | Oral cavity | OSCC | IL-17 signaling pathway | 64/3704 | 94/8465 | 1.48e-06 | 7.87e-06 | 4.01e-06 | 64 |
| hsa0492615 | Oral cavity | OSCC | Relaxin signaling pathway | 74/3704 | 129/8465 | 1.20e-03 | 3.37e-03 | 1.72e-03 | 74 |
| Page: 1 |
Top |
Cell-cell communication analysis |
| Identification of potential cell-cell interactions between two cell types and their ligand-receptor pairs for different disease states |
| Ligand | Receptor | LRpair | Pathway | Tissue | Disease Stage |
| Page: 1 |
Top |
Single-cell gene regulatory network inference analysis |
| Find out the significant the regulons (TFs) and the target genes of each regulon across cell types for different disease states |
| TF | Cell Type | Tissue | Disease Stage | Target Gene | RSS | Regulon Activity |
| ∗The dot plots of a searched regulon are shown for all cell subpopulations in each disease state of each tissue based on the regulon specific score inferred using pySCENIC and by calculating the average expression. |
| Page: 1 |
Top |
Somatic mutation of malignant transformation related genes |
| Annotation of somatic variants for genes involved in malignant transformation |
| Hugo Symbol | Variant Class | Variant Classification | dbSNP RS | HGVSc | HGVSp | HGVSp Short | SWISSPROT | BIOTYPE | SIFT | PolyPhen | Tumor Sample Barcode | Tissue | Histology | Sex | Age | Stage | Therapy Types | Drugs | Outcome |
| MMP13 | SNV | Missense_Mutation | c.149C>G | p.Thr50Arg | p.T50R | P45452 | protein_coding | tolerated(0.54) | benign(0.003) | TCGA-A7-A13D-01 | Breast | breast invasive carcinoma | Female | <65 | I/II | Chemotherapy | cytoxan | SD | |
| MMP13 | SNV | Missense_Mutation | c.7N>A | p.Pro3Thr | p.P3T | P45452 | protein_coding | tolerated(0.21) | benign(0) | TCGA-BH-A0HB-01 | Breast | breast invasive carcinoma | Female | <65 | I/II | Chemotherapy | docetaxel | SD | |
| MMP13 | SNV | Missense_Mutation | novel | c.703N>A | p.Asp235Asn | p.D235N | P45452 | protein_coding | tolerated(0.13) | probably_damaging(0.999) | TCGA-EW-A2FR-01 | Breast | breast invasive carcinoma | Female | <65 | III/IV | Chemotherapy | epirubicin | SD |
| MMP13 | SNV | Missense_Mutation | rs767829684 | c.121N>T | p.Arg41Cys | p.R41C | P45452 | protein_coding | deleterious(0) | possibly_damaging(0.697) | TCGA-A6-6654-01 | Colorectum | colon adenocarcinoma | Female | >=65 | III/IV | Chemotherapy | oxaliplatin | SD |
| MMP13 | SNV | Missense_Mutation | rs767829684 | c.121N>T | p.Arg41Cys | p.R41C | P45452 | protein_coding | deleterious(0) | possibly_damaging(0.697) | TCGA-AA-3861-01 | Colorectum | colon adenocarcinoma | Male | >=65 | I/II | Unknown | Unknown | SD |
| MMP13 | SNV | Missense_Mutation | novel | c.1376N>G | p.Ile459Ser | p.I459S | P45452 | protein_coding | deleterious(0) | benign(0.131) | TCGA-AA-3984-01 | Colorectum | colon adenocarcinoma | Female | <65 | I/II | Unknown | Unknown | SD |
| MMP13 | SNV | Missense_Mutation | c.163N>C | p.Ile55Leu | p.I55L | P45452 | protein_coding | tolerated(0.82) | benign(0.009) | TCGA-AA-A010-01 | Colorectum | colon adenocarcinoma | Female | <65 | I/II | Chemotherapy | folinic | CR | |
| MMP13 | SNV | Missense_Mutation | c.166N>A | p.Leu56Met | p.L56M | P45452 | protein_coding | tolerated(0.25) | benign(0.11) | TCGA-AZ-6598-01 | Colorectum | colon adenocarcinoma | Female | >=65 | I/II | Unknown | Unknown | SD | |
| MMP13 | SNV | Missense_Mutation | novel | c.921N>A | p.Phe307Leu | p.F307L | P45452 | protein_coding | deleterious(0.01) | possibly_damaging(0.603) | TCGA-CA-6717-01 | Colorectum | colon adenocarcinoma | Male | <65 | I/II | Chemotherapy | oxaliplatin | CR |
| MMP13 | SNV | Missense_Mutation | c.332N>G | p.Leu111Arg | p.L111R | P45452 | protein_coding | tolerated(0.05) | benign(0.031) | TCGA-CA-6717-01 | Colorectum | colon adenocarcinoma | Male | <65 | I/II | Chemotherapy | oxaliplatin | CR |
| Page: 1 2 3 4 5 6 7 8 |
Top |
Related drugs of malignant transformation related genes |
| Identification of chemicals and drugs interact with genes involved in malignant transfromation |
| (DGIdb 4.0) |
| Entrez ID | Symbol | Category | Interaction Types | Drug Claim Name | Drug Name | PMIDs |
| 4322 | MMP13 | DRUGGABLE GENOME, PROTEASE, ENZYME | inhibitor | 178103096 | APRATASTAT | |
| 4322 | MMP13 | DRUGGABLE GENOME, PROTEASE, ENZYME | vaccine | PRINOMASTAT | PRINOMASTAT | |
| 4322 | MMP13 | DRUGGABLE GENOME, PROTEASE, ENZYME | Curcumin | CURCUMIN | ||
| 4322 | MMP13 | DRUGGABLE GENOME, PROTEASE, ENZYME | inhibitor | 178101837 | BATIMASTAT | |
| 4322 | MMP13 | DRUGGABLE GENOME, PROTEASE, ENZYME | inhibitor | 178101860 | ||
| 4322 | MMP13 | DRUGGABLE GENOME, PROTEASE, ENZYME | PMID29130358-Compound-Figure18(14a) | |||
| 4322 | MMP13 | DRUGGABLE GENOME, PROTEASE, ENZYME | PMID29130358-Compound-Figure16(9a) | |||
| 4322 | MMP13 | DRUGGABLE GENOME, PROTEASE, ENZYME | PMID29130358-Compound-Figure16(9b) | |||
| 4322 | MMP13 | DRUGGABLE GENOME, PROTEASE, ENZYME | inhibitor | CHEMBL1200567 | DOXYCYCLINE HYCLATE | |
| 4322 | MMP13 | DRUGGABLE GENOME, PROTEASE, ENZYME | PMID29130358-Compound-Figure18(14) |
| Page: 1 2 3 |

Copyright 2023-Present -The University of Texas Health Science Center at Houston |