
|
|||||
|
 | |
| |
| |
| |
| |
| |
|
Gene: MMP10 |
Gene summary for MMP10 |
| Gene information | Species | Human | Gene symbol | MMP10 | Gene ID | 4319 |
| Gene name | matrix metallopeptidase 10 | |
| Gene Alias | SL-2 | |
| Cytomap | 11q22.2 | |
| Gene Type | protein-coding | GO ID | GO:0006508 | UniProtAcc | P09238 |
Top |
Malignant transformation analysis |
| Identification of the aberrant gene expression in precancerous and cancerous lesions by comparing the gene expression of stem-like cells in diseased tissues with normal stem cells |
| Entrez ID | Symbol | Replicates | Species | Organ | Tissue | Adj P-value | Log2FC | Malignancy |
| 4319 | MMP10 | Tumor | Human | Cervix | CC | 2.09e-07 | 3.86e-01 | 0.1241 |
| 4319 | MMP10 | sample3 | Human | Cervix | CC | 3.17e-17 | 5.62e-01 | 0.1387 |
| 4319 | MMP10 | T3 | Human | Cervix | CC | 1.12e-12 | 5.20e-01 | 0.1389 |
| 4319 | MMP10 | LZE8T | Human | Esophagus | ESCC | 8.46e-25 | 3.27e+00 | 0.067 |
| 4319 | MMP10 | P2T-E | Human | Esophagus | ESCC | 6.83e-07 | -1.01e-01 | 0.1177 |
| 4319 | MMP10 | P8T-E | Human | Esophagus | ESCC | 3.87e-32 | 2.95e+00 | 0.0889 |
| 4319 | MMP10 | P11T-E | Human | Esophagus | ESCC | 8.73e-06 | 2.92e+00 | 0.1426 |
| 4319 | MMP10 | P26T-E | Human | Esophagus | ESCC | 5.62e-35 | 3.23e+00 | 0.1276 |
| 4319 | MMP10 | P31T-E | Human | Esophagus | ESCC | 2.05e-05 | 1.34e+00 | 0.1251 |
| 4319 | MMP10 | P37T-E | Human | Esophagus | ESCC | 9.84e-23 | 1.62e+00 | 0.1371 |
| 4319 | MMP10 | P54T-E | Human | Esophagus | ESCC | 3.18e-08 | 1.89e+00 | 0.0975 |
| 4319 | MMP10 | P61T-E | Human | Esophagus | ESCC | 3.81e-14 | 1.49e+00 | 0.099 |
| 4319 | MMP10 | P62T-E | Human | Esophagus | ESCC | 5.45e-04 | 1.86e+00 | 0.1302 |
| 4319 | MMP10 | P65T-E | Human | Esophagus | ESCC | 2.53e-07 | 9.40e-01 | 0.0978 |
| 4319 | MMP10 | P74T-E | Human | Esophagus | ESCC | 4.87e-24 | 3.58e+00 | 0.1479 |
| 4319 | MMP10 | P83T-E | Human | Esophagus | ESCC | 6.63e-04 | 1.11e+00 | 0.1738 |
| 4319 | MMP10 | P89T-E | Human | Esophagus | ESCC | 4.07e-11 | 4.89e+00 | 0.1752 |
| 4319 | MMP10 | P107T-E | Human | Esophagus | ESCC | 5.33e-49 | 4.41e+00 | 0.171 |
| 4319 | MMP10 | P126T-E | Human | Esophagus | ESCC | 2.43e-05 | 2.74e+00 | 0.1125 |
| 4319 | MMP10 | P130T-E | Human | Esophagus | ESCC | 1.72e-15 | 1.40e+00 | 0.1676 |
| Page: 1 2 |
| Tissue | Expression Dynamics | Abbreviation |
| Cervix | 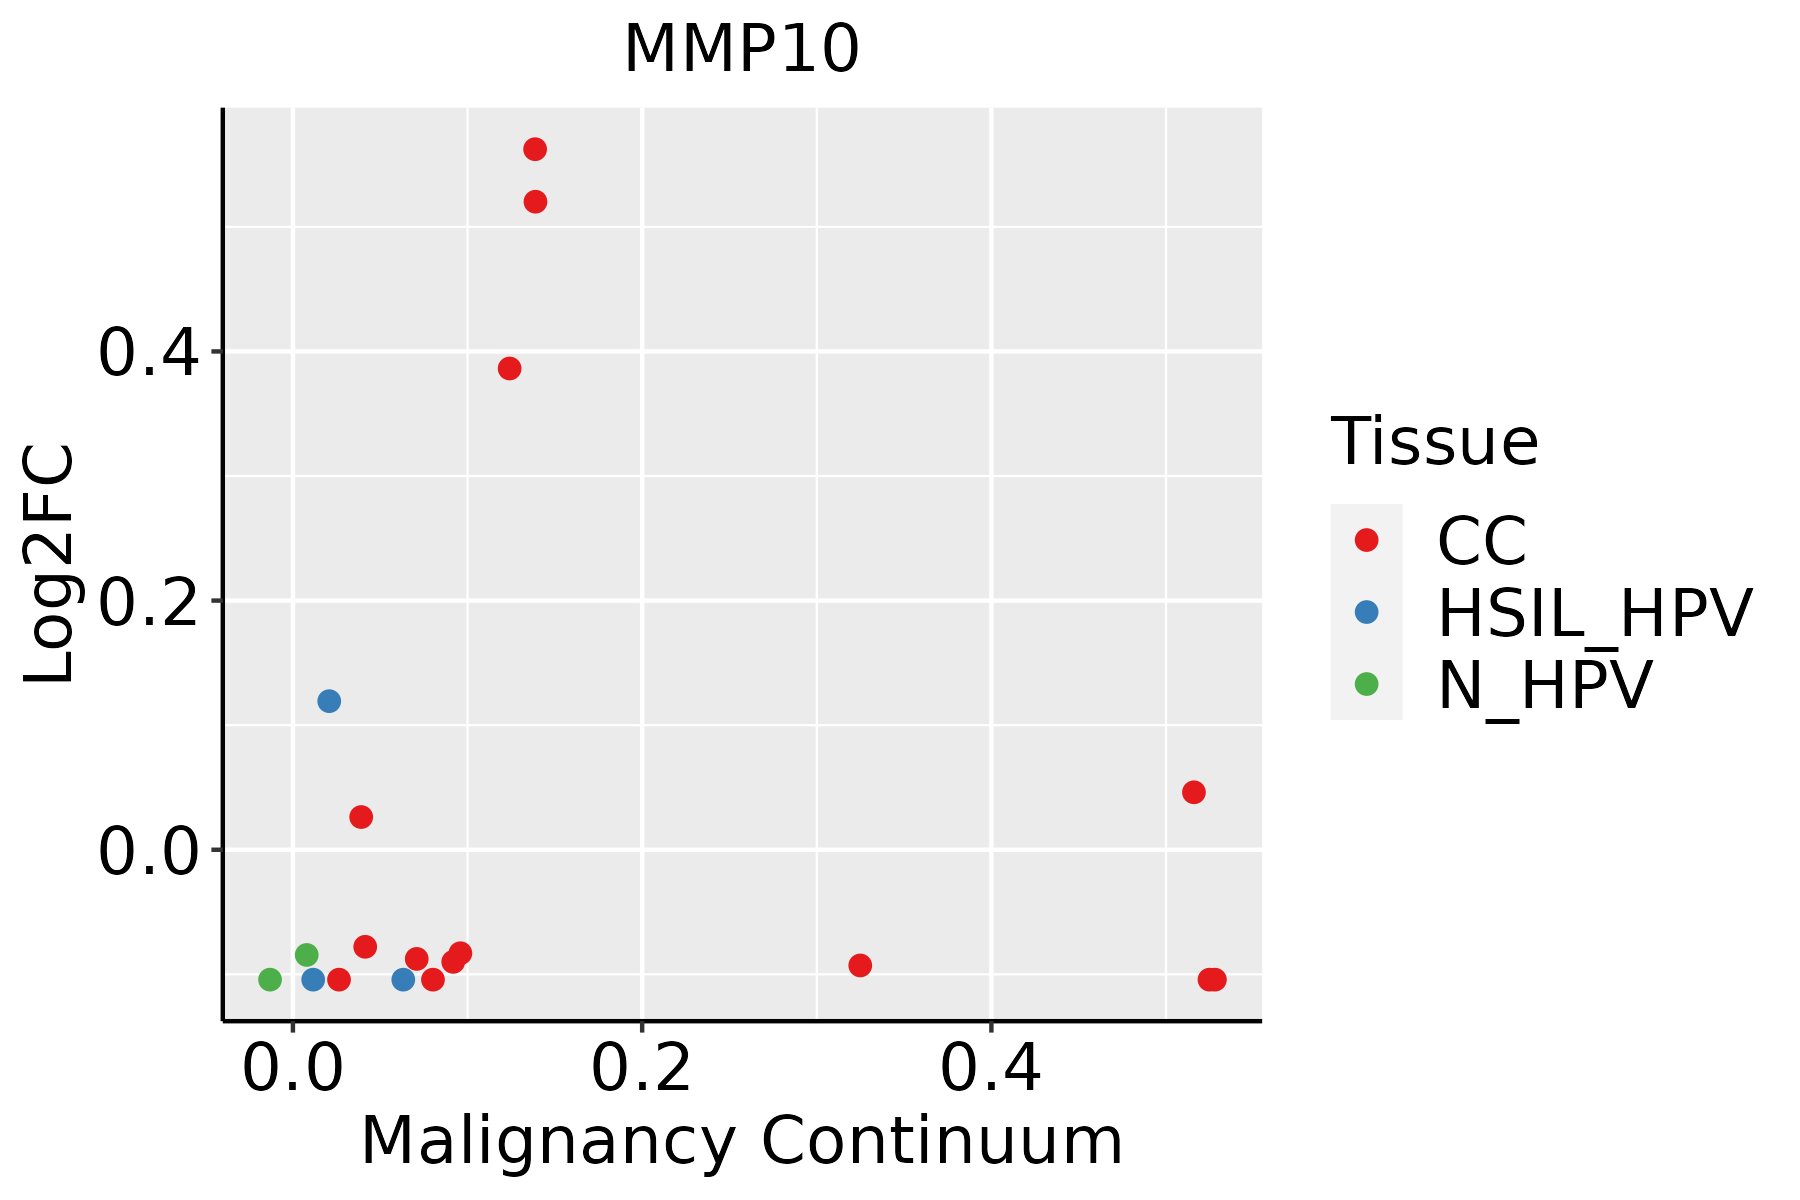 | CC: Cervix cancer |
| HSIL_HPV: HPV-infected high-grade squamous intraepithelial lesions | ||
| N_HPV: HPV-infected normal cervix | ||
| Esophagus |  | ESCC: Esophageal squamous cell carcinoma |
| HGIN: High-grade intraepithelial neoplasias | ||
| LGIN: Low-grade intraepithelial neoplasias | ||
| Oral Cavity | 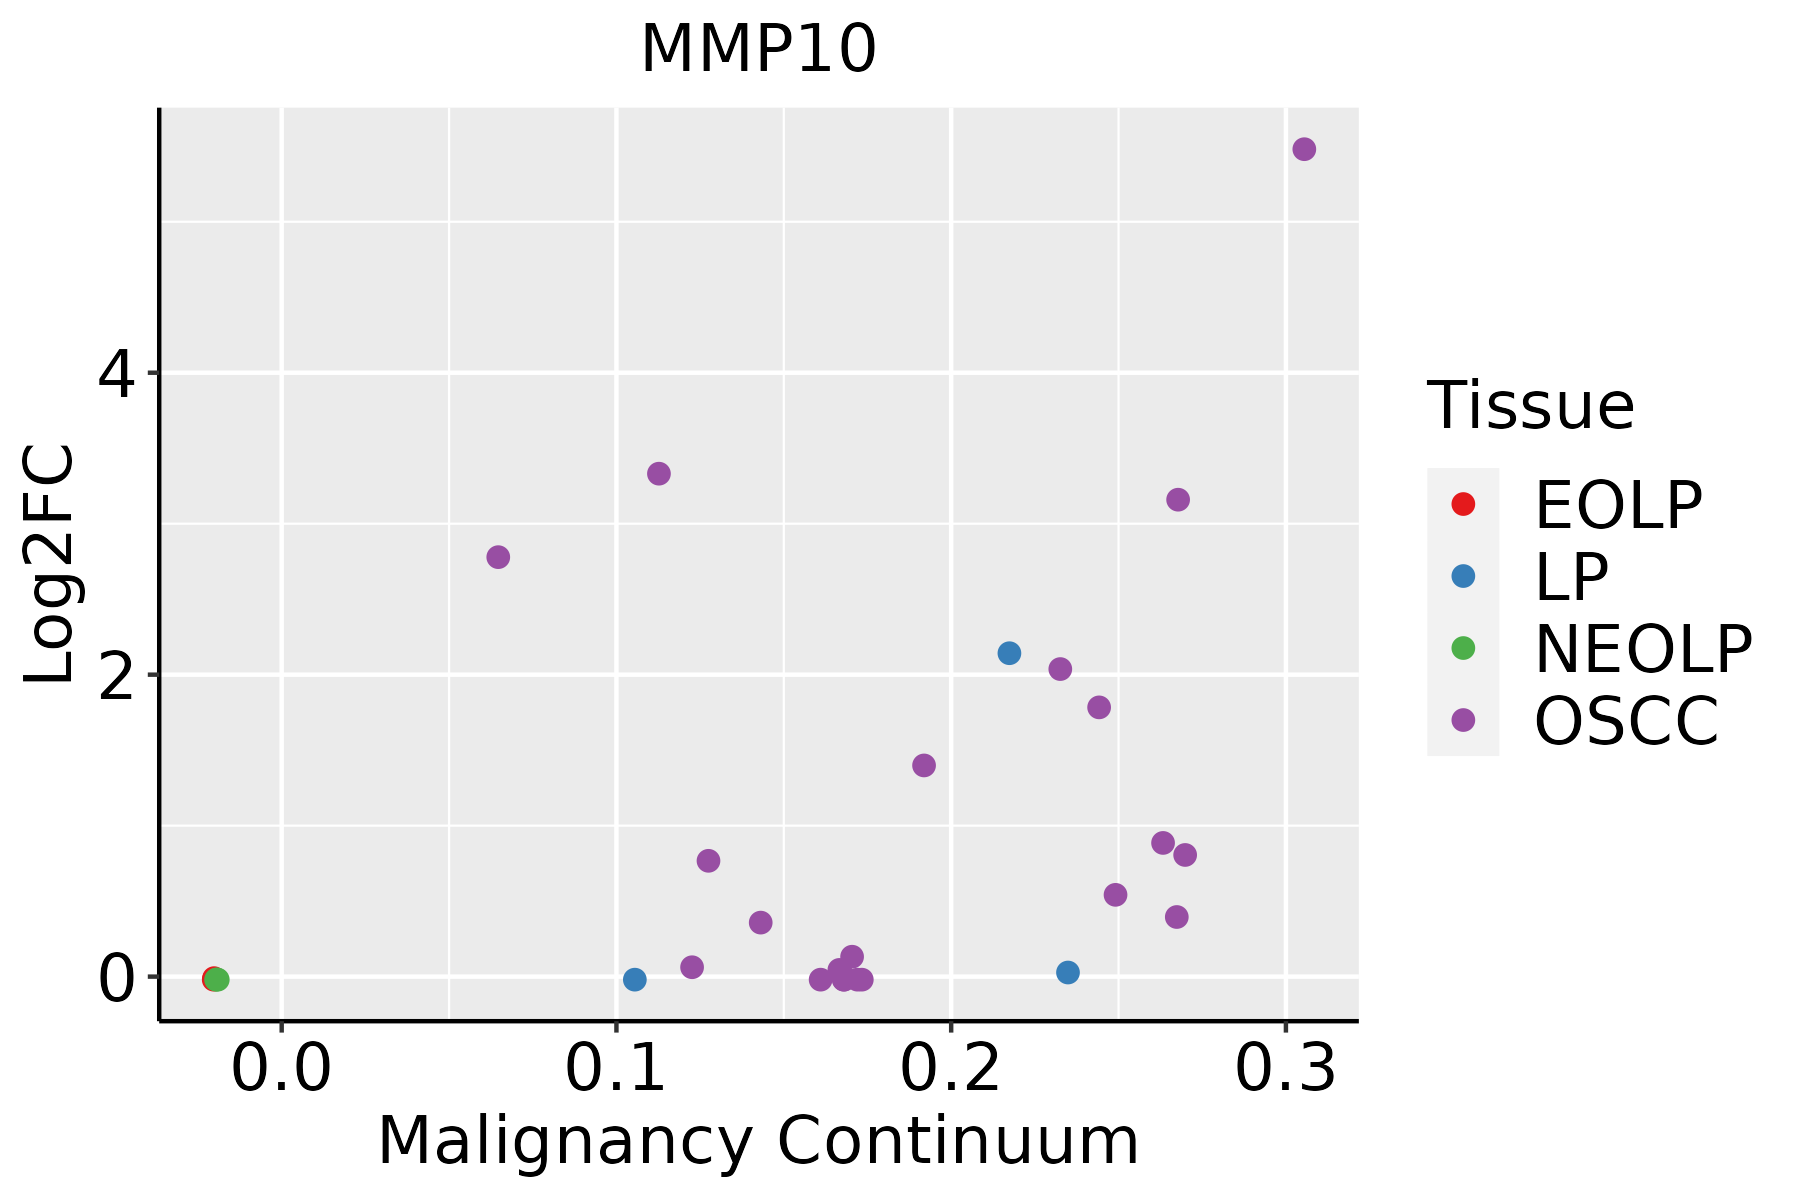 | EOLP: Erosive Oral lichen planus |
| LP: leukoplakia | ||
| NEOLP: Non-erosive oral lichen planus | ||
| OSCC: Oral squamous cell carcinoma | ||
| Prostate | 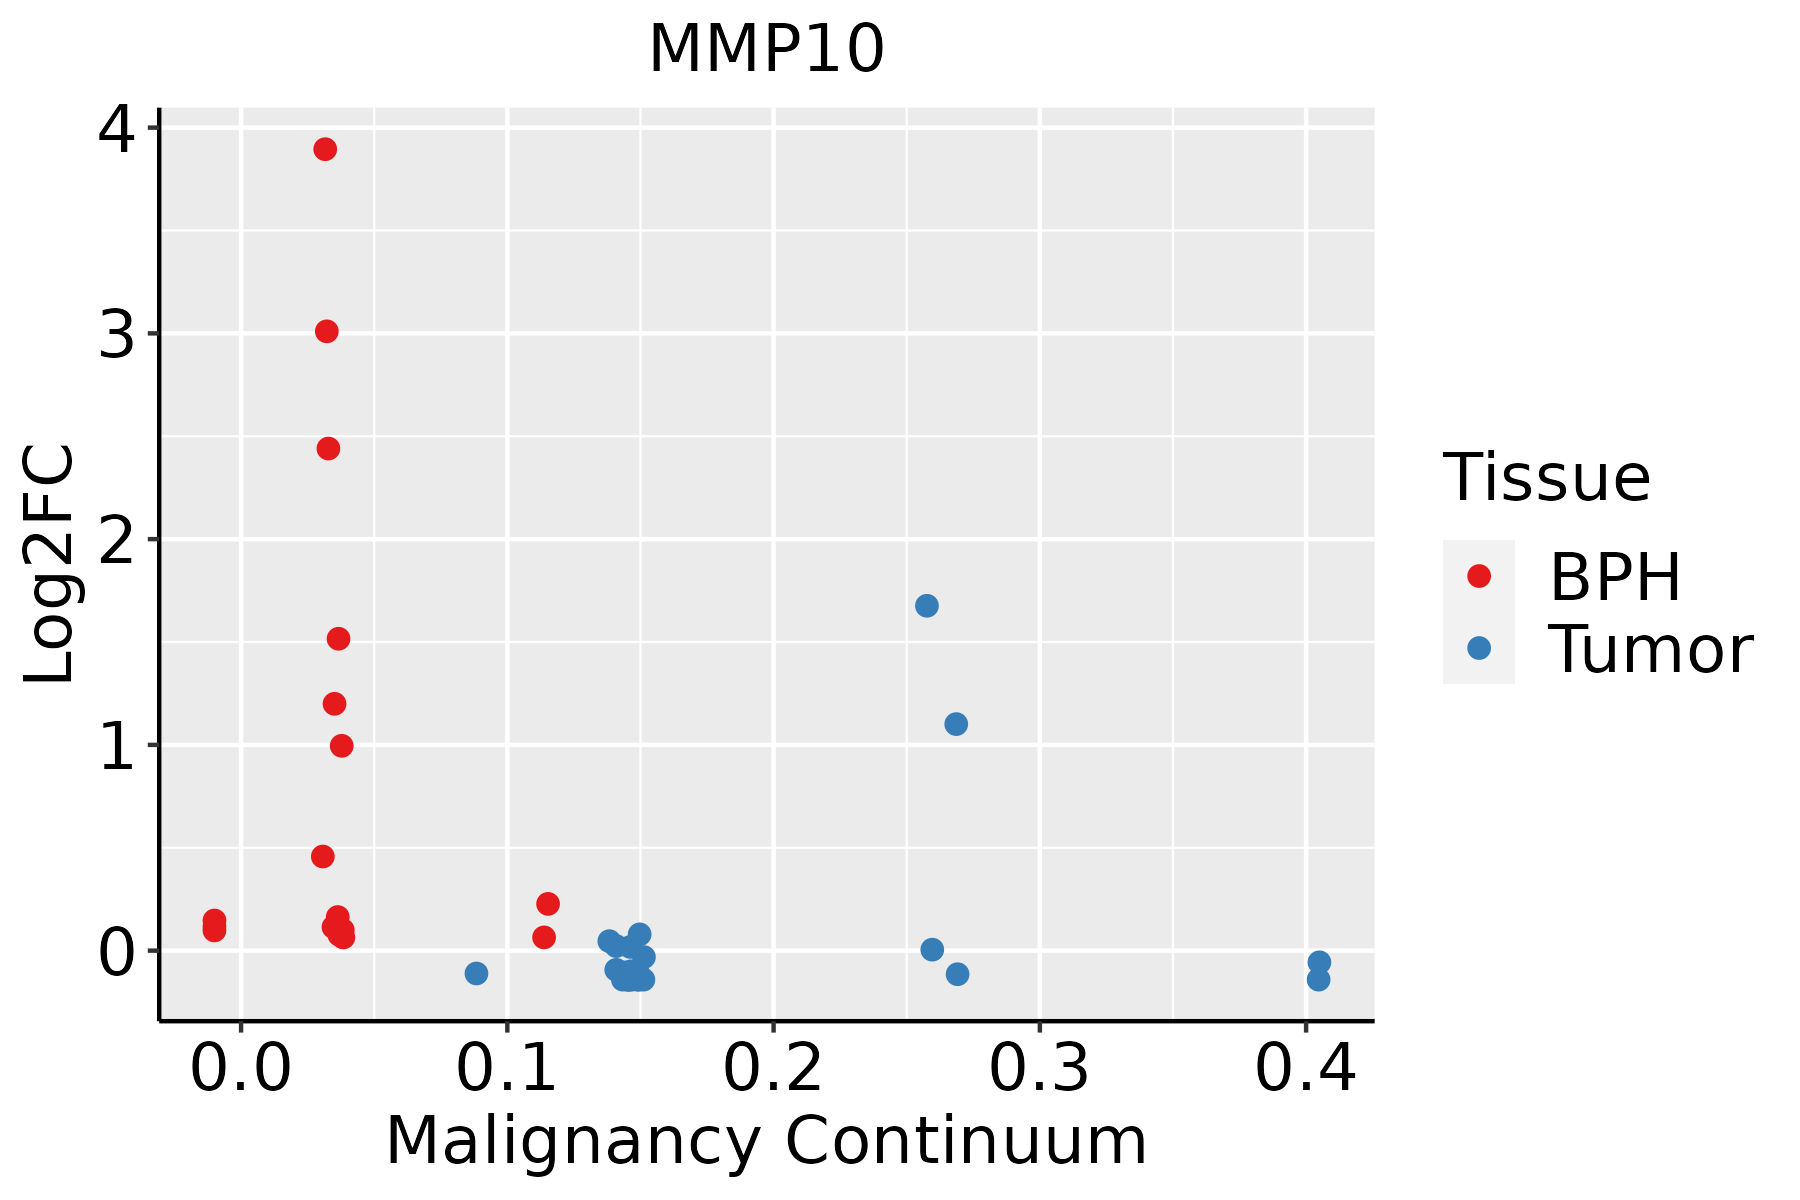 | BPH: Benign Prostatic Hyperplasia |
| Skin | 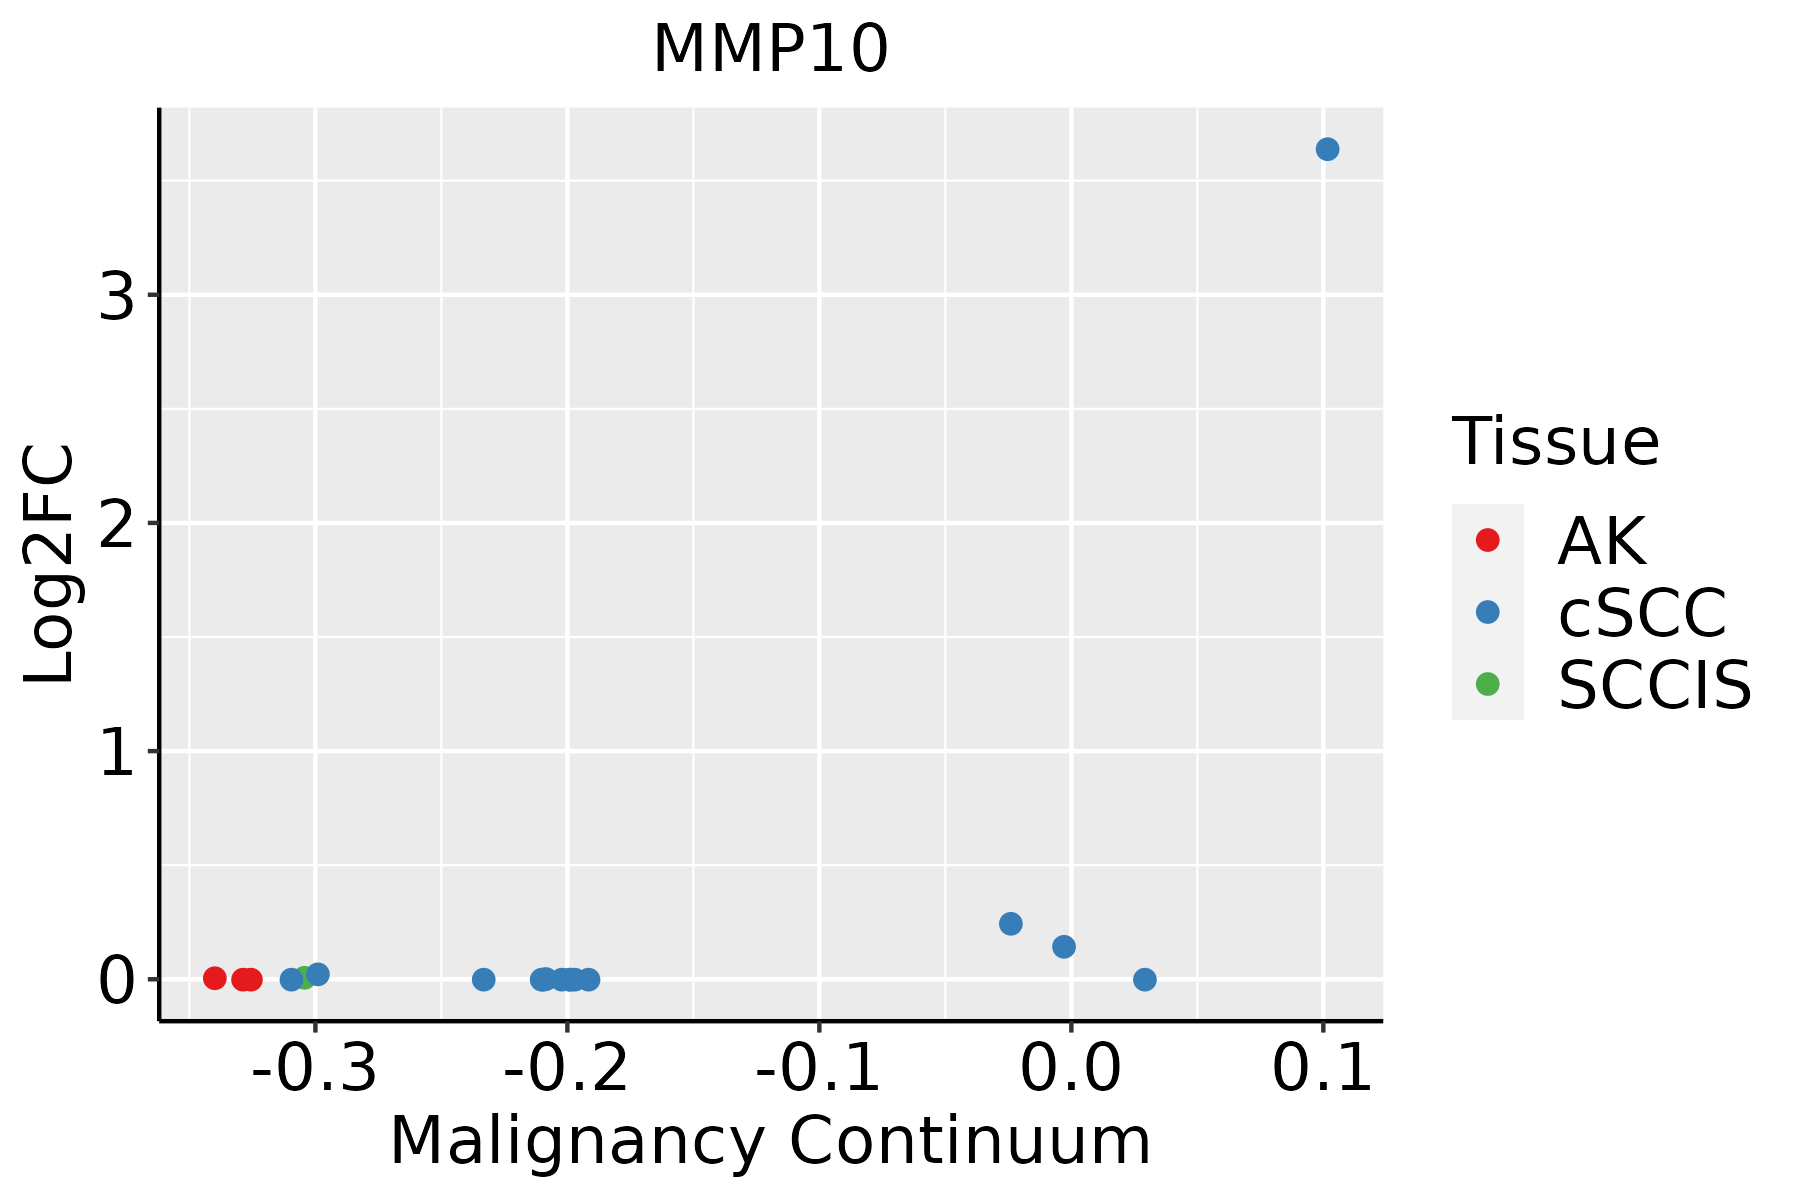 | AK: Actinic keratosis |
| cSCC: Cutaneous squamous cell carcinoma | ||
| SCCIS:squamous cell carcinoma in situ | ||
| Thyroid | 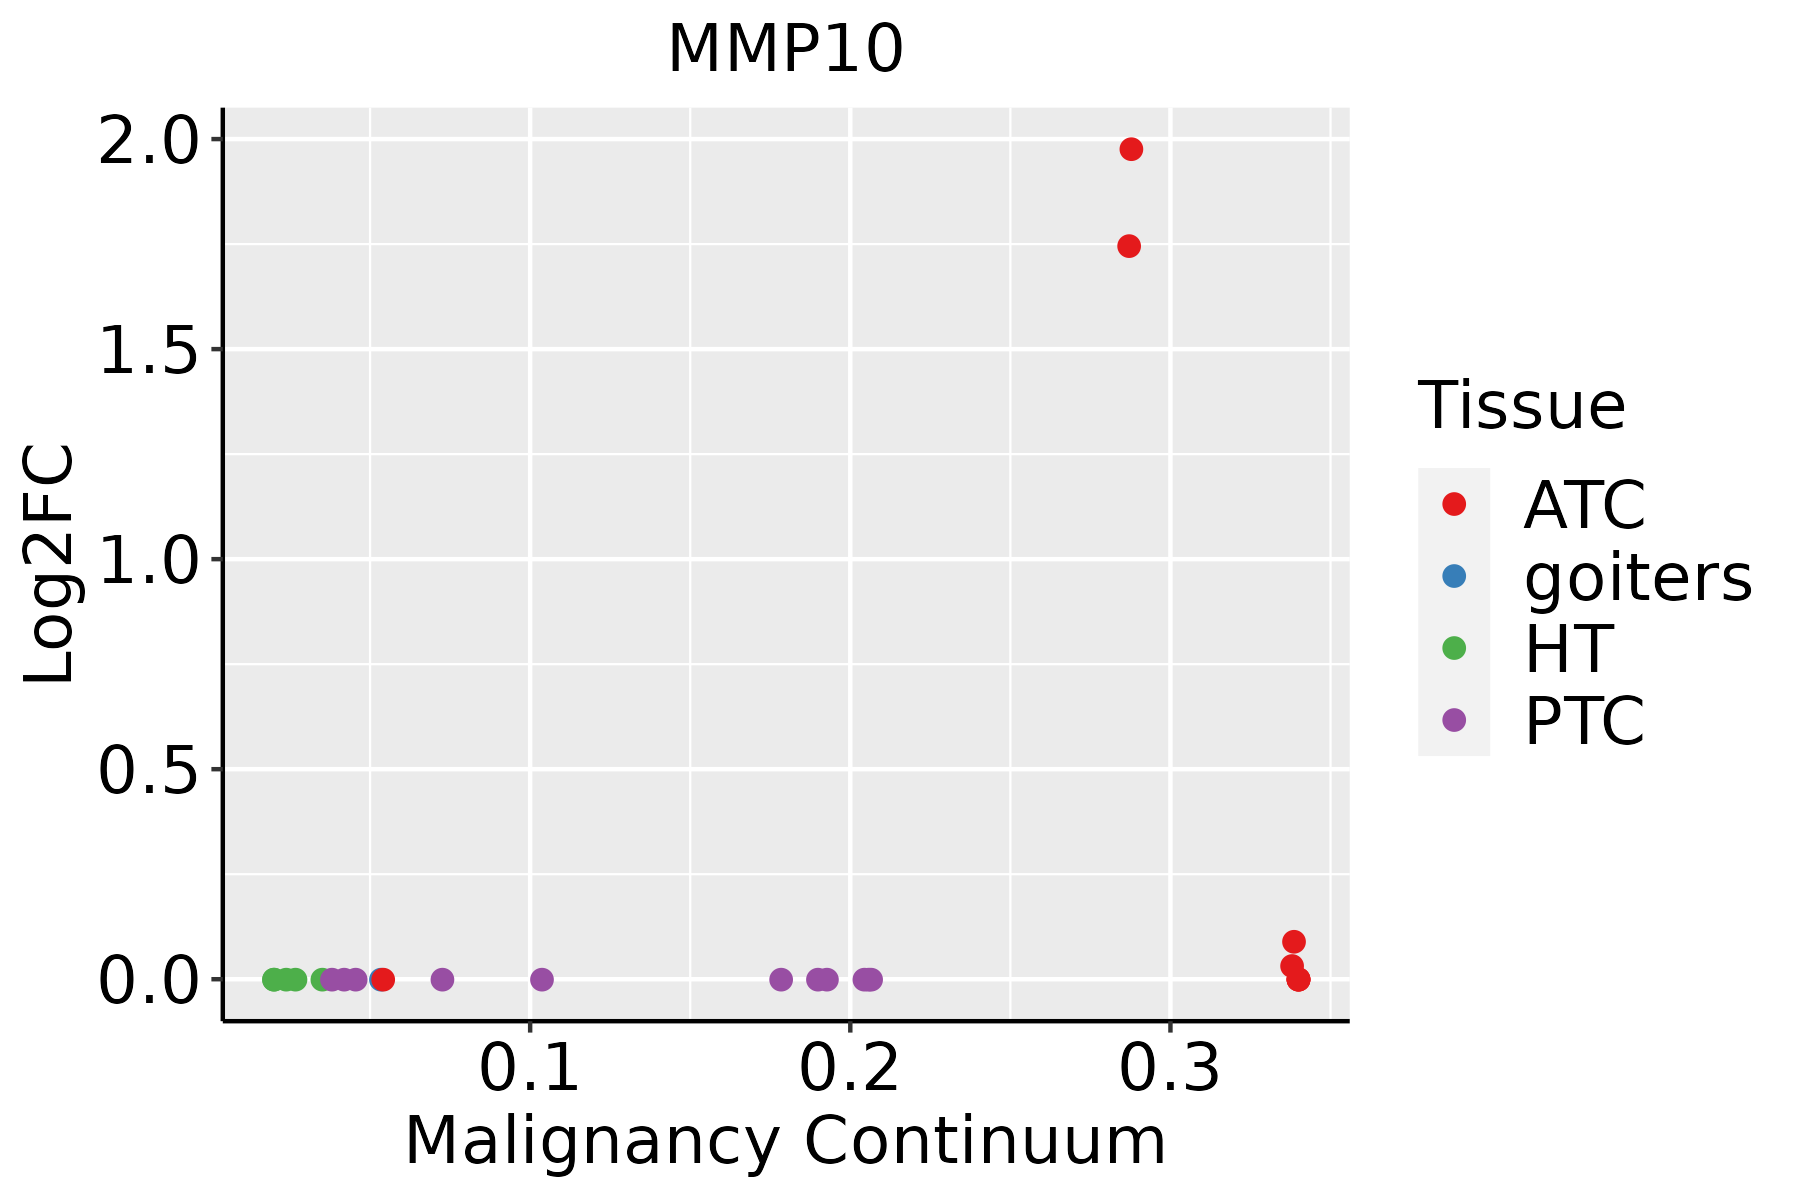 | ATC: Anaplastic thyroid cancer |
| HT: Hashimoto's thyroiditis | ||
| PTC: Papillary thyroid cancer |
| ∗log2FC in expression of this searched gene in stem-like cells from each diseased tissue sample relative to stem-like cells in normal samples in each tissue plotted against the malignancy continuum. Samples are colored based on if they are from different disease stage. |
Top |
Malignant transformation related pathway analysis |
| Find out the enriched GO biological processes and KEGG pathways involved in transition from healthy to precancer to cancer |
| Tissue | Disease Stage | Enriched GO biological Processes |
| Colorectum | AD |  |
| Colorectum | SER |  |
| Colorectum | MSS |  |
| Colorectum | MSI-H |  |
| Colorectum | FAP |  |
| ∗Top 15 enriched GO BP terms are showed in the bar plot of each disease state in each tissue. Each row represents a significant GO biological process which is colored according to the -log10(p.adjust). |
| Page: 1 2 3 4 5 6 7 8 9 |
| GO ID | Tissue | Disease Stage | Description | Gene Ratio | Bg Ratio | pvalue | p.adjust | Count |
| GO:002241110 | Cervix | CC | cellular component disassembly | 83/2311 | 443/18723 | 6.04e-05 | 8.68e-04 | 83 |
| GO:0030198 | Cervix | CC | extracellular matrix organization | 52/2311 | 301/18723 | 7.43e-03 | 3.98e-02 | 52 |
| GO:0043062 | Cervix | CC | extracellular structure organization | 52/2311 | 302/18723 | 7.92e-03 | 4.17e-02 | 52 |
| GO:0022617 | Cervix | CC | extracellular matrix disassembly | 15/2311 | 63/18723 | 8.52e-03 | 4.40e-02 | 15 |
| GO:0045229 | Cervix | CC | external encapsulating structure organization | 52/2311 | 304/18723 | 9.00e-03 | 4.57e-02 | 52 |
| GO:0022411111 | Esophagus | ESCC | cellular component disassembly | 305/8552 | 443/18723 | 1.94e-23 | 4.57e-21 | 305 |
| GO:00301984 | Esophagus | ESCC | extracellular matrix organization | 171/8552 | 301/18723 | 6.08e-05 | 4.67e-04 | 171 |
| GO:00430624 | Esophagus | ESCC | extracellular structure organization | 171/8552 | 302/18723 | 7.73e-05 | 5.76e-04 | 171 |
| GO:00452294 | Esophagus | ESCC | external encapsulating structure organization | 172/8552 | 304/18723 | 7.80e-05 | 5.80e-04 | 172 |
| GO:00329631 | Esophagus | ESCC | collagen metabolic process | 62/8552 | 104/18723 | 2.90e-03 | 1.22e-02 | 62 |
| GO:00226172 | Esophagus | ESCC | extracellular matrix disassembly | 39/8552 | 63/18723 | 6.92e-03 | 2.52e-02 | 39 |
| GO:002241119 | Oral cavity | OSCC | cellular component disassembly | 283/7305 | 443/18723 | 9.57e-27 | 3.37e-24 | 283 |
| GO:00301983 | Oral cavity | OSCC | extracellular matrix organization | 146/7305 | 301/18723 | 4.67e-04 | 2.77e-03 | 146 |
| GO:00452293 | Oral cavity | OSCC | external encapsulating structure organization | 147/7305 | 304/18723 | 5.30e-04 | 3.08e-03 | 147 |
| GO:00430623 | Oral cavity | OSCC | extracellular structure organization | 146/7305 | 302/18723 | 5.59e-04 | 3.23e-03 | 146 |
| GO:00226171 | Oral cavity | OSCC | extracellular matrix disassembly | 37/7305 | 63/18723 | 1.18e-03 | 5.99e-03 | 37 |
| GO:0032963 | Oral cavity | OSCC | collagen metabolic process | 54/7305 | 104/18723 | 5.00e-03 | 1.96e-02 | 54 |
| GO:002241117 | Prostate | BPH | cellular component disassembly | 121/3107 | 443/18723 | 6.34e-09 | 2.25e-07 | 121 |
| GO:00430621 | Prostate | BPH | extracellular structure organization | 67/3107 | 302/18723 | 6.67e-03 | 3.00e-02 | 67 |
| GO:00301981 | Prostate | BPH | extracellular matrix organization | 66/3107 | 301/18723 | 9.20e-03 | 3.92e-02 | 66 |
| Page: 1 2 |
| Pathway ID | Tissue | Disease Stage | Description | Gene Ratio | Bg Ratio | pvalue | p.adjust | qvalue | Count |
| Page: 1 |
Top |
Cell-cell communication analysis |
| Identification of potential cell-cell interactions between two cell types and their ligand-receptor pairs for different disease states |
| Ligand | Receptor | LRpair | Pathway | Tissue | Disease Stage |
| Page: 1 |
Top |
Single-cell gene regulatory network inference analysis |
| Find out the significant the regulons (TFs) and the target genes of each regulon across cell types for different disease states |
| TF | Cell Type | Tissue | Disease Stage | Target Gene | RSS | Regulon Activity |
| ∗The dot plots of a searched regulon are shown for all cell subpopulations in each disease state of each tissue based on the regulon specific score inferred using pySCENIC and by calculating the average expression. |
| Page: 1 |
Top |
Somatic mutation of malignant transformation related genes |
| Annotation of somatic variants for genes involved in malignant transformation |
| Hugo Symbol | Variant Class | Variant Classification | dbSNP RS | HGVSc | HGVSp | HGVSp Short | SWISSPROT | BIOTYPE | SIFT | PolyPhen | Tumor Sample Barcode | Tissue | Histology | Sex | Age | Stage | Therapy Types | Drugs | Outcome |
| MMP10 | SNV | Missense_Mutation | novel | c.742N>C | p.Phe248Leu | p.F248L | P09238 | protein_coding | tolerated(0.15) | benign(0.03) | TCGA-A1-A0SO-01 | Breast | breast invasive carcinoma | Female | >=65 | I/II | Chemotherapy | SD | |
| MMP10 | SNV | Missense_Mutation | c.283G>C | p.Asp95His | p.D95H | P09238 | protein_coding | deleterious(0) | probably_damaging(1) | TCGA-A8-A09G-01 | Breast | breast invasive carcinoma | Female | >=65 | III/IV | Unknown | Unknown | SD | |
| MMP10 | SNV | Missense_Mutation | c.574N>A | p.Gly192Arg | p.G192R | P09238 | protein_coding | deleterious(0) | probably_damaging(0.997) | TCGA-BH-A0HF-01 | Breast | breast invasive carcinoma | Female | >=65 | I/II | Hormone Therapy | arimidex | SD | |
| MMP10 | insertion | Nonsense_Mutation | novel | c.148_149insCCAGCATTTTGGGAGGCCAAGTTGGGT | p.Gln50delinsProSerIleLeuGlyGlyGlnValGlyTer | p.Q50delinsPSILGGQVG* | P09238 | protein_coding | TCGA-A8-A08H-01 | Breast | breast invasive carcinoma | Female | >=65 | I/II | Unknown | Unknown | SD | ||
| MMP10 | SNV | Missense_Mutation | c.1001N>G | p.Ser334Cys | p.S334C | P09238 | protein_coding | deleterious(0) | probably_damaging(0.936) | TCGA-C5-A1BQ-01 | Cervix | cervical & endocervical cancer | Female | >=65 | III/IV | Chemotherapy | cisplatin | CR | |
| MMP10 | SNV | Missense_Mutation | novel | c.595N>A | p.Asp199Asn | p.D199N | P09238 | protein_coding | deleterious(0) | possibly_damaging(0.897) | TCGA-VS-A953-01 | Cervix | cervical & endocervical cancer | Female | <65 | I/II | Unknown | Unknown | PD |
| MMP10 | SNV | Missense_Mutation | novel | c.466G>C | p.Ala156Pro | p.A156P | P09238 | protein_coding | deleterious(0.02) | probably_damaging(1) | TCGA-AA-3947-01 | Colorectum | colon adenocarcinoma | Female | <65 | I/II | Unknown | Unknown | SD |
| MMP10 | SNV | Missense_Mutation | c.259N>T | p.Arg87Cys | p.R87C | P09238 | protein_coding | deleterious(0.01) | possibly_damaging(0.712) | TCGA-AA-A010-01 | Colorectum | colon adenocarcinoma | Female | <65 | I/II | Chemotherapy | folinic | CR | |
| MMP10 | SNV | Missense_Mutation | novel | c.749N>G | p.Leu250Arg | p.L250R | P09238 | protein_coding | deleterious(0) | probably_damaging(1) | TCGA-CA-6717-01 | Colorectum | colon adenocarcinoma | Male | <65 | I/II | Chemotherapy | oxaliplatin | CR |
| MMP10 | SNV | Missense_Mutation | c.259N>T | p.Arg87Cys | p.R87C | P09238 | protein_coding | deleterious(0.01) | possibly_damaging(0.712) | TCGA-CM-6674-01 | Colorectum | colon adenocarcinoma | Male | <65 | I/II | Unknown | Unknown | SD |
| Page: 1 2 3 4 5 6 7 |
Top |
Related drugs of malignant transformation related genes |
| Identification of chemicals and drugs interact with genes involved in malignant transfromation |
| (DGIdb 4.0) |
| Entrez ID | Symbol | Category | Interaction Types | Drug Claim Name | Drug Name | PMIDs |
| 4319 | MMP10 | DRUGGABLE GENOME, ENZYME, PROTEASE | inhibitor | 249565939 |
| Page: 1 |

Copyright 2023-Present -The University of Texas Health Science Center at Houston |