
|
|||||
|
 | |
| |
| |
| |
| |
| |
|
Gene: MMGT1 |
Gene summary for MMGT1 |
| Gene information | Species | Human | Gene symbol | MMGT1 | Gene ID | 93380 |
| Gene name | membrane magnesium transporter 1 | |
| Gene Alias | EMC5 | |
| Cytomap | Xq26.3 | |
| Gene Type | protein-coding | GO ID | GO:0006810 | UniProtAcc | Q8N4V1 |
Top |
Malignant transformation analysis |
| Identification of the aberrant gene expression in precancerous and cancerous lesions by comparing the gene expression of stem-like cells in diseased tissues with normal stem cells |
| Entrez ID | Symbol | Replicates | Species | Organ | Tissue | Adj P-value | Log2FC | Malignancy |
| 93380 | MMGT1 | LZE2T | Human | Esophagus | ESCC | 7.66e-03 | 5.60e-01 | 0.082 |
| 93380 | MMGT1 | LZE4T | Human | Esophagus | ESCC | 3.69e-11 | 3.57e-01 | 0.0811 |
| 93380 | MMGT1 | LZE7T | Human | Esophagus | ESCC | 7.96e-08 | 5.00e-01 | 0.0667 |
| 93380 | MMGT1 | LZE20T | Human | Esophagus | ESCC | 4.18e-05 | 1.69e-01 | 0.0662 |
| 93380 | MMGT1 | LZE22T | Human | Esophagus | ESCC | 3.52e-03 | 2.71e-01 | 0.068 |
| 93380 | MMGT1 | LZE24T | Human | Esophagus | ESCC | 3.29e-28 | 7.05e-01 | 0.0596 |
| 93380 | MMGT1 | LZE6T | Human | Esophagus | ESCC | 1.55e-10 | 4.87e-01 | 0.0845 |
| 93380 | MMGT1 | P1T-E | Human | Esophagus | ESCC | 1.99e-05 | 3.07e-01 | 0.0875 |
| 93380 | MMGT1 | P2T-E | Human | Esophagus | ESCC | 3.53e-25 | 4.01e-01 | 0.1177 |
| 93380 | MMGT1 | P4T-E | Human | Esophagus | ESCC | 4.94e-23 | 4.78e-01 | 0.1323 |
| 93380 | MMGT1 | P5T-E | Human | Esophagus | ESCC | 8.10e-11 | 1.87e-01 | 0.1327 |
| 93380 | MMGT1 | P8T-E | Human | Esophagus | ESCC | 2.85e-13 | 2.06e-01 | 0.0889 |
| 93380 | MMGT1 | P9T-E | Human | Esophagus | ESCC | 5.48e-09 | 2.64e-01 | 0.1131 |
| 93380 | MMGT1 | P10T-E | Human | Esophagus | ESCC | 1.14e-26 | 4.70e-01 | 0.116 |
| 93380 | MMGT1 | P11T-E | Human | Esophagus | ESCC | 3.92e-12 | 4.11e-01 | 0.1426 |
| 93380 | MMGT1 | P12T-E | Human | Esophagus | ESCC | 2.29e-36 | 6.46e-01 | 0.1122 |
| 93380 | MMGT1 | P15T-E | Human | Esophagus | ESCC | 3.89e-14 | 2.94e-01 | 0.1149 |
| 93380 | MMGT1 | P16T-E | Human | Esophagus | ESCC | 7.89e-17 | 2.37e-01 | 0.1153 |
| 93380 | MMGT1 | P17T-E | Human | Esophagus | ESCC | 1.88e-04 | 2.52e-01 | 0.1278 |
| 93380 | MMGT1 | P19T-E | Human | Esophagus | ESCC | 1.64e-10 | 6.99e-01 | 0.1662 |
| Page: 1 2 3 4 5 |
| Tissue | Expression Dynamics | Abbreviation |
| Esophagus | 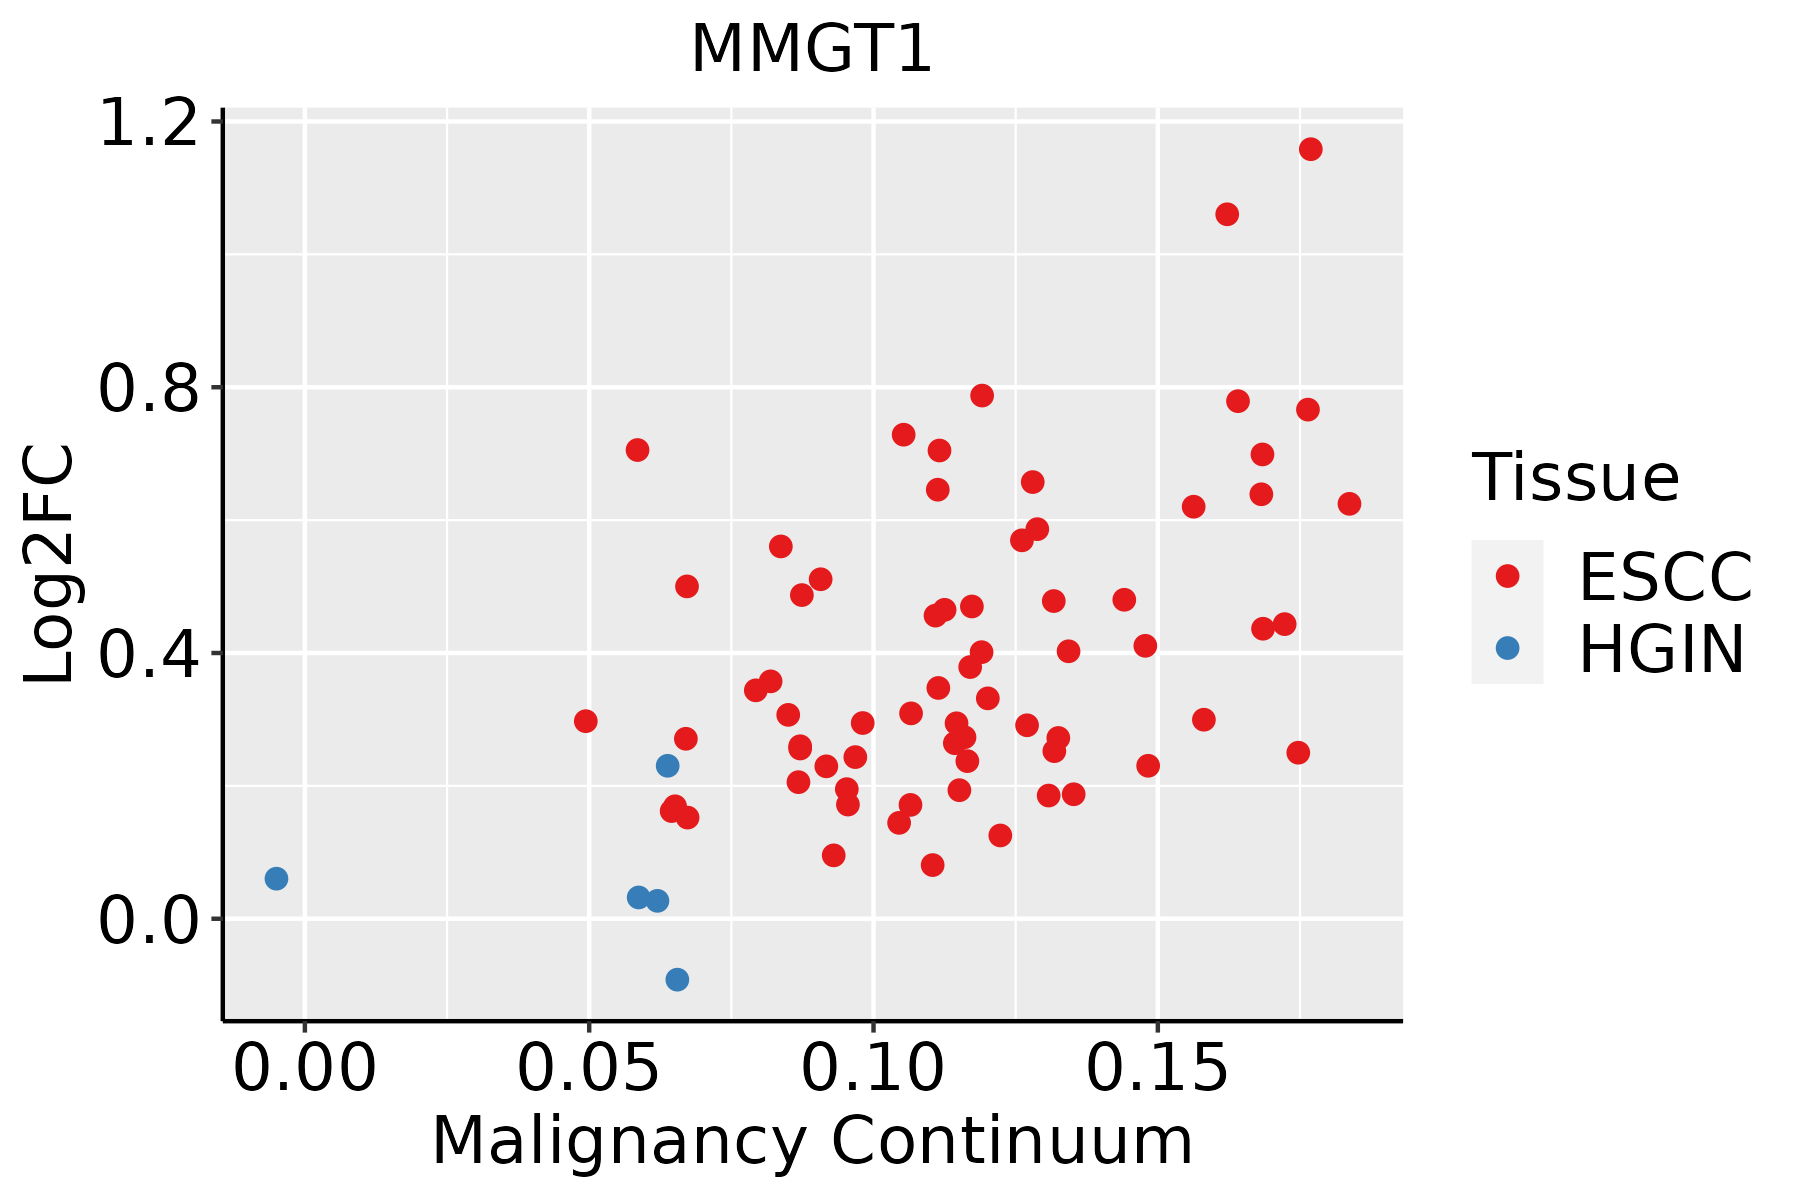 | ESCC: Esophageal squamous cell carcinoma |
| HGIN: High-grade intraepithelial neoplasias | ||
| LGIN: Low-grade intraepithelial neoplasias | ||
| Liver |  | HCC: Hepatocellular carcinoma |
| NAFLD: Non-alcoholic fatty liver disease | ||
| Oral Cavity | 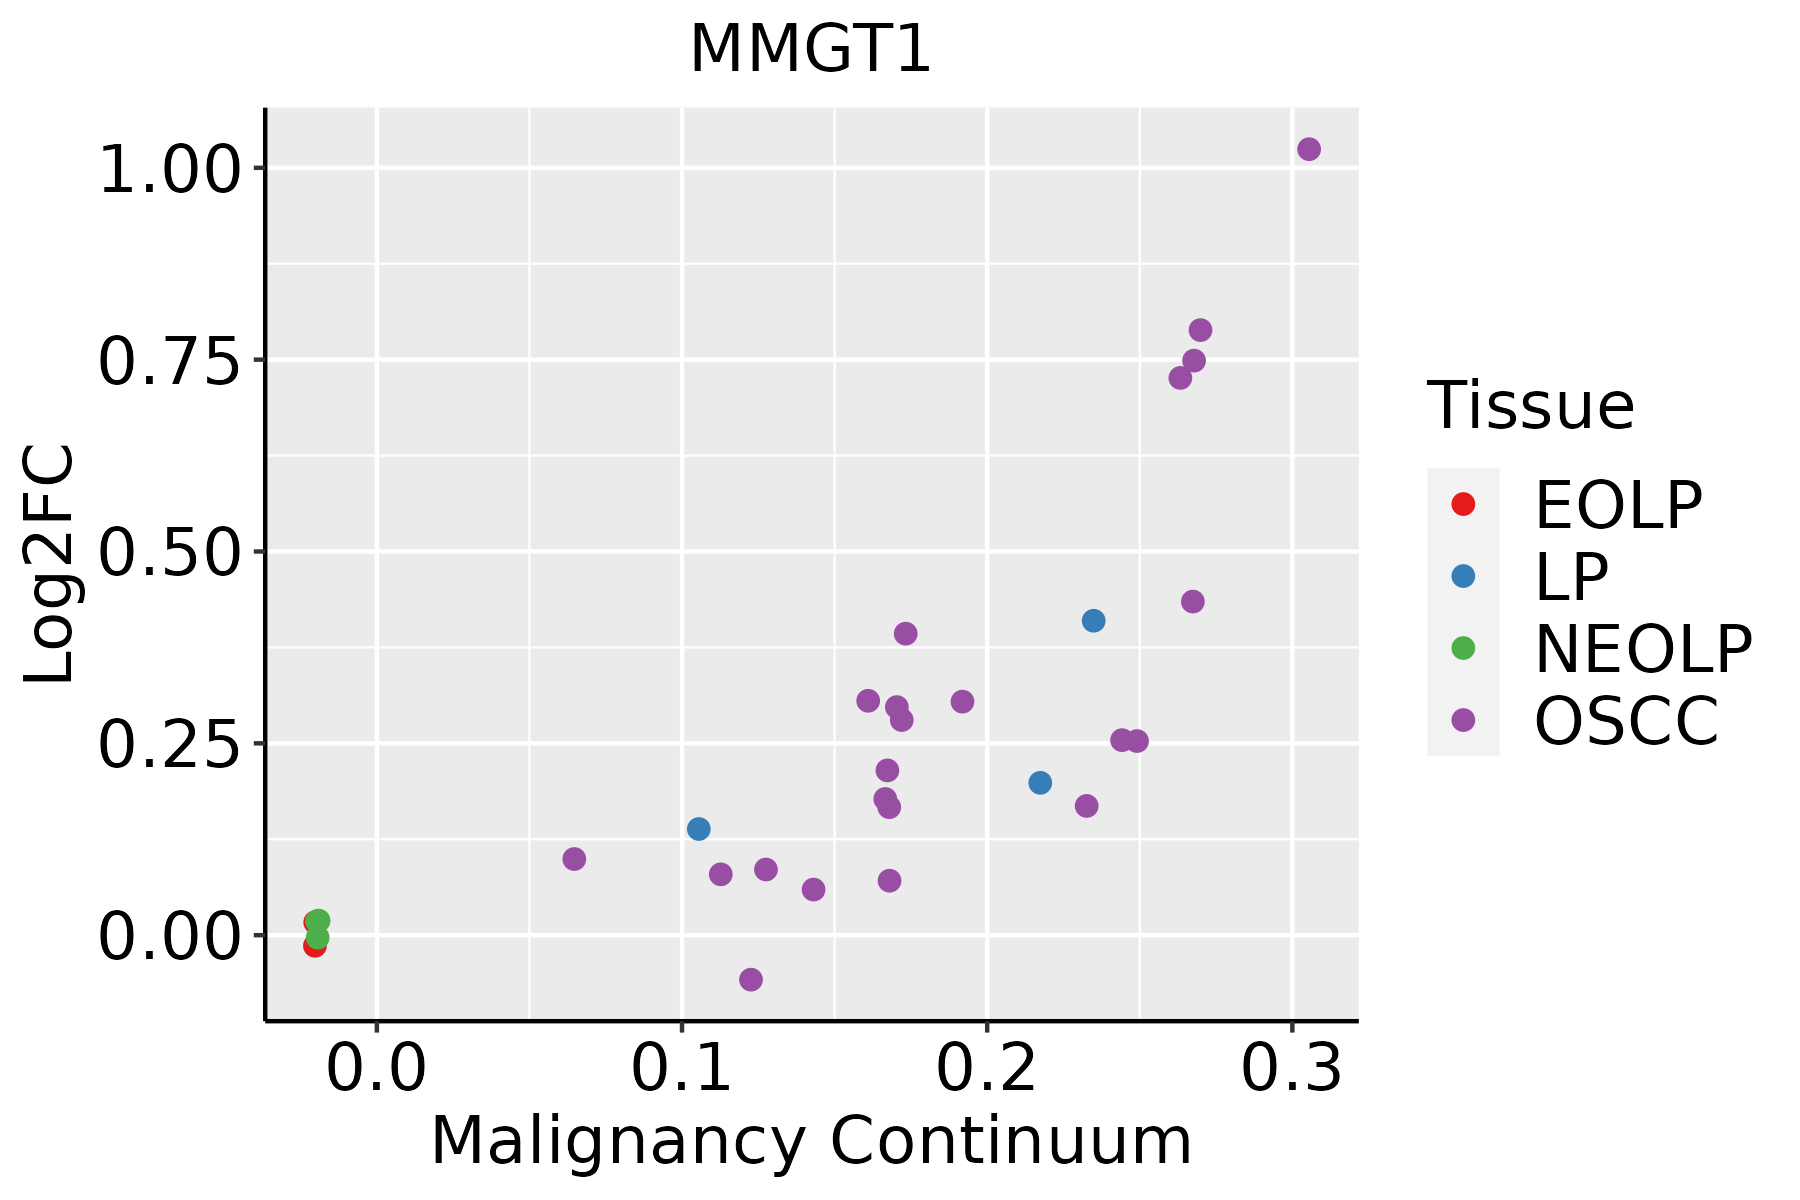 | EOLP: Erosive Oral lichen planus |
| LP: leukoplakia | ||
| NEOLP: Non-erosive oral lichen planus | ||
| OSCC: Oral squamous cell carcinoma |
| ∗log2FC in expression of this searched gene in stem-like cells from each diseased tissue sample relative to stem-like cells in normal samples in each tissue plotted against the malignancy continuum. Samples are colored based on if they are from different disease stage. |
Top |
Malignant transformation related pathway analysis |
| Find out the enriched GO biological processes and KEGG pathways involved in transition from healthy to precancer to cancer |
| Tissue | Disease Stage | Enriched GO biological Processes |
| Colorectum | AD |  |
| Colorectum | SER |  |
| Colorectum | MSS |  |
| Colorectum | MSI-H |  |
| Colorectum | FAP |  |
| ∗Top 15 enriched GO BP terms are showed in the bar plot of each disease state in each tissue. Each row represents a significant GO biological process which is colored according to the -log10(p.adjust). |
| Page: 1 2 3 4 5 6 7 8 9 |
| GO ID | Tissue | Disease Stage | Description | Gene Ratio | Bg Ratio | pvalue | p.adjust | Count |
| GO:0090150110 | Esophagus | ESCC | establishment of protein localization to membrane | 182/8552 | 260/18723 | 1.27e-15 | 8.19e-14 | 182 |
| GO:000702914 | Esophagus | ESCC | endoplasmic reticulum organization | 65/8552 | 87/18723 | 3.28e-08 | 6.08e-07 | 65 |
| GO:005120515 | Esophagus | ESCC | protein insertion into membrane | 46/8552 | 57/18723 | 5.90e-08 | 1.04e-06 | 46 |
| GO:004504812 | Esophagus | ESCC | protein insertion into ER membrane | 21/8552 | 22/18723 | 8.75e-07 | 1.13e-05 | 21 |
| GO:007181611 | Esophagus | ESCC | tail-anchored membrane protein insertion into ER membrane | 17/8552 | 17/18723 | 1.63e-06 | 1.95e-05 | 17 |
| GO:00450503 | Esophagus | ESCC | protein insertion into ER membrane by stop-transfer membrane-anchor sequence | 10/8552 | 10/18723 | 3.94e-04 | 2.26e-03 | 10 |
| GO:009015012 | Liver | HCC | establishment of protein localization to membrane | 168/7958 | 260/18723 | 4.07e-13 | 2.13e-11 | 168 |
| GO:000702911 | Liver | HCC | endoplasmic reticulum organization | 64/7958 | 87/18723 | 3.92e-09 | 1.04e-07 | 64 |
| GO:005120511 | Liver | HCC | protein insertion into membrane | 41/7958 | 57/18723 | 6.42e-06 | 7.83e-05 | 41 |
| GO:0071816 | Liver | HCC | tail-anchored membrane protein insertion into ER membrane | 15/7958 | 17/18723 | 1.31e-04 | 1.07e-03 | 15 |
| GO:00450481 | Liver | HCC | protein insertion into ER membrane | 18/7958 | 22/18723 | 1.91e-04 | 1.49e-03 | 18 |
| GO:0045050 | Liver | HCC | protein insertion into ER membrane by stop-transfer membrane-anchor sequence | 10/7958 | 10/18723 | 1.92e-04 | 1.49e-03 | 10 |
| GO:009015018 | Oral cavity | OSCC | establishment of protein localization to membrane | 163/7305 | 260/18723 | 7.13e-15 | 4.47e-13 | 163 |
| GO:00070294 | Oral cavity | OSCC | endoplasmic reticulum organization | 58/7305 | 87/18723 | 1.59e-07 | 2.61e-06 | 58 |
| GO:00512056 | Oral cavity | OSCC | protein insertion into membrane | 40/7305 | 57/18723 | 1.81e-06 | 2.34e-05 | 40 |
| GO:00450502 | Oral cavity | OSCC | protein insertion into ER membrane by stop-transfer membrane-anchor sequence | 10/7305 | 10/18723 | 8.14e-05 | 6.26e-04 | 10 |
| GO:00450482 | Oral cavity | OSCC | protein insertion into ER membrane | 17/7305 | 22/18723 | 2.99e-04 | 1.87e-03 | 17 |
| GO:00718162 | Oral cavity | OSCC | tail-anchored membrane protein insertion into ER membrane | 14/7305 | 17/18723 | 3.31e-04 | 2.04e-03 | 14 |
| Page: 1 |
| Pathway ID | Tissue | Disease Stage | Description | Gene Ratio | Bg Ratio | pvalue | p.adjust | qvalue | Count |
| Page: 1 |
Top |
Cell-cell communication analysis |
| Identification of potential cell-cell interactions between two cell types and their ligand-receptor pairs for different disease states |
| Ligand | Receptor | LRpair | Pathway | Tissue | Disease Stage |
| Page: 1 |
Top |
Single-cell gene regulatory network inference analysis |
| Find out the significant the regulons (TFs) and the target genes of each regulon across cell types for different disease states |
| TF | Cell Type | Tissue | Disease Stage | Target Gene | RSS | Regulon Activity |
| ∗The dot plots of a searched regulon are shown for all cell subpopulations in each disease state of each tissue based on the regulon specific score inferred using pySCENIC and by calculating the average expression. |
| Page: 1 |
Top |
Somatic mutation of malignant transformation related genes |
| Annotation of somatic variants for genes involved in malignant transformation |
| Hugo Symbol | Variant Class | Variant Classification | dbSNP RS | HGVSc | HGVSp | HGVSp Short | SWISSPROT | BIOTYPE | SIFT | PolyPhen | Tumor Sample Barcode | Tissue | Histology | Sex | Age | Stage | Therapy Types | Drugs | Outcome |
| MMGT1 | SNV | Missense_Mutation | c.86N>T | p.Ser29Phe | p.S29F | Q8N4V1 | protein_coding | deleterious(0) | possibly_damaging(0.701) | TCGA-E9-A228-01 | Breast | breast invasive carcinoma | Female | <65 | I/II | Chemotherapy | doxorubicin | SD | |
| MMGT1 | SNV | Missense_Mutation | novel | c.70N>A | p.Ala24Thr | p.A24T | Q8N4V1 | protein_coding | deleterious(0.04) | probably_damaging(0.936) | TCGA-PN-A8MA-01 | Cervix | cervical & endocervical cancer | Female | <65 | I/II | Chemotherapy | cisplatin | SD |
| MMGT1 | SNV | Missense_Mutation | novel | c.112N>C | p.Asp38His | p.D38H | Q8N4V1 | protein_coding | tolerated(0.56) | benign(0.003) | TCGA-VS-A953-01 | Cervix | cervical & endocervical cancer | Female | <65 | I/II | Unknown | Unknown | PD |
| MMGT1 | SNV | Missense_Mutation | rs782610277 | c.389N>A | p.Arg130His | p.R130H | Q8N4V1 | protein_coding | deleterious_low_confidence(0) | benign(0) | TCGA-A6-3809-01 | Colorectum | colon adenocarcinoma | Female | >=65 | I/II | Unknown | Unknown | SD |
| MMGT1 | SNV | Missense_Mutation | novel | c.5N>T | p.Ala2Val | p.A2V | Q8N4V1 | protein_coding | tolerated(0.18) | benign(0.009) | TCGA-A5-A0GG-01 | Endometrium | uterine corpus endometrioid carcinoma | Female | >=65 | I/II | Unknown | Unknown | SD |
| MMGT1 | SNV | Missense_Mutation | c.248N>T | p.Thr83Met | p.T83M | Q8N4V1 | protein_coding | tolerated(0.05) | possibly_damaging(0.896) | TCGA-AX-A06F-01 | Endometrium | uterine corpus endometrioid carcinoma | Female | <65 | III/IV | Chemotherapy | carboplatin | SD | |
| MMGT1 | SNV | Missense_Mutation | rs782214612 | c.388N>T | p.Arg130Cys | p.R130C | Q8N4V1 | protein_coding | deleterious_low_confidence(0) | benign(0.353) | TCGA-B5-A0K9-01 | Endometrium | uterine corpus endometrioid carcinoma | Female | >=65 | I/II | Unknown | Unknown | SD |
| MMGT1 | SNV | Missense_Mutation | c.293N>A | p.Arg98Gln | p.R98Q | Q8N4V1 | protein_coding | tolerated(0.08) | possibly_damaging(0.722) | TCGA-B5-A11N-01 | Endometrium | uterine corpus endometrioid carcinoma | Female | >=65 | I/II | Unknown | Unknown | SD | |
| MMGT1 | SNV | Missense_Mutation | novel | c.298N>T | p.Leu100Phe | p.L100F | Q8N4V1 | protein_coding | deleterious(0) | possibly_damaging(0.885) | TCGA-B5-A1MX-01 | Endometrium | uterine corpus endometrioid carcinoma | Female | <65 | I/II | Hormone Therapy | megace | SD |
| MMGT1 | SNV | Missense_Mutation | novel | c.368N>C | p.Leu123Ser | p.L123S | Q8N4V1 | protein_coding | deleterious_low_confidence(0) | benign(0.278) | TCGA-D1-A175-01 | Endometrium | uterine corpus endometrioid carcinoma | Female | <65 | I/II | Chemotherapy | paclitaxel | SD |
| Page: 1 2 |
Top |
Related drugs of malignant transformation related genes |
| Identification of chemicals and drugs interact with genes involved in malignant transfromation |
| (DGIdb 4.0) |
| Entrez ID | Symbol | Category | Interaction Types | Drug Claim Name | Drug Name | PMIDs |
| Page: 1 |

Copyright 2023-Present -The University of Texas Health Science Center at Houston |