
|
|||||
|
 | |
| |
| |
| |
| |
| |
|
Gene: MME |
Gene summary for MME |
| Gene information | Species | Human | Gene symbol | MME | Gene ID | 4311 |
| Gene name | membrane metalloendopeptidase | |
| Gene Alias | CALLA | |
| Cytomap | 3q25.2 | |
| Gene Type | protein-coding | GO ID | GO:0000003 | UniProtAcc | P08473 |
Top |
Malignant transformation analysis |
| Identification of the aberrant gene expression in precancerous and cancerous lesions by comparing the gene expression of stem-like cells in diseased tissues with normal stem cells |
| Entrez ID | Symbol | Replicates | Species | Organ | Tissue | Adj P-value | Log2FC | Malignancy |
| 4311 | MME | HTA11_99999971662_82457 | Human | Colorectum | MSS | 4.02e-55 | 1.35e+00 | 0.3859 |
| 4311 | MME | HTA11_99999974143_84620 | Human | Colorectum | MSS | 9.83e-16 | 3.60e-01 | 0.3005 |
| 4311 | MME | A001-C-119 | Human | Colorectum | FAP | 8.34e-10 | 5.37e-01 | -0.1557 |
| 4311 | MME | CRC-1-8810 | Human | Colorectum | CRC | 1.44e-19 | 5.58e-01 | 0.6257 |
| 4311 | MME | cirrhotic3 | Human | Liver | Cirrhotic | 2.51e-02 | -1.26e-01 | 0.0215 |
| 4311 | MME | Pt13.a | Human | Liver | HCC | 2.05e-03 | -1.23e-01 | 0.021 |
| 4311 | MME | Pt14.d | Human | Liver | HCC | 2.05e-03 | -1.26e-01 | 0.0143 |
| 4311 | MME | S014 | Human | Liver | HCC | 4.98e-51 | 2.97e+00 | 0.2254 |
| 4311 | MME | S015 | Human | Liver | HCC | 1.89e-36 | 2.92e+00 | 0.2375 |
| 4311 | MME | S016 | Human | Liver | HCC | 3.01e-55 | 3.10e+00 | 0.2243 |
| 4311 | MME | C21 | Human | Oral cavity | OSCC | 2.03e-31 | 8.38e-01 | 0.2678 |
| 4311 | MME | C06 | Human | Oral cavity | OSCC | 2.49e-10 | 1.72e+00 | 0.2699 |
| 4311 | MME | C07 | Human | Oral cavity | OSCC | 3.37e-06 | 9.33e-01 | 0.2491 |
| 4311 | MME | C08 | Human | Oral cavity | OSCC | 6.38e-03 | 2.68e-01 | 0.1919 |
| 4311 | MME | SYSMH1 | Human | Oral cavity | OSCC | 1.73e-02 | 1.16e-01 | 0.1127 |
| 4311 | MME | 047563_1562-all-cells | Human | Prostate | BPH | 1.07e-07 | -8.00e-02 | 0.0791 |
| 4311 | MME | Dong_P1 | Human | Prostate | Tumor | 8.27e-07 | -1.29e-01 | 0.035 |
| 4311 | MME | Dong_P3 | Human | Prostate | Tumor | 1.12e-19 | 3.46e-01 | 0.0278 |
| 4311 | MME | Dong_P5 | Human | Prostate | Tumor | 2.70e-10 | 5.28e-03 | 0.053 |
| 4311 | MME | GSM5353221_PA_PB2A_Pool_1_3_S25_L001 | Human | Prostate | Tumor | 8.11e-11 | 7.50e-01 | 0.1633 |
| Page: 1 2 3 |
| Tissue | Expression Dynamics | Abbreviation |
| Colorectum (GSE201348) |  | FAP: Familial adenomatous polyposis |
| CRC: Colorectal cancer | ||
| Colorectum (HTA11) |  | AD: Adenomas |
| SER: Sessile serrated lesions | ||
| MSI-H: Microsatellite-high colorectal cancer | ||
| MSS: Microsatellite stable colorectal cancer | ||
| GC | 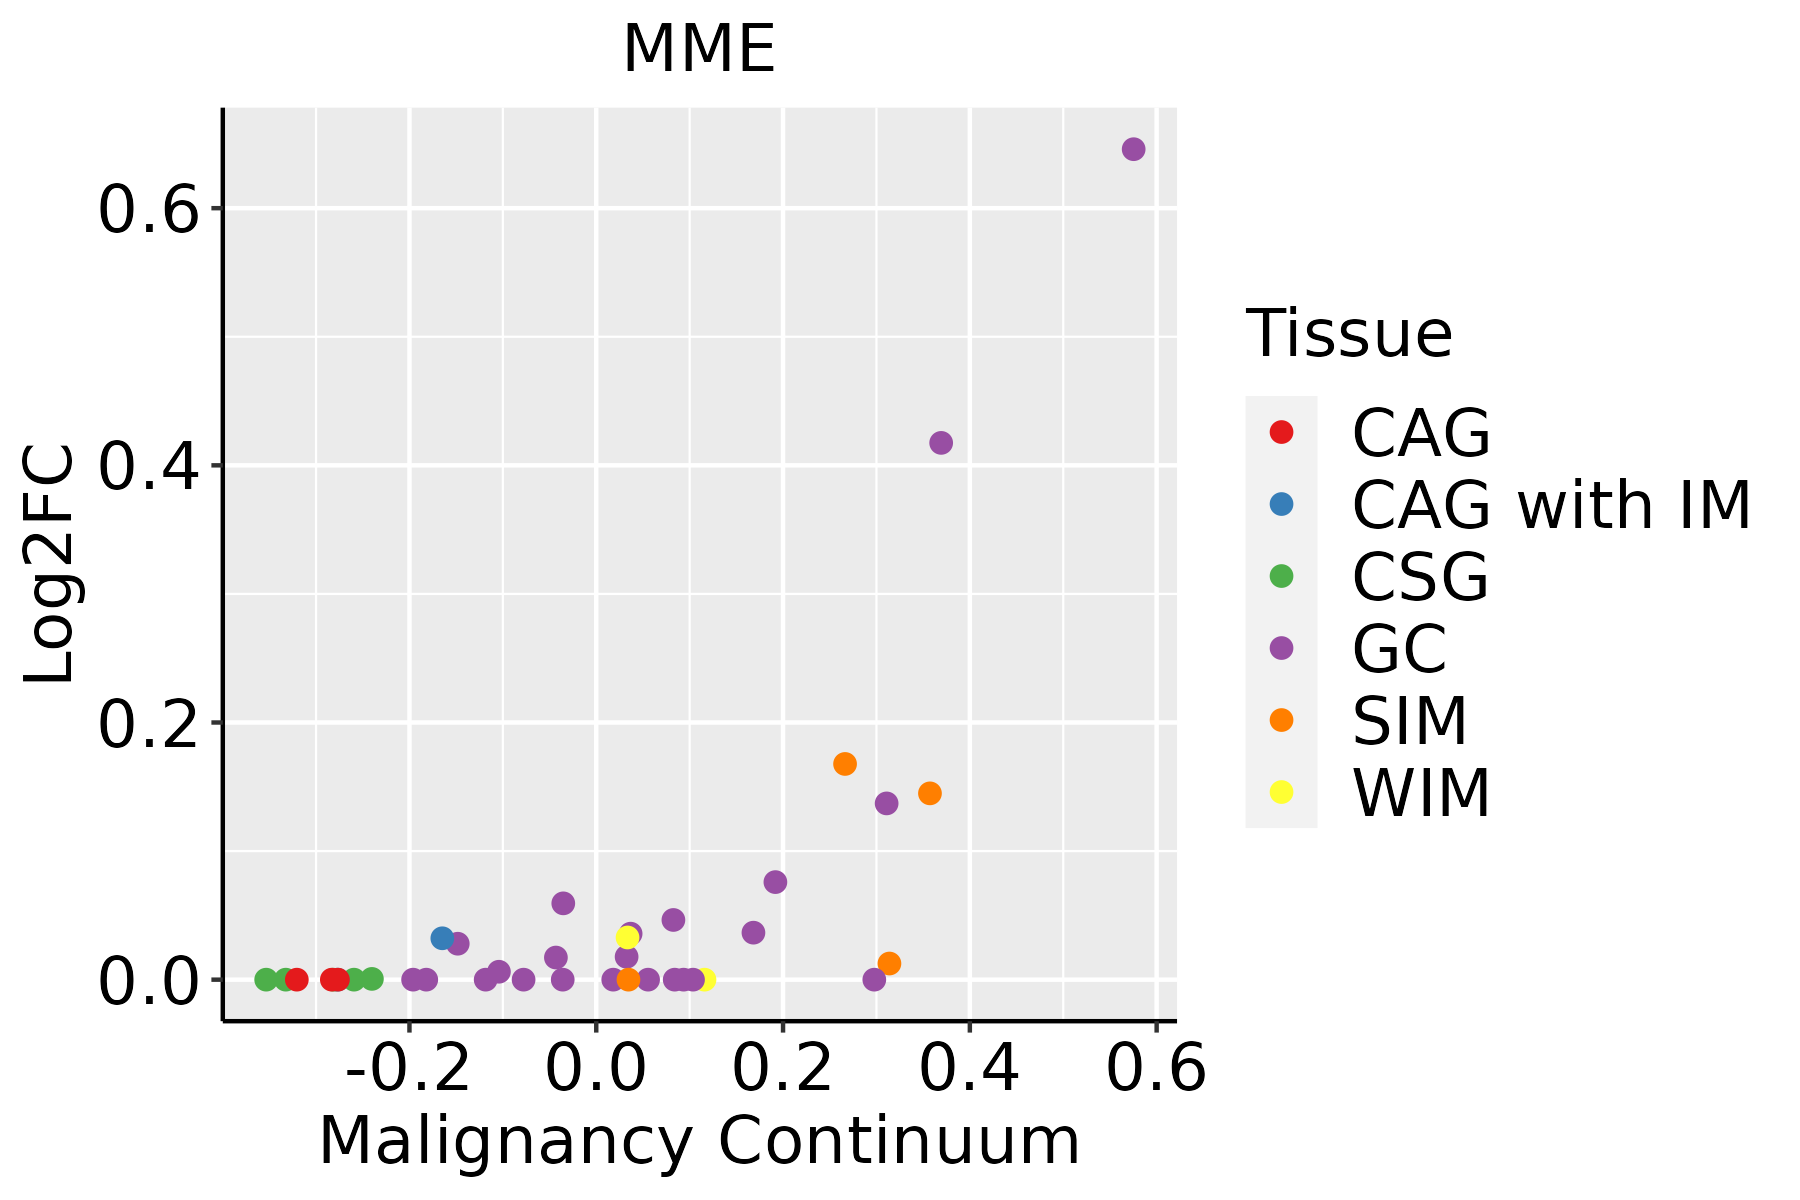 | CAG: Chronic atrophic gastritis |
| CAG with IM: Chronic atrophic gastritis with intestinal metaplasia | ||
| CSG: Chronic superficial gastritis | ||
| GC: Gastric cancer | ||
| SIM: Severe intestinal metaplasia | ||
| WIM: Wild intestinal metaplasia | ||
| Liver | 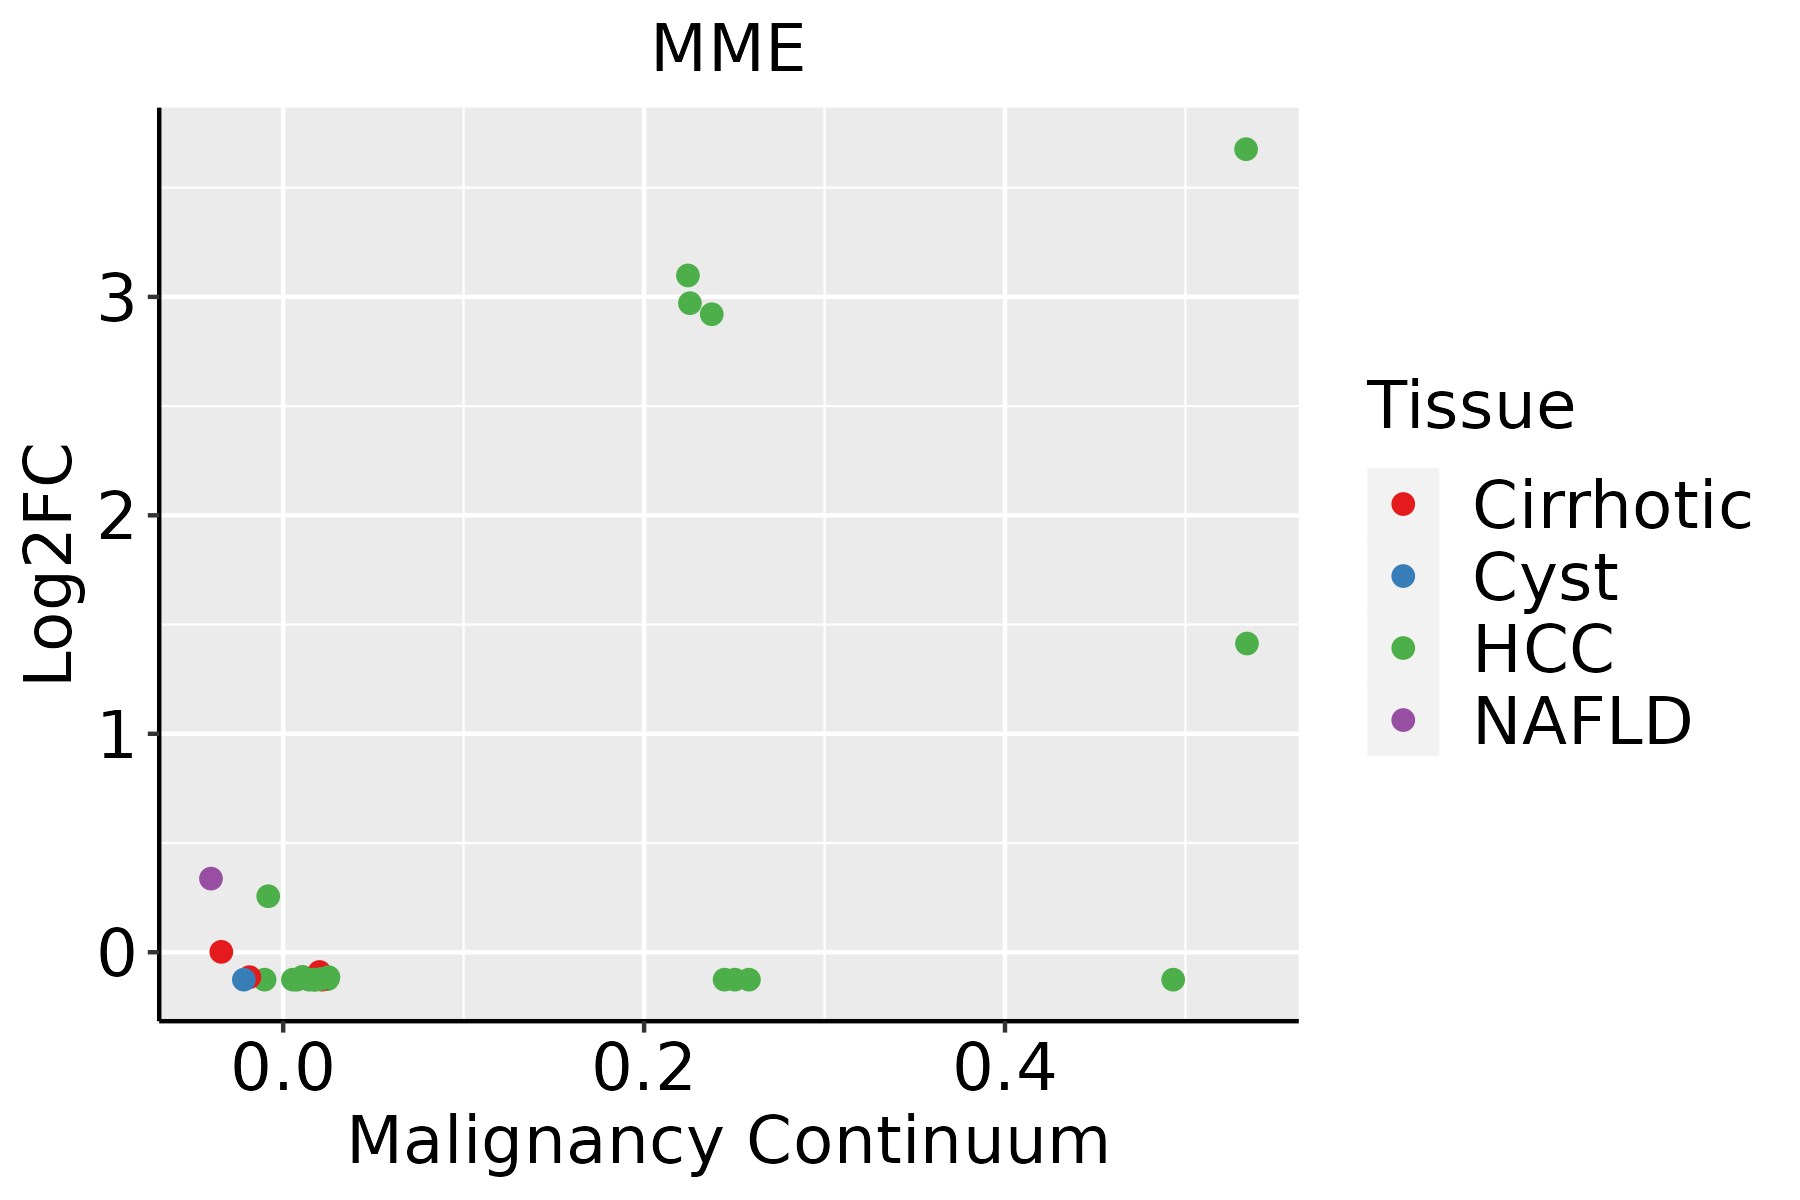 | HCC: Hepatocellular carcinoma |
| NAFLD: Non-alcoholic fatty liver disease | ||
| Oral Cavity | 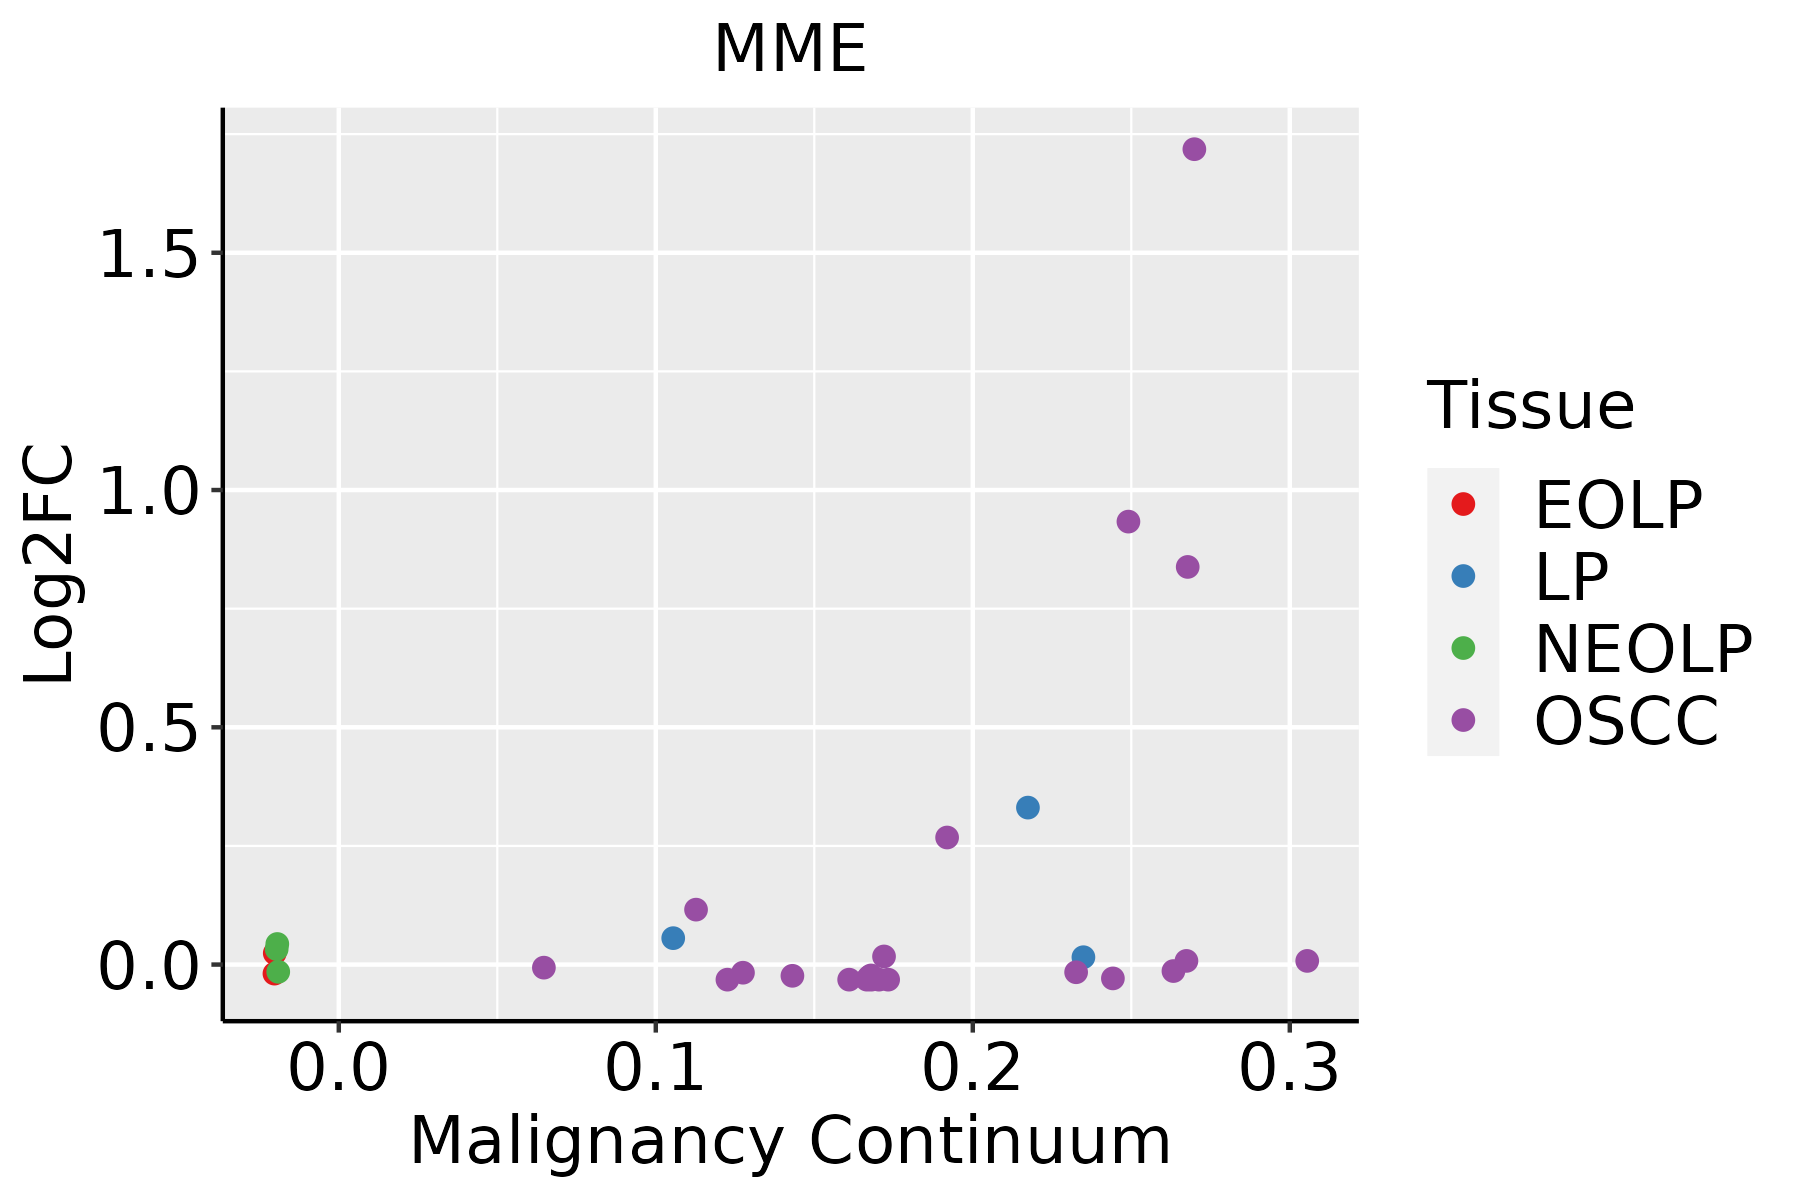 | EOLP: Erosive Oral lichen planus |
| LP: leukoplakia | ||
| NEOLP: Non-erosive oral lichen planus | ||
| OSCC: Oral squamous cell carcinoma | ||
| Prostate | 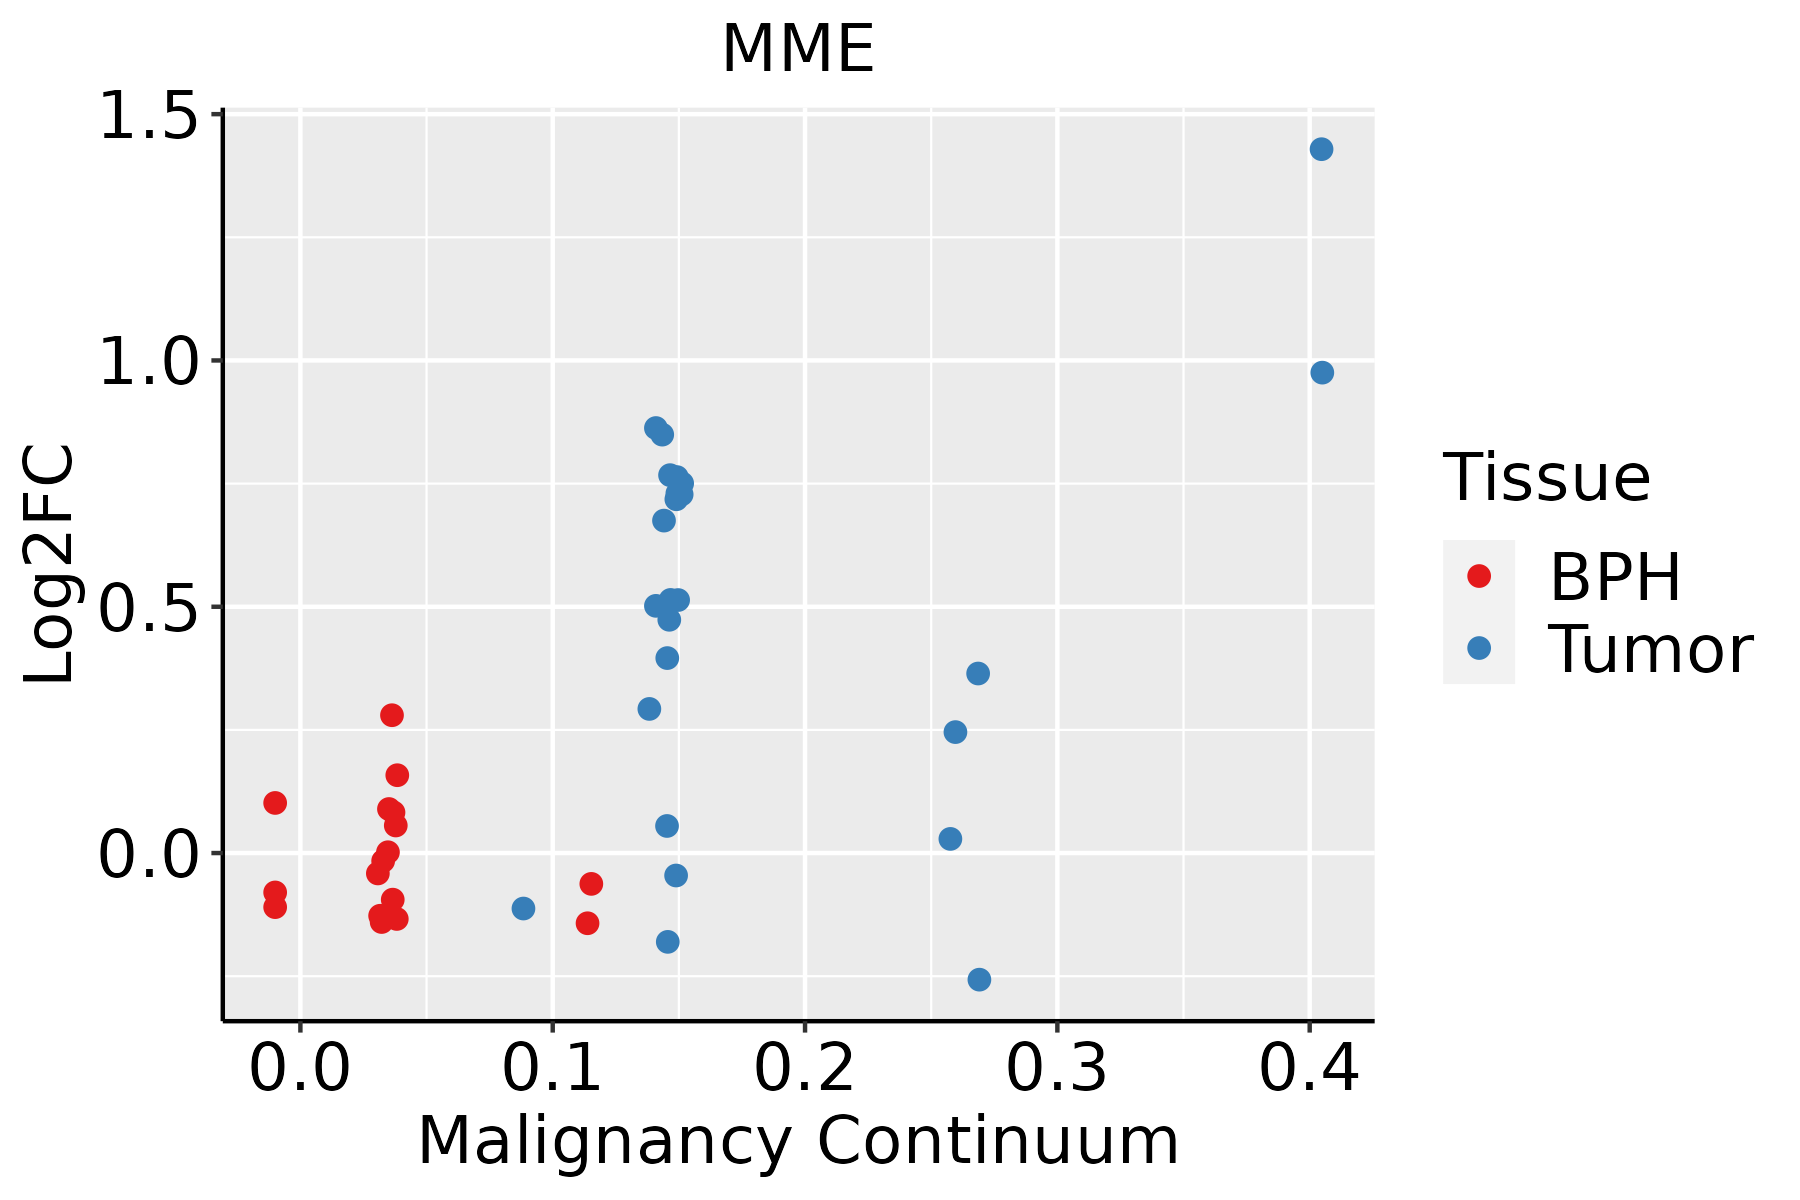 | BPH: Benign Prostatic Hyperplasia |
| Thyroid | 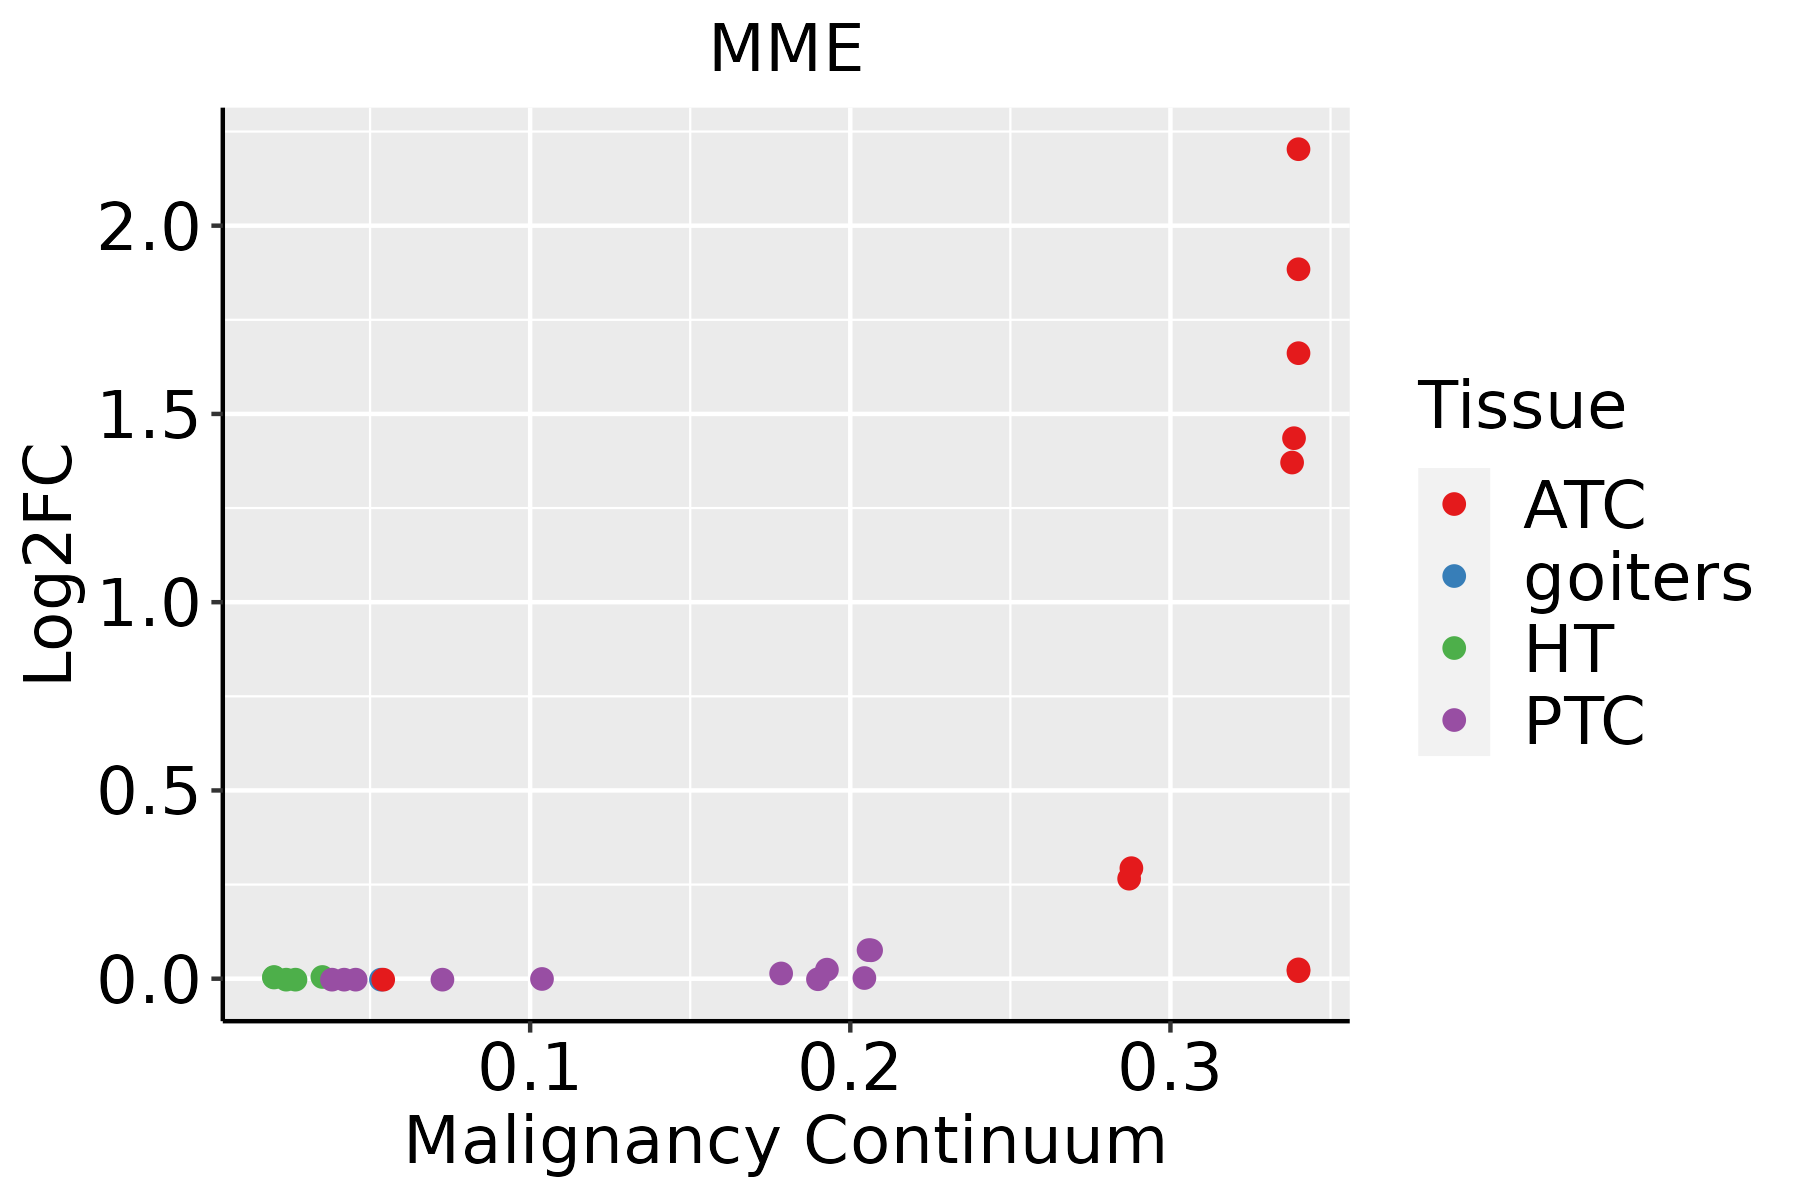 | ATC: Anaplastic thyroid cancer |
| HT: Hashimoto's thyroiditis | ||
| PTC: Papillary thyroid cancer |
| ∗log2FC in expression of this searched gene in stem-like cells from each diseased tissue sample relative to stem-like cells in normal samples in each tissue plotted against the malignancy continuum. Samples are colored based on if they are from different disease stage. |
Top |
Malignant transformation related pathway analysis |
| Find out the enriched GO biological processes and KEGG pathways involved in transition from healthy to precancer to cancer |
| Tissue | Disease Stage | Enriched GO biological Processes |
| Colorectum | AD |  |
| Colorectum | SER |  |
| Colorectum | MSS |  |
| Colorectum | MSI-H |  |
| Colorectum | FAP |  |
| ∗Top 15 enriched GO BP terms are showed in the bar plot of each disease state in each tissue. Each row represents a significant GO biological process which is colored according to the -log10(p.adjust). |
| Page: 1 2 3 4 5 6 7 8 9 |
| GO ID | Tissue | Disease Stage | Description | Gene Ratio | Bg Ratio | pvalue | p.adjust | Count |
| GO:00018902 | Colorectum | MSS | placenta development | 51/3467 | 144/18723 | 1.10e-06 | 3.77e-05 | 51 |
| GO:00614582 | Colorectum | MSS | reproductive system development | 115/3467 | 427/18723 | 9.86e-06 | 2.39e-04 | 115 |
| GO:00486082 | Colorectum | MSS | reproductive structure development | 113/3467 | 424/18723 | 1.94e-05 | 4.18e-04 | 113 |
| GO:00107202 | Colorectum | MSS | positive regulation of cell development | 81/3467 | 298/18723 | 1.38e-04 | 2.06e-03 | 81 |
| GO:00075681 | Colorectum | MSS | aging | 90/3467 | 339/18723 | 1.51e-04 | 2.19e-03 | 90 |
| GO:00507671 | Colorectum | MSS | regulation of neurogenesis | 94/3467 | 364/18723 | 3.12e-04 | 4.06e-03 | 94 |
| GO:00516042 | Colorectum | MSS | protein maturation | 75/3467 | 294/18723 | 1.70e-03 | 1.53e-02 | 75 |
| GO:0097242 | Colorectum | MSS | amyloid-beta clearance | 14/3467 | 38/18723 | 6.00e-03 | 4.03e-02 | 14 |
| GO:00164852 | Colorectum | MSS | protein processing | 57/3467 | 225/18723 | 6.60e-03 | 4.38e-02 | 57 |
| GO:0050769 | Colorectum | MSS | positive regulation of neurogenesis | 57/3467 | 225/18723 | 6.60e-03 | 4.38e-02 | 57 |
| GO:0051960 | Colorectum | MSS | regulation of nervous system development | 103/3467 | 443/18723 | 6.68e-03 | 4.38e-02 | 103 |
| GO:0001655 | Colorectum | MSS | urogenital system development | 81/3467 | 338/18723 | 6.88e-03 | 4.43e-02 | 81 |
| GO:0050435 | Colorectum | MSS | amyloid-beta metabolic process | 21/3467 | 67/18723 | 7.90e-03 | 4.84e-02 | 21 |
| GO:00107203 | Colorectum | FAP | positive regulation of cell development | 72/2622 | 298/18723 | 1.67e-06 | 6.99e-05 | 72 |
| GO:00507672 | Colorectum | FAP | regulation of neurogenesis | 82/2622 | 364/18723 | 6.28e-06 | 1.96e-04 | 82 |
| GO:00018903 | Colorectum | FAP | placenta development | 38/2622 | 144/18723 | 6.22e-05 | 1.21e-03 | 38 |
| GO:00507691 | Colorectum | FAP | positive regulation of neurogenesis | 53/2622 | 225/18723 | 7.65e-05 | 1.37e-03 | 53 |
| GO:00519601 | Colorectum | FAP | regulation of nervous system development | 89/2622 | 443/18723 | 2.32e-04 | 3.25e-03 | 89 |
| GO:00016551 | Colorectum | FAP | urogenital system development | 70/2622 | 338/18723 | 4.26e-04 | 5.11e-03 | 70 |
| GO:00614583 | Colorectum | FAP | reproductive system development | 85/2622 | 427/18723 | 4.30e-04 | 5.13e-03 | 85 |
| Page: 1 2 3 4 5 6 7 8 9 10 11 |
| Pathway ID | Tissue | Disease Stage | Description | Gene Ratio | Bg Ratio | pvalue | p.adjust | qvalue | Count |
| hsa050104 | Colorectum | MSS | Alzheimer disease | 169/1875 | 384/8465 | 1.21e-22 | 1.01e-20 | 6.21e-21 | 169 |
| hsa050105 | Colorectum | MSS | Alzheimer disease | 169/1875 | 384/8465 | 1.21e-22 | 1.01e-20 | 6.21e-21 | 169 |
| hsa050108 | Colorectum | FAP | Alzheimer disease | 105/1404 | 384/8465 | 3.74e-08 | 1.04e-06 | 6.33e-07 | 105 |
| hsa050109 | Colorectum | FAP | Alzheimer disease | 105/1404 | 384/8465 | 3.74e-08 | 1.04e-06 | 6.33e-07 | 105 |
| hsa0501022 | Liver | HCC | Alzheimer disease | 254/4020 | 384/8465 | 3.75e-14 | 8.97e-13 | 4.99e-13 | 254 |
| hsa0501032 | Liver | HCC | Alzheimer disease | 254/4020 | 384/8465 | 3.75e-14 | 8.97e-13 | 4.99e-13 | 254 |
| hsa0501028 | Oral cavity | OSCC | Alzheimer disease | 244/3704 | 384/8465 | 1.18e-15 | 3.60e-14 | 1.83e-14 | 244 |
| hsa05010112 | Oral cavity | OSCC | Alzheimer disease | 244/3704 | 384/8465 | 1.18e-15 | 3.60e-14 | 1.83e-14 | 244 |
| hsa0501026 | Prostate | BPH | Alzheimer disease | 165/1718 | 384/8465 | 4.03e-25 | 1.66e-23 | 1.03e-23 | 165 |
| hsa05010111 | Prostate | BPH | Alzheimer disease | 165/1718 | 384/8465 | 4.03e-25 | 1.66e-23 | 1.03e-23 | 165 |
| hsa0501027 | Prostate | Tumor | Alzheimer disease | 166/1791 | 384/8465 | 1.64e-23 | 6.79e-22 | 4.21e-22 | 166 |
| hsa0501036 | Prostate | Tumor | Alzheimer disease | 166/1791 | 384/8465 | 1.64e-23 | 6.79e-22 | 4.21e-22 | 166 |
| hsa0501012 | Stomach | GC | Alzheimer disease | 73/708 | 384/8465 | 9.57e-12 | 2.55e-10 | 1.80e-10 | 73 |
| hsa0501013 | Stomach | GC | Alzheimer disease | 73/708 | 384/8465 | 9.57e-12 | 2.55e-10 | 1.80e-10 | 73 |
| Page: 1 |
Top |
Cell-cell communication analysis |
| Identification of potential cell-cell interactions between two cell types and their ligand-receptor pairs for different disease states |
| Ligand | Receptor | LRpair | Pathway | Tissue | Disease Stage |
| Page: 1 |
Top |
Single-cell gene regulatory network inference analysis |
| Find out the significant the regulons (TFs) and the target genes of each regulon across cell types for different disease states |
| TF | Cell Type | Tissue | Disease Stage | Target Gene | RSS | Regulon Activity |
| ∗The dot plots of a searched regulon are shown for all cell subpopulations in each disease state of each tissue based on the regulon specific score inferred using pySCENIC and by calculating the average expression. |
| Page: 1 |
Top |
Somatic mutation of malignant transformation related genes |
| Annotation of somatic variants for genes involved in malignant transformation |
| Hugo Symbol | Variant Class | Variant Classification | dbSNP RS | HGVSc | HGVSp | HGVSp Short | SWISSPROT | BIOTYPE | SIFT | PolyPhen | Tumor Sample Barcode | Tissue | Histology | Sex | Age | Stage | Therapy Types | Drugs | Outcome |
| MME | SNV | Missense_Mutation | novel | c.1369N>T | p.Asp457Tyr | p.D457Y | P08473 | protein_coding | deleterious(0) | possibly_damaging(0.9) | TCGA-3C-AALI-01 | Breast | breast invasive carcinoma | Female | <65 | I/II | Unspecific | Poly E | Complete Response |
| MME | SNV | Missense_Mutation | novel | c.1468G>C | p.Asp490His | p.D490H | P08473 | protein_coding | tolerated(0.06) | benign(0.281) | TCGA-5L-AAT1-01 | Breast | breast invasive carcinoma | Female | <65 | III/IV | Hormone Therapy | letrozol | SD |
| MME | SNV | Missense_Mutation | c.1390N>C | p.Glu464Gln | p.E464Q | P08473 | protein_coding | tolerated(0.2) | benign(0.046) | TCGA-AC-A23H-01 | Breast | breast invasive carcinoma | Female | >=65 | I/II | Unknown | Unknown | PD | |
| MME | SNV | Missense_Mutation | novel | c.1072N>G | p.Ile358Val | p.I358V | P08473 | protein_coding | tolerated(0.35) | benign(0.1) | TCGA-D8-A1XB-01 | Breast | breast invasive carcinoma | Female | <65 | I/II | Unknown | Unknown | SD |
| MME | SNV | Missense_Mutation | c.1753N>C | p.Glu585Gln | p.E585Q | P08473 | protein_coding | deleterious(0) | probably_damaging(1) | TCGA-E2-A14V-01 | Breast | breast invasive carcinoma | Female | <65 | I/II | Chemotherapy | cyclophosphamide | SD | |
| MME | SNV | Missense_Mutation | novel | c.1079N>A | p.Thr360Asn | p.T360N | P08473 | protein_coding | tolerated(0.78) | benign(0) | TCGA-EA-A3HU-01 | Cervix | cervical & endocervical cancer | Female | <65 | I/II | Unknown | Unknown | SD |
| MME | SNV | Missense_Mutation | c.1540N>C | p.Asn514His | p.N514H | P08473 | protein_coding | tolerated(0.07) | probably_damaging(0.982) | TCGA-FU-A3HZ-01 | Cervix | cervical & endocervical cancer | Female | <65 | I/II | Chemotherapy | cisplatin | CR | |
| MME | SNV | Missense_Mutation | rs200787530 | c.1889C>T | p.Ser630Phe | p.S630F | P08473 | protein_coding | deleterious(0) | probably_damaging(0.962) | TCGA-HM-A6W2-06 | Cervix | cervical & endocervical cancer | Female | <65 | I/II | Chemotherapy | cisplatin | SD |
| MME | SNV | Missense_Mutation | novel | c.1468N>A | p.Asp490Asn | p.D490N | P08473 | protein_coding | tolerated(0.25) | benign(0) | TCGA-XS-A8TJ-01 | Cervix | cervical & endocervical cancer | Female | <65 | I/II | Chemotherapy | cisplatin | SD |
| MME | SNV | Missense_Mutation | rs773654354 | c.1321N>A | p.Glu441Lys | p.E441K | P08473 | protein_coding | tolerated(0.81) | benign(0.026) | TCGA-ZJ-AAXB-01 | Cervix | cervical & endocervical cancer | Female | <65 | I/II | Unknown | Unknown | SD |
| Page: 1 2 3 4 5 6 7 8 9 10 11 12 13 |
Top |
Related drugs of malignant transformation related genes |
| Identification of chemicals and drugs interact with genes involved in malignant transfromation |
| (DGIdb 4.0) |
| Entrez ID | Symbol | Category | Interaction Types | Drug Claim Name | Drug Name | PMIDs |
| 4311 | MME | DRUGGABLE GENOME, PROTEASE, CELL SURFACE, ENZYME | inhibitor | 178103105 | CANDOXATRILAT | |
| 4311 | MME | DRUGGABLE GENOME, PROTEASE, CELL SURFACE, ENZYME | SLV-338 | |||
| 4311 | MME | DRUGGABLE GENOME, PROTEASE, CELL SURFACE, ENZYME | PL37 | |||
| 4311 | MME | DRUGGABLE GENOME, PROTEASE, CELL SURFACE, ENZYME | CANDOXATRIL | CANDOXATRIL | ||
| 4311 | MME | DRUGGABLE GENOME, PROTEASE, CELL SURFACE, ENZYME | CD10-CART | |||
| 4311 | MME | DRUGGABLE GENOME, PROTEASE, CELL SURFACE, ENZYME | inhibitor | 252166827 | ||
| 4311 | MME | DRUGGABLE GENOME, PROTEASE, CELL SURFACE, ENZYME | CANDOXATRIL | CANDOXATRIL | ||
| 4311 | MME | DRUGGABLE GENOME, PROTEASE, CELL SURFACE, ENZYME | inhibitor | 178103121 | ||
| 4311 | MME | DRUGGABLE GENOME, PROTEASE, CELL SURFACE, ENZYME | inhibitor | 178101961 | THIORPHAN | |
| 4311 | MME | DRUGGABLE GENOME, PROTEASE, CELL SURFACE, ENZYME | inhibitor | 178103106 | CANDOXATRIL |
| Page: 1 2 3 |

Copyright 2023-Present -The University of Texas Health Science Center at Houston |