
|
|||||
|
 | |
| |
| |
| |
| |
| |
|
Gene: MMACHC |
Gene summary for MMACHC |
| Gene information | Species | Human | Gene symbol | MMACHC | Gene ID | 25974 |
| Gene name | metabolism of cobalamin associated C | |
| Gene Alias | cblC | |
| Cytomap | 1p34.1 | |
| Gene Type | protein-coding | GO ID | GO:0006518 | UniProtAcc | A0A0C4DGU2 |
Top |
Malignant transformation analysis |
| Identification of the aberrant gene expression in precancerous and cancerous lesions by comparing the gene expression of stem-like cells in diseased tissues with normal stem cells |
| Entrez ID | Symbol | Replicates | Species | Organ | Tissue | Adj P-value | Log2FC | Malignancy |
| 25974 | MMACHC | LZE4T | Human | Esophagus | ESCC | 1.15e-04 | 2.80e-01 | 0.0811 |
| 25974 | MMACHC | LZE7T | Human | Esophagus | ESCC | 1.16e-02 | 2.21e-01 | 0.0667 |
| 25974 | MMACHC | LZE24T | Human | Esophagus | ESCC | 1.65e-03 | 1.33e-01 | 0.0596 |
| 25974 | MMACHC | P2T-E | Human | Esophagus | ESCC | 1.96e-05 | 1.02e-01 | 0.1177 |
| 25974 | MMACHC | P4T-E | Human | Esophagus | ESCC | 2.22e-03 | 8.46e-02 | 0.1323 |
| 25974 | MMACHC | P5T-E | Human | Esophagus | ESCC | 7.90e-03 | 9.04e-02 | 0.1327 |
| 25974 | MMACHC | P9T-E | Human | Esophagus | ESCC | 1.44e-02 | 5.59e-02 | 0.1131 |
| 25974 | MMACHC | P10T-E | Human | Esophagus | ESCC | 1.66e-02 | 7.29e-02 | 0.116 |
| 25974 | MMACHC | P11T-E | Human | Esophagus | ESCC | 3.34e-03 | 1.21e-01 | 0.1426 |
| 25974 | MMACHC | P12T-E | Human | Esophagus | ESCC | 7.90e-03 | 9.16e-02 | 0.1122 |
| 25974 | MMACHC | P15T-E | Human | Esophagus | ESCC | 1.98e-05 | 1.82e-01 | 0.1149 |
| 25974 | MMACHC | P17T-E | Human | Esophagus | ESCC | 2.78e-04 | 1.80e-01 | 0.1278 |
| 25974 | MMACHC | P20T-E | Human | Esophagus | ESCC | 1.43e-09 | 2.04e-01 | 0.1124 |
| 25974 | MMACHC | P21T-E | Human | Esophagus | ESCC | 9.02e-11 | 2.94e-01 | 0.1617 |
| 25974 | MMACHC | P22T-E | Human | Esophagus | ESCC | 1.78e-03 | 9.67e-02 | 0.1236 |
| 25974 | MMACHC | P23T-E | Human | Esophagus | ESCC | 1.52e-02 | 1.09e-01 | 0.108 |
| 25974 | MMACHC | P27T-E | Human | Esophagus | ESCC | 1.78e-03 | 1.21e-01 | 0.1055 |
| 25974 | MMACHC | P28T-E | Human | Esophagus | ESCC | 6.40e-04 | 6.99e-02 | 0.1149 |
| 25974 | MMACHC | P30T-E | Human | Esophagus | ESCC | 3.07e-03 | 1.09e-01 | 0.137 |
| 25974 | MMACHC | P31T-E | Human | Esophagus | ESCC | 8.40e-04 | 1.24e-01 | 0.1251 |
| Page: 1 2 |
| Tissue | Expression Dynamics | Abbreviation |
| Esophagus | 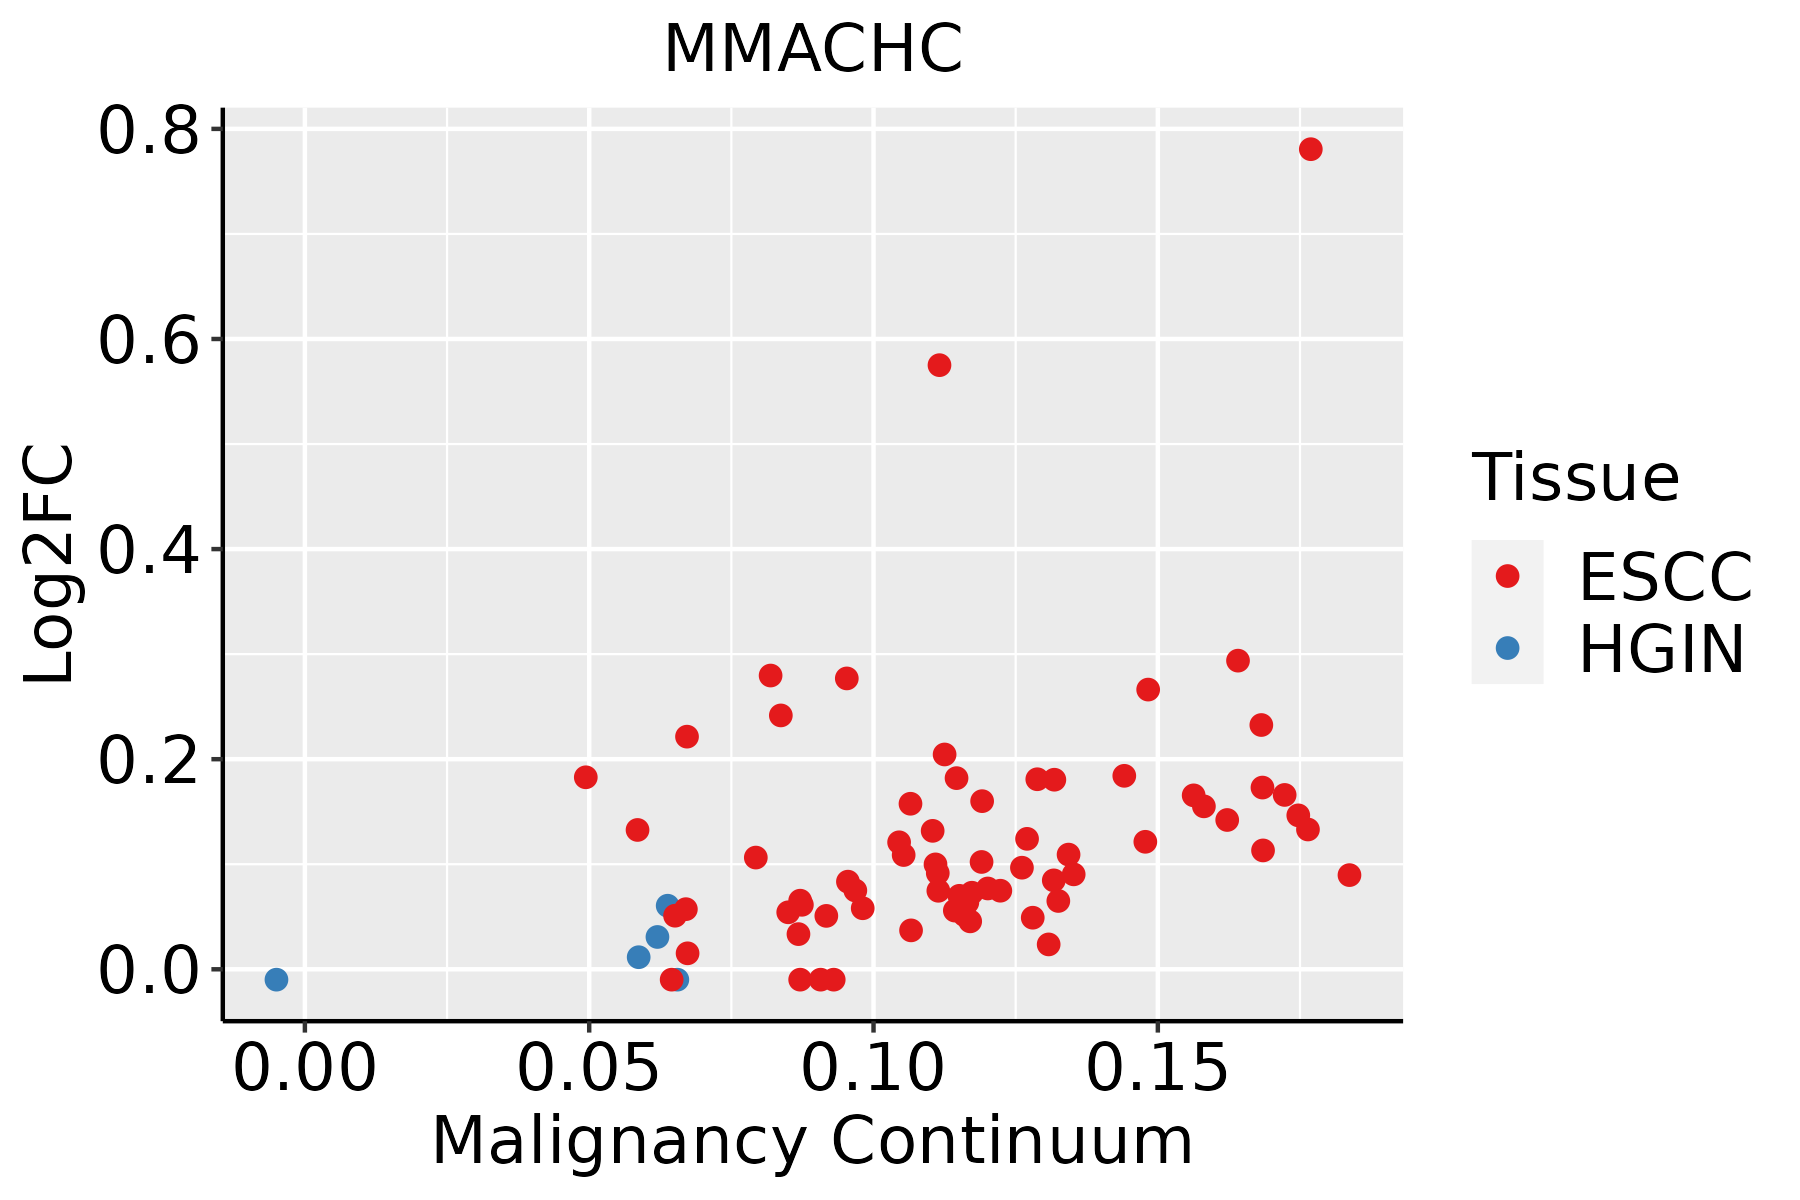 | ESCC: Esophageal squamous cell carcinoma |
| HGIN: High-grade intraepithelial neoplasias | ||
| LGIN: Low-grade intraepithelial neoplasias |
| ∗log2FC in expression of this searched gene in stem-like cells from each diseased tissue sample relative to stem-like cells in normal samples in each tissue plotted against the malignancy continuum. Samples are colored based on if they are from different disease stage. |
Top |
Malignant transformation related pathway analysis |
| Find out the enriched GO biological processes and KEGG pathways involved in transition from healthy to precancer to cancer |
| Tissue | Disease Stage | Enriched GO biological Processes |
| Colorectum | AD |  |
| Colorectum | SER |  |
| Colorectum | MSS |  |
| Colorectum | MSI-H |  |
| Colorectum | FAP |  |
| ∗Top 15 enriched GO BP terms are showed in the bar plot of each disease state in each tissue. Each row represents a significant GO biological process which is colored according to the -log10(p.adjust). |
| Page: 1 2 3 4 5 6 7 8 9 |
| GO ID | Tissue | Disease Stage | Description | Gene Ratio | Bg Ratio | pvalue | p.adjust | Count |
| GO:00067906 | Esophagus | ESCC | sulfur compound metabolic process | 201/8552 | 339/18723 | 2.64e-07 | 3.94e-06 | 201 |
| GO:00065757 | Esophagus | ESCC | cellular modified amino acid metabolic process | 112/8552 | 188/18723 | 8.31e-05 | 6.06e-04 | 112 |
| GO:00067671 | Esophagus | ESCC | water-soluble vitamin metabolic process | 41/8552 | 59/18723 | 1.84e-04 | 1.17e-03 | 41 |
| GO:00067661 | Esophagus | ESCC | vitamin metabolic process | 67/8552 | 106/18723 | 2.03e-04 | 1.28e-03 | 67 |
| GO:000674912 | Esophagus | ESCC | glutathione metabolic process | 42/8552 | 64/18723 | 1.01e-03 | 5.12e-03 | 42 |
| GO:00330132 | Esophagus | ESCC | tetrapyrrole metabolic process | 37/8552 | 59/18723 | 6.23e-03 | 2.29e-02 | 37 |
| Page: 1 |
| Pathway ID | Tissue | Disease Stage | Description | Gene Ratio | Bg Ratio | pvalue | p.adjust | qvalue | Count |
| Page: 1 |
Top |
Cell-cell communication analysis |
| Identification of potential cell-cell interactions between two cell types and their ligand-receptor pairs for different disease states |
| Ligand | Receptor | LRpair | Pathway | Tissue | Disease Stage |
| Page: 1 |
Top |
Single-cell gene regulatory network inference analysis |
| Find out the significant the regulons (TFs) and the target genes of each regulon across cell types for different disease states |
| TF | Cell Type | Tissue | Disease Stage | Target Gene | RSS | Regulon Activity |
| ∗The dot plots of a searched regulon are shown for all cell subpopulations in each disease state of each tissue based on the regulon specific score inferred using pySCENIC and by calculating the average expression. |
| Page: 1 |
Top |
Somatic mutation of malignant transformation related genes |
| Annotation of somatic variants for genes involved in malignant transformation |
| Hugo Symbol | Variant Class | Variant Classification | dbSNP RS | HGVSc | HGVSp | HGVSp Short | SWISSPROT | BIOTYPE | SIFT | PolyPhen | Tumor Sample Barcode | Tissue | Histology | Sex | Age | Stage | Therapy Types | Drugs | Outcome |
| MMACHC | SNV | Missense_Mutation | rs766500038 | c.49T>C | p.Cys17Arg | p.C17R | Q9Y4U1 | protein_coding | tolerated(0.47) | benign(0.11) | TCGA-BH-A0W5-01 | Breast | breast invasive carcinoma | Female | >=65 | I/II | Hormone Therapy | arimidex | CR |
| MMACHC | insertion | Frame_Shift_Ins | novel | c.77_78insTCCTACCTGGGAAATGGAGTCGAAGCTGACTCAAAACGTAA | p.Gln27ProfsTer63 | p.Q27Pfs*63 | Q9Y4U1 | protein_coding | TCGA-A8-A0A4-01 | Breast | breast invasive carcinoma | Female | >=65 | I/II | Hormone Therapy | tamoxiphen | CR | ||
| MMACHC | deletion | Frame_Shift_Del | novel | c.517delG | p.Asp173IlefsTer37 | p.D173Ifs*37 | Q9Y4U1 | protein_coding | TCGA-EW-A2FV-01 | Breast | breast invasive carcinoma | Female | <65 | III/IV | Chemotherapy | docetaxel | SD | ||
| MMACHC | SNV | Missense_Mutation | c.778C>T | p.Pro260Ser | p.P260S | Q9Y4U1 | protein_coding | tolerated_low_confidence(0.06) | benign(0.007) | TCGA-A6-5665-01 | Colorectum | colon adenocarcinoma | Female | >=65 | I/II | Unknown | Unknown | PD | |
| MMACHC | SNV | Missense_Mutation | rs371004372 | c.53N>A | p.Pro18His | p.P18H | Q9Y4U1 | protein_coding | deleterious(0) | possibly_damaging(0.811) | TCGA-CA-6717-01 | Colorectum | colon adenocarcinoma | Male | <65 | I/II | Chemotherapy | oxaliplatin | CR |
| MMACHC | SNV | Missense_Mutation | c.166N>T | p.Pro56Ser | p.P56S | Q9Y4U1 | protein_coding | deleterious(0) | probably_damaging(0.995) | TCGA-G4-6588-01 | Colorectum | colon adenocarcinoma | Female | <65 | I/II | Unknown | Unknown | SD | |
| MMACHC | SNV | Missense_Mutation | rs187869948 | c.334N>T | p.Arg112Cys | p.R112C | Q9Y4U1 | protein_coding | deleterious(0) | probably_damaging(0.997) | TCGA-NH-A5IV-01 | Colorectum | colon adenocarcinoma | Female | >=65 | I/II | Unknown | Unknown | SD |
| MMACHC | SNV | Missense_Mutation | rs371004372 | c.53C>A | p.Pro18His | p.P18H | Q9Y4U1 | protein_coding | deleterious(0) | possibly_damaging(0.811) | TCGA-F5-6814-01 | Colorectum | rectum adenocarcinoma | Male | <65 | I/II | Unknown | Unknown | SD |
| MMACHC | SNV | Missense_Mutation | rs775502093 | c.145N>A | p.Ala49Thr | p.A49T | Q9Y4U1 | protein_coding | deleterious(0) | probably_damaging(0.971) | TCGA-A5-A0G2-01 | Endometrium | uterine corpus endometrioid carcinoma | Female | <65 | III/IV | Unknown | Unknown | SD |
| MMACHC | SNV | Missense_Mutation | novel | c.560N>A | p.Ala187Asp | p.A187D | Q9Y4U1 | protein_coding | tolerated(0.27) | benign(0) | TCGA-A5-A0G2-01 | Endometrium | uterine corpus endometrioid carcinoma | Female | <65 | III/IV | Unknown | Unknown | SD |
| Page: 1 2 3 |
Top |
Related drugs of malignant transformation related genes |
| Identification of chemicals and drugs interact with genes involved in malignant transfromation |
| (DGIdb 4.0) |
| Entrez ID | Symbol | Category | Interaction Types | Drug Claim Name | Drug Name | PMIDs |
| Page: 1 |

Copyright 2023-Present -The University of Texas Health Science Center at Houston |