
|
|||||
|
 | |
| |
| |
| |
| |
| |
|
Gene: MLST8 |
Gene summary for MLST8 |
| Gene information | Species | Human | Gene symbol | MLST8 | Gene ID | 64223 |
| Gene name | MTOR associated protein, LST8 homolog | |
| Gene Alias | GBL | |
| Cytomap | 16p13.3 | |
| Gene Type | protein-coding | GO ID | GO:0001932 | UniProtAcc | Q9BVC4 |
Top |
Malignant transformation analysis |
| Identification of the aberrant gene expression in precancerous and cancerous lesions by comparing the gene expression of stem-like cells in diseased tissues with normal stem cells |
| Entrez ID | Symbol | Replicates | Species | Organ | Tissue | Adj P-value | Log2FC | Malignancy |
| 64223 | MLST8 | LZE4T | Human | Esophagus | ESCC | 2.37e-06 | 1.68e-01 | 0.0811 |
| 64223 | MLST8 | LZE7T | Human | Esophagus | ESCC | 3.10e-07 | 4.08e-01 | 0.0667 |
| 64223 | MLST8 | LZE8T | Human | Esophagus | ESCC | 2.15e-14 | 2.34e-01 | 0.067 |
| 64223 | MLST8 | LZE20T | Human | Esophagus | ESCC | 1.16e-08 | 2.59e-01 | 0.0662 |
| 64223 | MLST8 | LZE22T | Human | Esophagus | ESCC | 4.40e-06 | 4.79e-01 | 0.068 |
| 64223 | MLST8 | LZE24T | Human | Esophagus | ESCC | 9.57e-15 | 3.78e-01 | 0.0596 |
| 64223 | MLST8 | LZE21T | Human | Esophagus | ESCC | 2.25e-05 | 2.39e-01 | 0.0655 |
| 64223 | MLST8 | LZE6T | Human | Esophagus | ESCC | 3.92e-03 | 1.52e-01 | 0.0845 |
| 64223 | MLST8 | P1T-E | Human | Esophagus | ESCC | 1.87e-17 | 5.73e-01 | 0.0875 |
| 64223 | MLST8 | P2T-E | Human | Esophagus | ESCC | 6.02e-67 | 1.20e+00 | 0.1177 |
| 64223 | MLST8 | P4T-E | Human | Esophagus | ESCC | 2.32e-51 | 1.16e+00 | 0.1323 |
| 64223 | MLST8 | P5T-E | Human | Esophagus | ESCC | 4.80e-25 | 4.72e-01 | 0.1327 |
| 64223 | MLST8 | P8T-E | Human | Esophagus | ESCC | 1.62e-28 | 5.13e-01 | 0.0889 |
| 64223 | MLST8 | P9T-E | Human | Esophagus | ESCC | 1.70e-16 | 2.90e-01 | 0.1131 |
| 64223 | MLST8 | P10T-E | Human | Esophagus | ESCC | 9.54e-33 | 5.09e-01 | 0.116 |
| 64223 | MLST8 | P11T-E | Human | Esophagus | ESCC | 7.46e-16 | 6.43e-01 | 0.1426 |
| 64223 | MLST8 | P12T-E | Human | Esophagus | ESCC | 5.38e-43 | 9.07e-01 | 0.1122 |
| 64223 | MLST8 | P15T-E | Human | Esophagus | ESCC | 7.32e-29 | 6.03e-01 | 0.1149 |
| 64223 | MLST8 | P16T-E | Human | Esophagus | ESCC | 3.26e-26 | 4.97e-01 | 0.1153 |
| 64223 | MLST8 | P17T-E | Human | Esophagus | ESCC | 9.88e-20 | 6.98e-01 | 0.1278 |
| Page: 1 2 3 4 5 6 |
| Tissue | Expression Dynamics | Abbreviation |
| Esophagus |  | ESCC: Esophageal squamous cell carcinoma |
| HGIN: High-grade intraepithelial neoplasias | ||
| LGIN: Low-grade intraepithelial neoplasias | ||
| Liver | 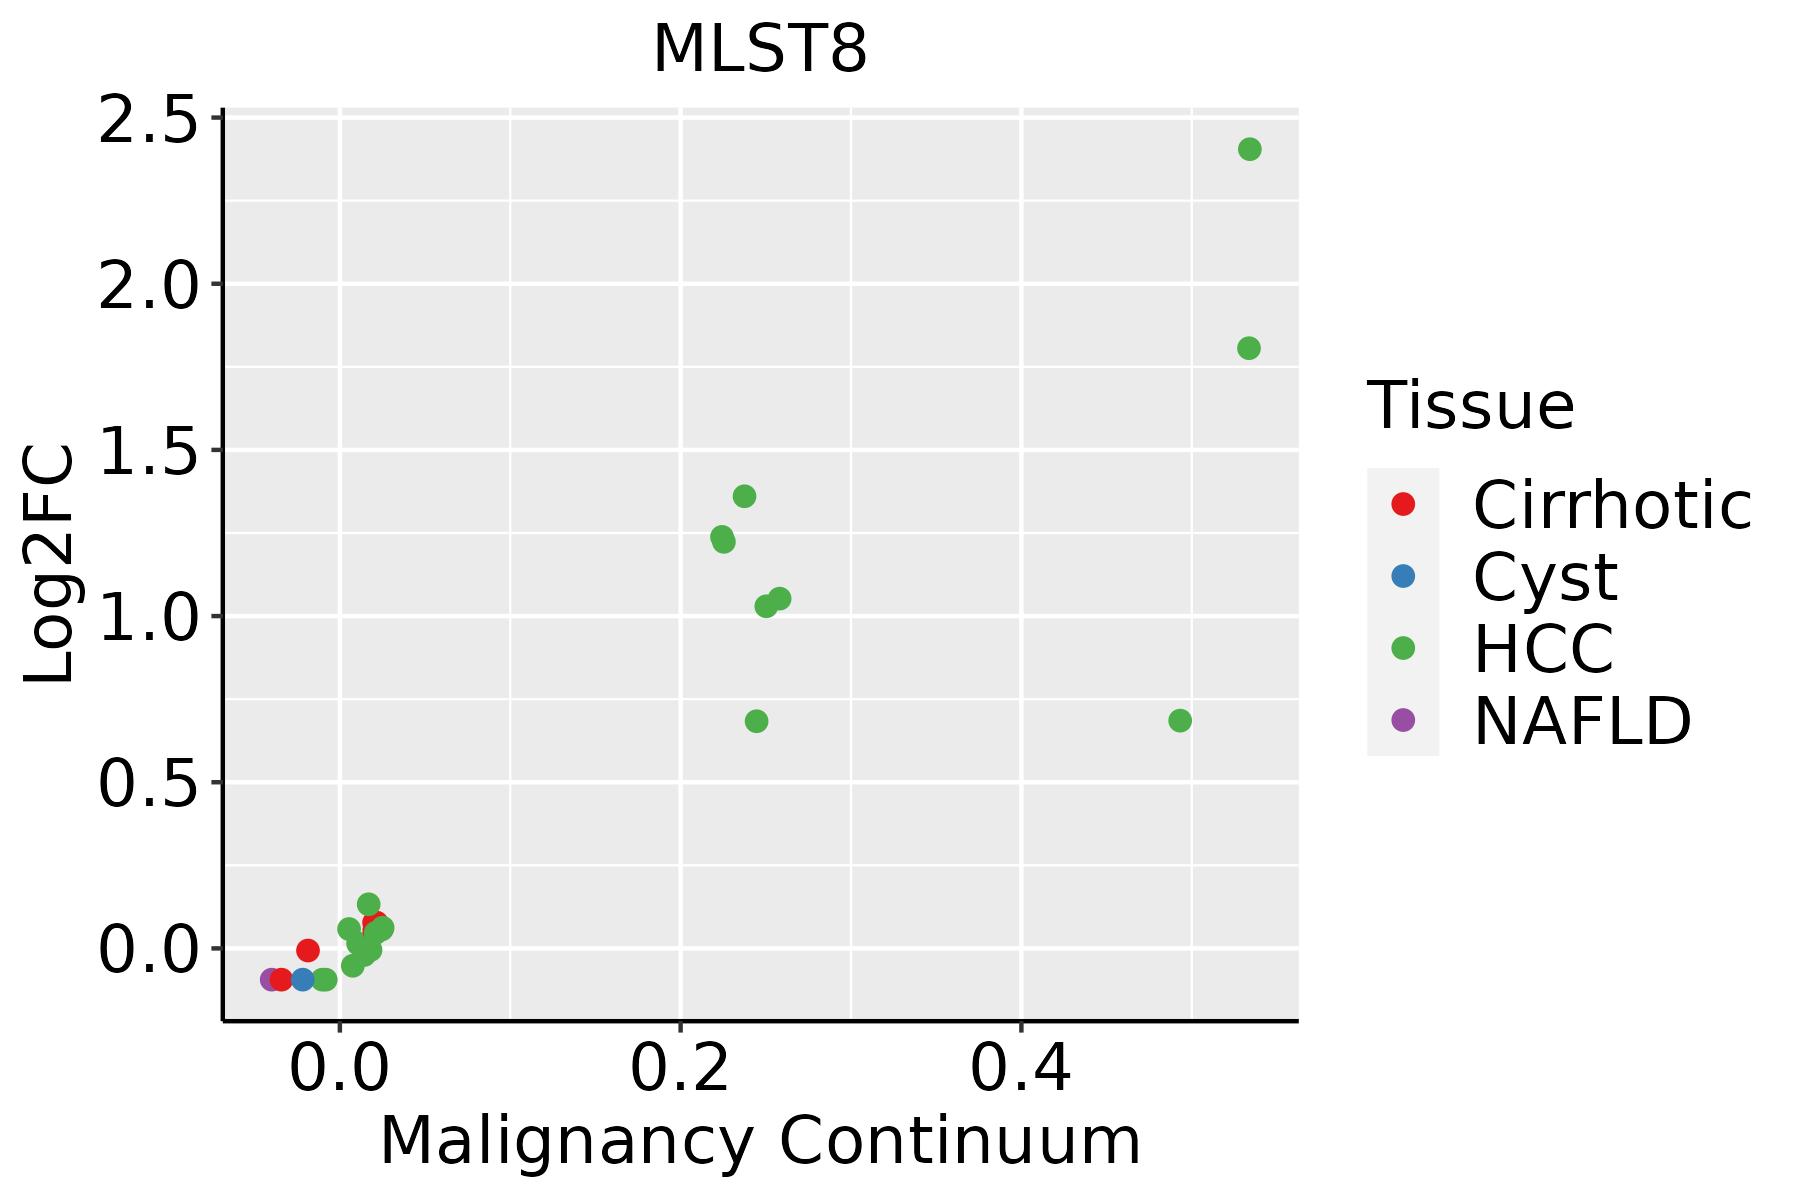 | HCC: Hepatocellular carcinoma |
| NAFLD: Non-alcoholic fatty liver disease | ||
| Oral Cavity |  | EOLP: Erosive Oral lichen planus |
| LP: leukoplakia | ||
| NEOLP: Non-erosive oral lichen planus | ||
| OSCC: Oral squamous cell carcinoma | ||
| Skin | 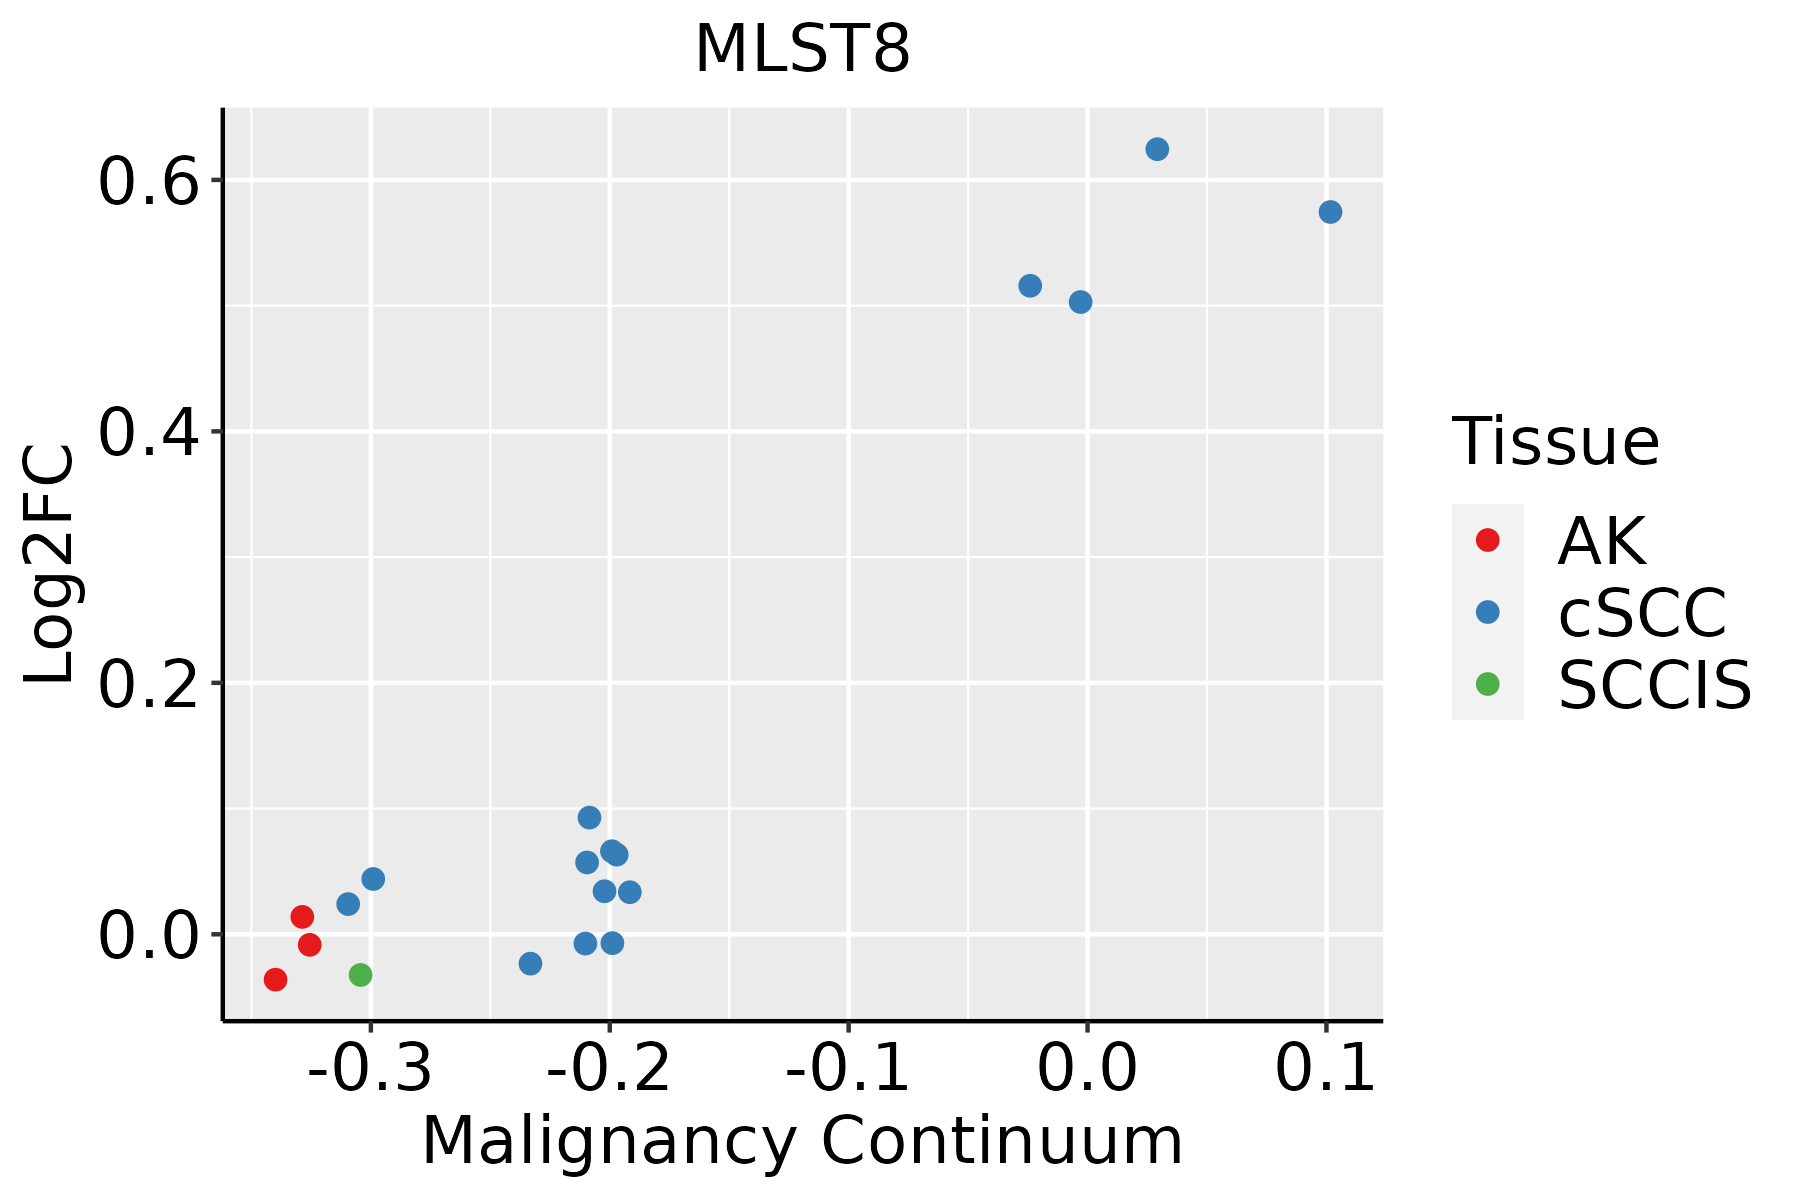 | AK: Actinic keratosis |
| cSCC: Cutaneous squamous cell carcinoma | ||
| SCCIS:squamous cell carcinoma in situ |
| ∗log2FC in expression of this searched gene in stem-like cells from each diseased tissue sample relative to stem-like cells in normal samples in each tissue plotted against the malignancy continuum. Samples are colored based on if they are from different disease stage. |
Top |
Malignant transformation related pathway analysis |
| Find out the enriched GO biological processes and KEGG pathways involved in transition from healthy to precancer to cancer |
| Tissue | Disease Stage | Enriched GO biological Processes |
| Colorectum | AD |  |
| Colorectum | SER |  |
| Colorectum | MSS |  |
| Colorectum | MSI-H |  |
| Colorectum | FAP |  |
| ∗Top 15 enriched GO BP terms are showed in the bar plot of each disease state in each tissue. Each row represents a significant GO biological process which is colored according to the -log10(p.adjust). |
| Page: 1 2 3 4 5 6 7 8 9 |
| GO ID | Tissue | Disease Stage | Description | Gene Ratio | Bg Ratio | pvalue | p.adjust | Count |
| GO:0043254111 | Esophagus | ESCC | regulation of protein-containing complex assembly | 278/8552 | 428/18723 | 3.81e-16 | 2.77e-14 | 278 |
| GO:0031334111 | Esophagus | ESCC | positive regulation of protein-containing complex assembly | 166/8552 | 237/18723 | 2.06e-14 | 1.07e-12 | 166 |
| GO:007190016 | Esophagus | ESCC | regulation of protein serine/threonine kinase activity | 227/8552 | 359/18723 | 1.12e-11 | 4.10e-10 | 227 |
| GO:1902905111 | Esophagus | ESCC | positive regulation of supramolecular fiber organization | 142/8552 | 209/18723 | 5.51e-11 | 1.76e-09 | 142 |
| GO:1902903111 | Esophagus | ESCC | regulation of supramolecular fiber organization | 237/8552 | 383/18723 | 9.06e-11 | 2.75e-09 | 237 |
| GO:005149520 | Esophagus | ESCC | positive regulation of cytoskeleton organization | 147/8552 | 226/18723 | 2.93e-09 | 6.38e-08 | 147 |
| GO:0051258111 | Esophagus | ESCC | protein polymerization | 183/8552 | 297/18723 | 1.94e-08 | 3.75e-07 | 183 |
| GO:000701527 | Esophagus | ESCC | actin filament organization | 259/8552 | 442/18723 | 2.37e-08 | 4.50e-07 | 259 |
| GO:0032273111 | Esophagus | ESCC | positive regulation of protein polymerization | 95/8552 | 138/18723 | 2.97e-08 | 5.57e-07 | 95 |
| GO:003253520 | Esophagus | ESCC | regulation of cellular component size | 227/8552 | 383/18723 | 4.77e-08 | 8.60e-07 | 227 |
| GO:0032970111 | Esophagus | ESCC | regulation of actin filament-based process | 231/8552 | 397/18723 | 2.91e-07 | 4.20e-06 | 231 |
| GO:0032956111 | Esophagus | ESCC | regulation of actin cytoskeleton organization | 210/8552 | 358/18723 | 4.40e-07 | 6.00e-06 | 210 |
| GO:0032271111 | Esophagus | ESCC | regulation of protein polymerization | 143/8552 | 233/18723 | 9.21e-07 | 1.17e-05 | 143 |
| GO:011005327 | Esophagus | ESCC | regulation of actin filament organization | 166/8552 | 278/18723 | 1.54e-06 | 1.85e-05 | 166 |
| GO:00719029 | Esophagus | ESCC | positive regulation of protein serine/threonine kinase activity | 124/8552 | 200/18723 | 2.27e-06 | 2.61e-05 | 124 |
| GO:004586018 | Esophagus | ESCC | positive regulation of protein kinase activity | 219/8552 | 386/18723 | 6.91e-06 | 6.97e-05 | 219 |
| GO:003367420 | Esophagus | ESCC | positive regulation of kinase activity | 260/8552 | 467/18723 | 7.26e-06 | 7.22e-05 | 260 |
| GO:003083819 | Esophagus | ESCC | positive regulation of actin filament polymerization | 66/8552 | 99/18723 | 1.96e-05 | 1.72e-04 | 66 |
| GO:000815420 | Esophagus | ESCC | actin polymerization or depolymerization | 130/8552 | 218/18723 | 2.19e-05 | 1.88e-04 | 130 |
| GO:0030041110 | Esophagus | ESCC | actin filament polymerization | 114/8552 | 191/18723 | 6.46e-05 | 4.92e-04 | 114 |
| Page: 1 2 3 4 5 6 7 8 |
| Pathway ID | Tissue | Disease Stage | Description | Gene Ratio | Bg Ratio | pvalue | p.adjust | qvalue | Count |
| hsa04714211 | Esophagus | ESCC | Thermogenesis | 163/4205 | 232/8465 | 9.22e-11 | 1.14e-09 | 5.86e-10 | 163 |
| hsa0414010 | Esophagus | ESCC | Autophagy - animal | 101/4205 | 141/8465 | 7.60e-08 | 6.21e-07 | 3.18e-07 | 101 |
| hsa041505 | Esophagus | ESCC | mTOR signaling pathway | 98/4205 | 156/8465 | 5.81e-04 | 1.95e-03 | 9.97e-04 | 98 |
| hsa041362 | Esophagus | ESCC | Autophagy - other | 23/4205 | 32/8465 | 8.99e-03 | 2.14e-02 | 1.09e-02 | 23 |
| hsa041517 | Esophagus | ESCC | PI3K-Akt signaling pathway | 197/4205 | 354/8465 | 1.24e-02 | 2.83e-02 | 1.45e-02 | 197 |
| hsa04714310 | Esophagus | ESCC | Thermogenesis | 163/4205 | 232/8465 | 9.22e-11 | 1.14e-09 | 5.86e-10 | 163 |
| hsa0414015 | Esophagus | ESCC | Autophagy - animal | 101/4205 | 141/8465 | 7.60e-08 | 6.21e-07 | 3.18e-07 | 101 |
| hsa0415013 | Esophagus | ESCC | mTOR signaling pathway | 98/4205 | 156/8465 | 5.81e-04 | 1.95e-03 | 9.97e-04 | 98 |
| hsa0413611 | Esophagus | ESCC | Autophagy - other | 23/4205 | 32/8465 | 8.99e-03 | 2.14e-02 | 1.09e-02 | 23 |
| hsa0415114 | Esophagus | ESCC | PI3K-Akt signaling pathway | 197/4205 | 354/8465 | 1.24e-02 | 2.83e-02 | 1.45e-02 | 197 |
| hsa0471414 | Liver | Cirrhotic | Thermogenesis | 121/2530 | 232/8465 | 5.70e-13 | 1.36e-11 | 8.36e-12 | 121 |
| hsa041406 | Liver | Cirrhotic | Autophagy - animal | 65/2530 | 141/8465 | 3.10e-05 | 2.47e-04 | 1.52e-04 | 65 |
| hsa0471415 | Liver | Cirrhotic | Thermogenesis | 121/2530 | 232/8465 | 5.70e-13 | 1.36e-11 | 8.36e-12 | 121 |
| hsa0414011 | Liver | Cirrhotic | Autophagy - animal | 65/2530 | 141/8465 | 3.10e-05 | 2.47e-04 | 1.52e-04 | 65 |
| hsa0471422 | Liver | HCC | Thermogenesis | 170/4020 | 232/8465 | 5.36e-16 | 2.25e-14 | 1.25e-14 | 170 |
| hsa0414021 | Liver | HCC | Autophagy - animal | 99/4020 | 141/8465 | 3.08e-08 | 4.70e-07 | 2.61e-07 | 99 |
| hsa041502 | Liver | HCC | mTOR signaling pathway | 95/4020 | 156/8465 | 4.70e-04 | 1.99e-03 | 1.11e-03 | 95 |
| hsa0471432 | Liver | HCC | Thermogenesis | 170/4020 | 232/8465 | 5.36e-16 | 2.25e-14 | 1.25e-14 | 170 |
| hsa0414031 | Liver | HCC | Autophagy - animal | 99/4020 | 141/8465 | 3.08e-08 | 4.70e-07 | 2.61e-07 | 99 |
| hsa0415011 | Liver | HCC | mTOR signaling pathway | 95/4020 | 156/8465 | 4.70e-04 | 1.99e-03 | 1.11e-03 | 95 |
| Page: 1 2 |
Top |
Cell-cell communication analysis |
| Identification of potential cell-cell interactions between two cell types and their ligand-receptor pairs for different disease states |
| Ligand | Receptor | LRpair | Pathway | Tissue | Disease Stage |
| Page: 1 |
Top |
Single-cell gene regulatory network inference analysis |
| Find out the significant the regulons (TFs) and the target genes of each regulon across cell types for different disease states |
| TF | Cell Type | Tissue | Disease Stage | Target Gene | RSS | Regulon Activity |
| ∗The dot plots of a searched regulon are shown for all cell subpopulations in each disease state of each tissue based on the regulon specific score inferred using pySCENIC and by calculating the average expression. |
| Page: 1 |
Top |
Somatic mutation of malignant transformation related genes |
| Annotation of somatic variants for genes involved in malignant transformation |
| Hugo Symbol | Variant Class | Variant Classification | dbSNP RS | HGVSc | HGVSp | HGVSp Short | SWISSPROT | BIOTYPE | SIFT | PolyPhen | Tumor Sample Barcode | Tissue | Histology | Sex | Age | Stage | Therapy Types | Drugs | Outcome |
| MLST8 | SNV | Missense_Mutation | novel | c.706N>A | p.Ala236Thr | p.A236T | Q9BVC4 | protein_coding | deleterious(0.02) | probably_damaging(0.968) | TCGA-EA-A3HS-01 | Cervix | cervical & endocervical cancer | Female | <65 | I/II | Unknown | Unknown | SD |
| MLST8 | insertion | Frame_Shift_Ins | novel | c.421_422insGCTGCATCTGTTACCGCCCTGAGGAGCAC | p.Ala141GlyfsTer27 | p.A141Gfs*27 | Q9BVC4 | protein_coding | TCGA-DS-A1OA-01 | Cervix | cervical & endocervical cancer | Female | >=65 | I/II | Chemotherapy | carboplatin | PD | ||
| MLST8 | SNV | Missense_Mutation | c.161N>A | p.Arg54His | p.R54H | Q9BVC4 | protein_coding | deleterious(0) | possibly_damaging(0.772) | TCGA-AU-6004-01 | Colorectum | colon adenocarcinoma | Female | >=65 | I/II | Unknown | Unknown | SD | |
| MLST8 | SNV | Missense_Mutation | c.258N>T | p.Lys86Asn | p.K86N | Q9BVC4 | protein_coding | tolerated(0.22) | possibly_damaging(0.772) | TCGA-AG-A002-01 | Colorectum | rectum adenocarcinoma | Male | <65 | I/II | Unknown | Unknown | SD | |
| MLST8 | SNV | Missense_Mutation | novel | c.556N>A | p.Ala186Thr | p.A186T | Q9BVC4 | protein_coding | deleterious(0.01) | possibly_damaging(0.625) | TCGA-A5-A0G1-01 | Endometrium | uterine corpus endometrioid carcinoma | Female | >=65 | I/II | Unknown | Unknown | SD |
| MLST8 | SNV | Missense_Mutation | novel | c.46N>A | p.Ala16Thr | p.A16T | Q9BVC4 | protein_coding | deleterious(0.01) | probably_damaging(0.946) | TCGA-AJ-A3EK-01 | Endometrium | uterine corpus endometrioid carcinoma | Female | <65 | I/II | Chemotherapy | carboplatin | CR |
| MLST8 | SNV | Missense_Mutation | c.258G>T | p.Lys86Asn | p.K86N | Q9BVC4 | protein_coding | tolerated(0.22) | possibly_damaging(0.772) | TCGA-AP-A1DV-01 | Endometrium | uterine corpus endometrioid carcinoma | Female | <65 | I/II | Unknown | Unknown | SD | |
| MLST8 | SNV | Missense_Mutation | novel | c.691G>A | p.Asp231Asn | p.D231N | Q9BVC4 | protein_coding | deleterious(0.02) | possibly_damaging(0.895) | TCGA-AP-A1DV-01 | Endometrium | uterine corpus endometrioid carcinoma | Female | <65 | I/II | Unknown | Unknown | SD |
| MLST8 | SNV | Missense_Mutation | rs774913271 | c.661N>T | p.Arg221Cys | p.R221C | Q9BVC4 | protein_coding | deleterious(0) | probably_damaging(0.939) | TCGA-B5-A3FC-01 | Endometrium | uterine corpus endometrioid carcinoma | Female | <65 | I/II | Unknown | Unknown | SD |
| MLST8 | SNV | Missense_Mutation | c.743G>T | p.Arg248Met | p.R248M | Q9BVC4 | protein_coding | deleterious(0.01) | possibly_damaging(0.905) | TCGA-D1-A103-01 | Endometrium | uterine corpus endometrioid carcinoma | Female | >=65 | I/II | Unknown | Unknown | SD |
| Page: 1 2 3 |
Top |
Related drugs of malignant transformation related genes |
| Identification of chemicals and drugs interact with genes involved in malignant transfromation |
| (DGIdb 4.0) |
| Entrez ID | Symbol | Category | Interaction Types | Drug Claim Name | Drug Name | PMIDs |
| 64223 | MLST8 | KINASE | inhibitor | AZD8055 | AZD-8055 | |
| 64223 | MLST8 | KINASE | inhibitor | MLN0128 | SAPANISERTIB | |
| 64223 | MLST8 | KINASE | inhibitor | OSI-027 | OSI-027 |
| Page: 1 |

Copyright 2023-Present -The University of Texas Health Science Center at Houston |