Schematic overview of the cellular and molecular mechanisms involved in the cancer progression, including the proposed cellular and molecular mechanisms in cancer cells trajectory. AT1: alveolar type 1 cells; AT2: alveolar type 2 cells; AAH: atypical adenomatous hyperplasia; AIS: adenocarcinoma in situ; MIA: minimally invasive adenocarcinoma; IA: invasive adenocarcinoma; EMT: epithelial-mesenchymal transition

Home

Download

Statistics

Help

Contact

Center for Computational Systems Medicine
leaf

Gene summary

leaf

Malignant transformation analysis

leaf

Malignant transformation related pathway analysis

leaf

Cell-cell communication analysis

leaf

Single-cell gene regulatory network inference analysis

leaf

Somatic mutation of malignant transformation related genes

leaf

Related drugs of malignant transformation related genes

Gene: MLLT6

Gene summary for MLLT6

check button Gene summary.

Gene informationSpeciesHuman
Gene symbol

MLLT6

Gene ID

4302

Gene nameMLLT6, PHD finger containing
Gene AliasAF17
Cytomap17q12
Gene Typeprotein-coding
GO ID

GO:0002028

UniProtAcc

A0A087WW39


Top

Malignant transformation analysis

check button Identification of the aberrant gene expression in precancerous and cancerous lesions by comparing the gene expression of stem-like cells in diseased tissues with normal stem cells
check button Malignant transformation involving gene list.
Entrez IDSymbolReplicatesSpeciesOrganTissueAdj P-valueLog2FCMalignancy
4302MLLT6GSM4909290HumanBreastIDC2.04e-449.83e-010.2096
4302MLLT6GSM4909292HumanBreastIDC3.38e-171.08e+000.1236
4302MLLT6GSM4909293HumanBreastIDC4.50e-638.90e-010.1581
4302MLLT6GSM4909296HumanBreastIDC1.89e-03-1.44e-010.1524
4302MLLT6GSM4909311HumanBreastIDC2.75e-09-1.21e-010.1534
4302MLLT6GSM4909312HumanBreastIDC2.14e-02-1.30e-010.1552
4302MLLT6GSM4909319HumanBreastIDC1.13e-10-1.13e-010.1563
4302MLLT6GSM4909321HumanBreastIDC2.29e-04-1.11e-010.1559
4302MLLT6NCCBC5HumanBreastDCIS3.15e-021.05e-010.2046
4302MLLT6P1HumanBreastIDC1.79e-061.06e-010.1527
4302MLLT6DCIS2HumanBreastDCIS2.62e-502.57e-010.0085
4302MLLT6HTA11_1938_2000001011HumanColorectumAD3.65e-023.46e-01-0.0811
4302MLLT6HTA11_1391_2000001011HumanColorectumAD5.58e-096.24e-01-0.059
4302MLLT6HTA11_546_2000001011HumanColorectumAD6.46e-043.95e-01-0.0842
4302MLLT6HTA11_10711_2000001011HumanColorectumAD1.65e-023.45e-010.0338
4302MLLT6HTA11_7696_3000711011HumanColorectumAD4.62e-166.21e-010.0674
4302MLLT6HTA11_99999970781_79442HumanColorectumMSS4.01e-044.19e-010.294
4302MLLT6HTA11_99999965104_69814HumanColorectumMSS1.34e-076.07e-010.281
4302MLLT6HTA11_99999971662_82457HumanColorectumMSS5.92e-217.29e-010.3859
4302MLLT6HTA11_99999973899_84307HumanColorectumMSS1.66e-035.77e-010.2585
Page: 1 2 3 4 5 6 7 8 

check button Transcriptomic changes along malignancy continuum.
TissueExpression DynamicsAbbreviation
BreastThe image shows the transcriptomic changes along malignancy continuum.log2FC in expression of this searched gene in stem-like cells from each diseased tissue sample relative to stem-like cells in normal samples in each tissue plotted against the malignancy continuum. Samples are colored based on if they are from different disease stage.IDC: Invasive ductal carcinoma
DCIS: Ductal carcinoma in situ
Precancer(BRCA1-mut): Precancerous lesion from BRCA1 mutation carriers
Colorectum (GSE201348)The image shows the transcriptomic changes along malignancy continuum.log2FC in expression of this searched gene in stem-like cells from each diseased tissue sample relative to stem-like cells in normal samples in each tissue plotted against the malignancy continuum. Samples are colored based on if they are from different disease stage.
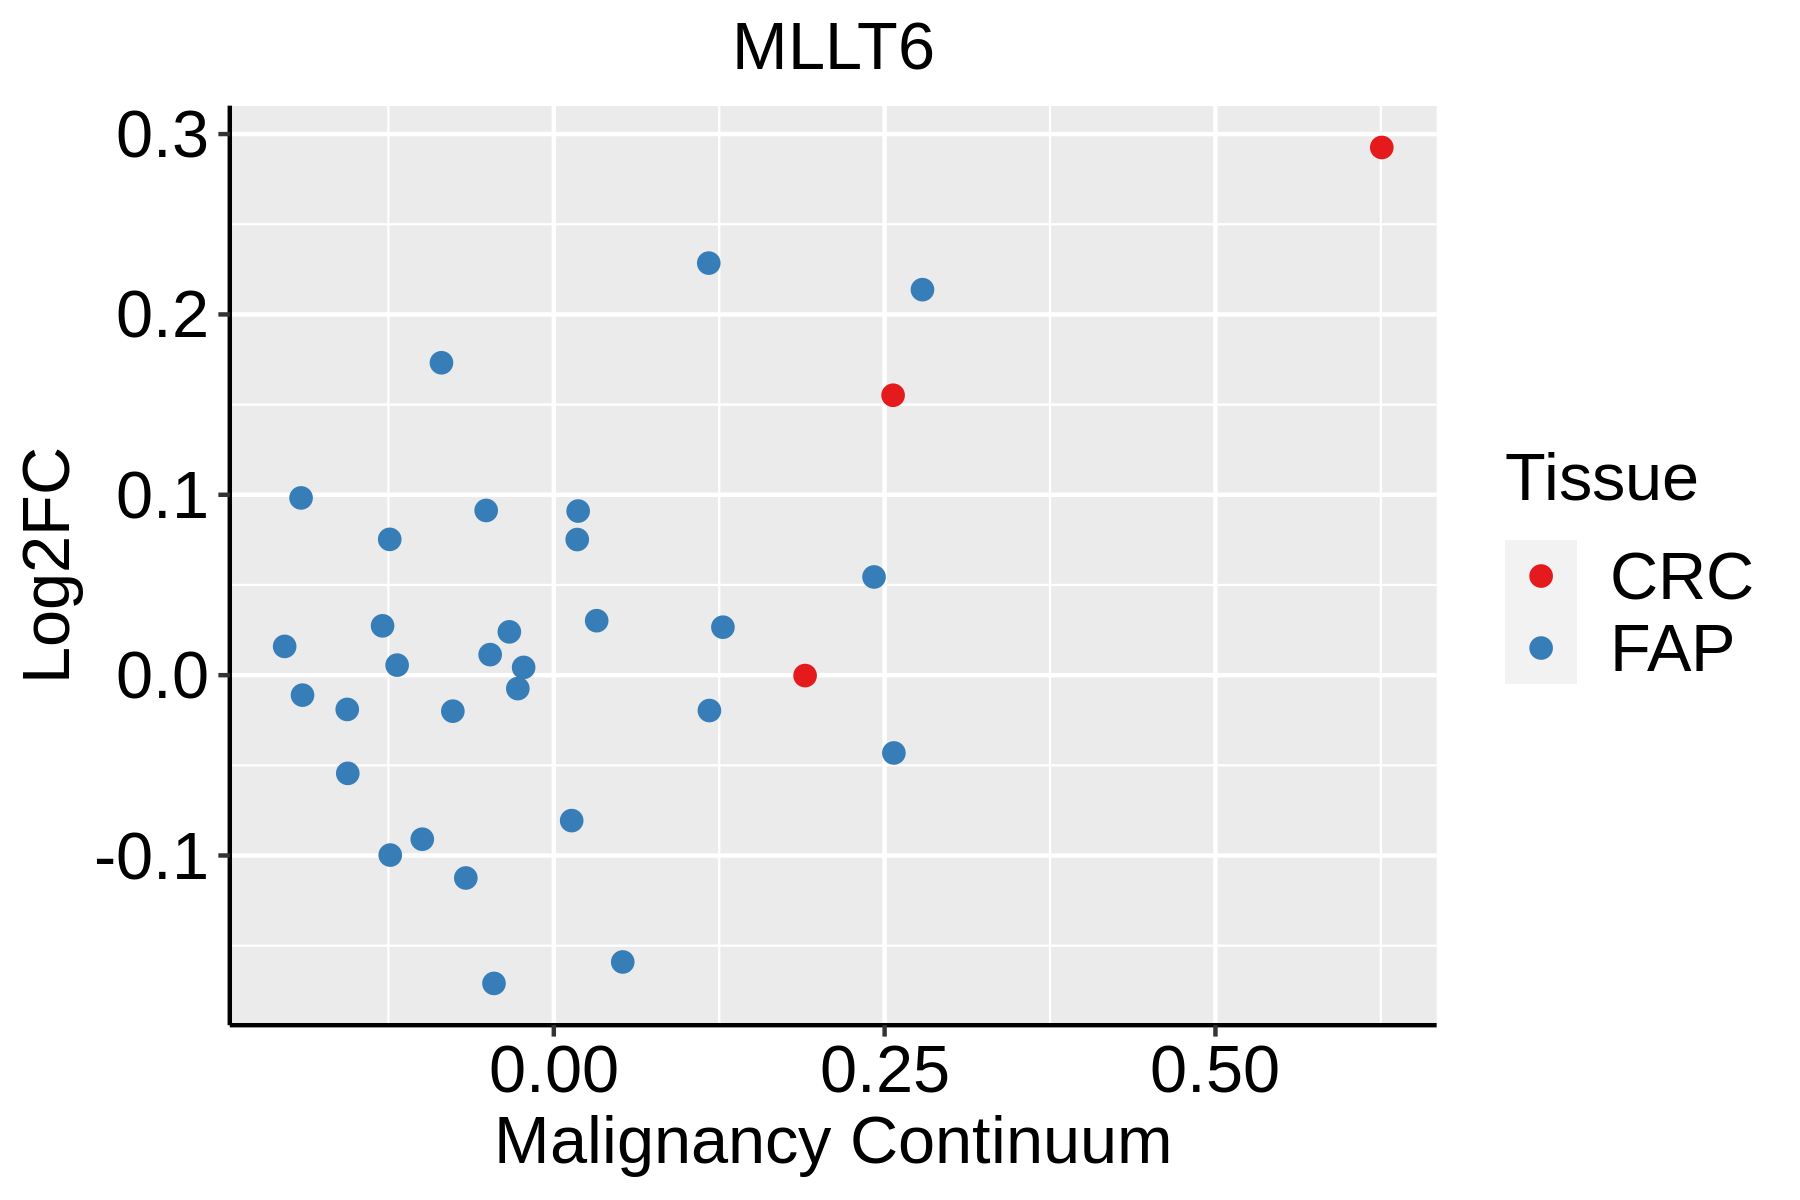
FAP: Familial adenomatous polyposis
CRC: Colorectal cancer
Colorectum (HTA11)The image shows the transcriptomic changes along malignancy continuum.log2FC in expression of this searched gene in stem-like cells from each diseased tissue sample relative to stem-like cells in normal samples in each tissue plotted against the malignancy continuum. Samples are colored based on if they are from different disease stage.AD: Adenomas
SER: Sessile serrated lesions
MSI-H: Microsatellite-high colorectal cancer
MSS: Microsatellite stable colorectal cancer
EsophagusThe image shows the transcriptomic changes along malignancy continuum.log2FC in expression of this searched gene in stem-like cells from each diseased tissue sample relative to stem-like cells in normal samples in each tissue plotted against the malignancy continuum. Samples are colored based on if they are from different disease stage.
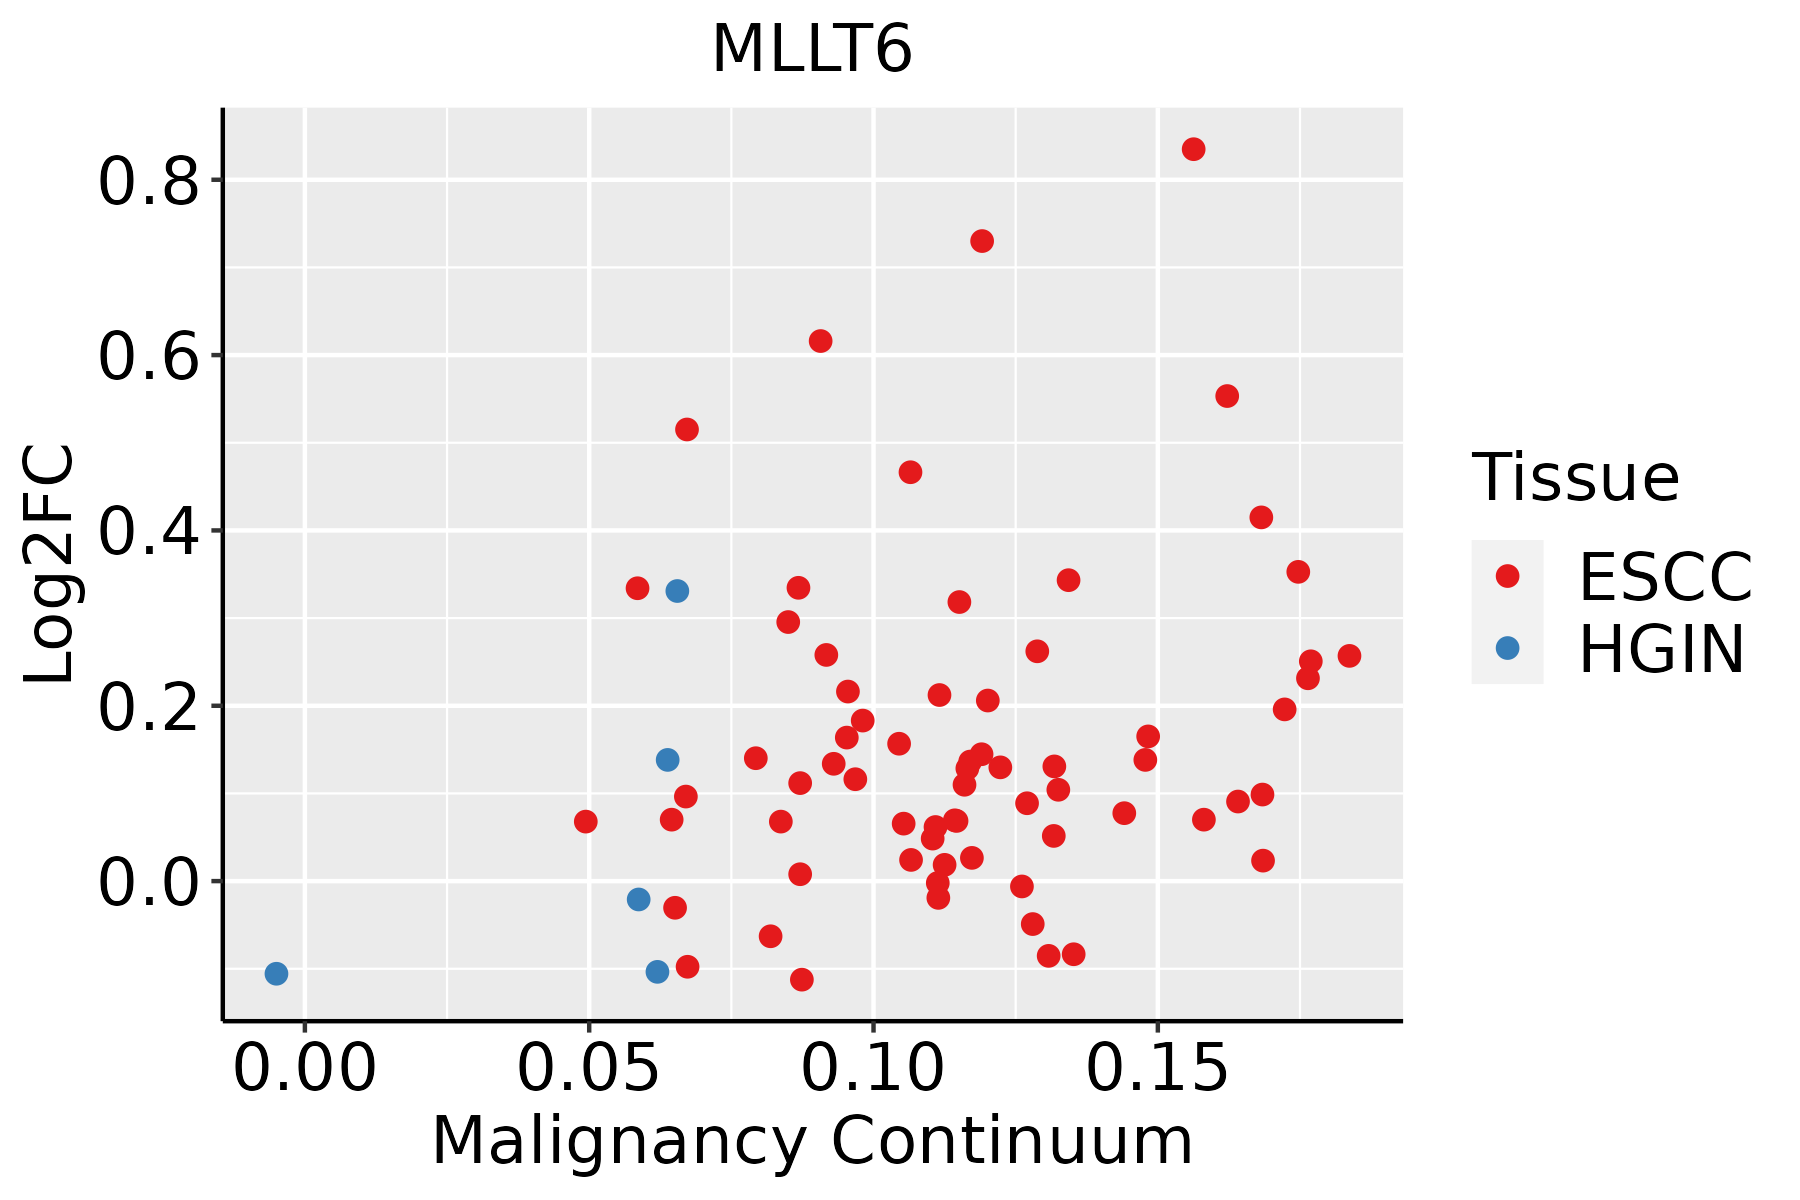
ESCC: Esophageal squamous cell carcinoma
HGIN: High-grade intraepithelial neoplasias
LGIN: Low-grade intraepithelial neoplasias
LiverThe image shows the transcriptomic changes along malignancy continuum.log2FC in expression of this searched gene in stem-like cells from each diseased tissue sample relative to stem-like cells in normal samples in each tissue plotted against the malignancy continuum. Samples are colored based on if they are from different disease stage.
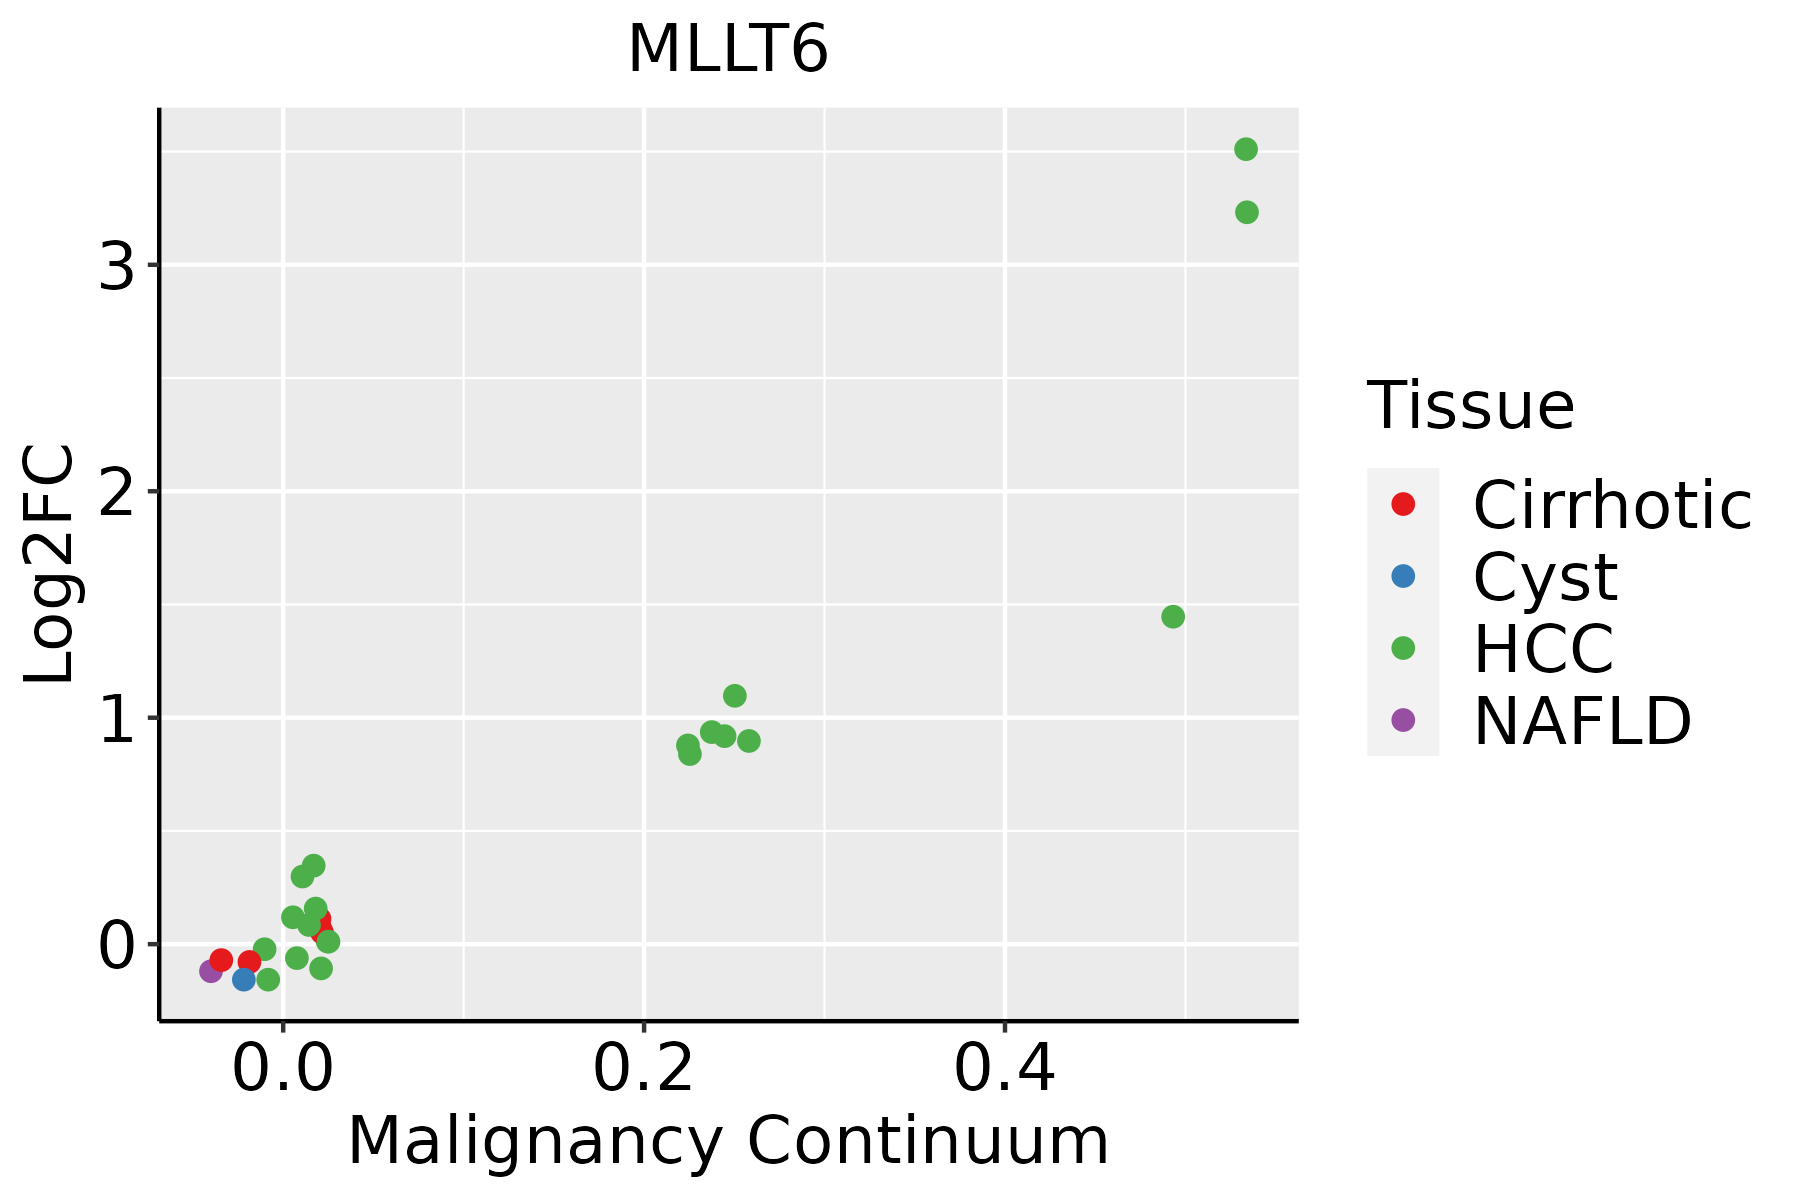
HCC: Hepatocellular carcinoma
NAFLD: Non-alcoholic fatty liver disease
Oral CavityThe image shows the transcriptomic changes along malignancy continuum.log2FC in expression of this searched gene in stem-like cells from each diseased tissue sample relative to stem-like cells in normal samples in each tissue plotted against the malignancy continuum. Samples are colored based on if they are from different disease stage.
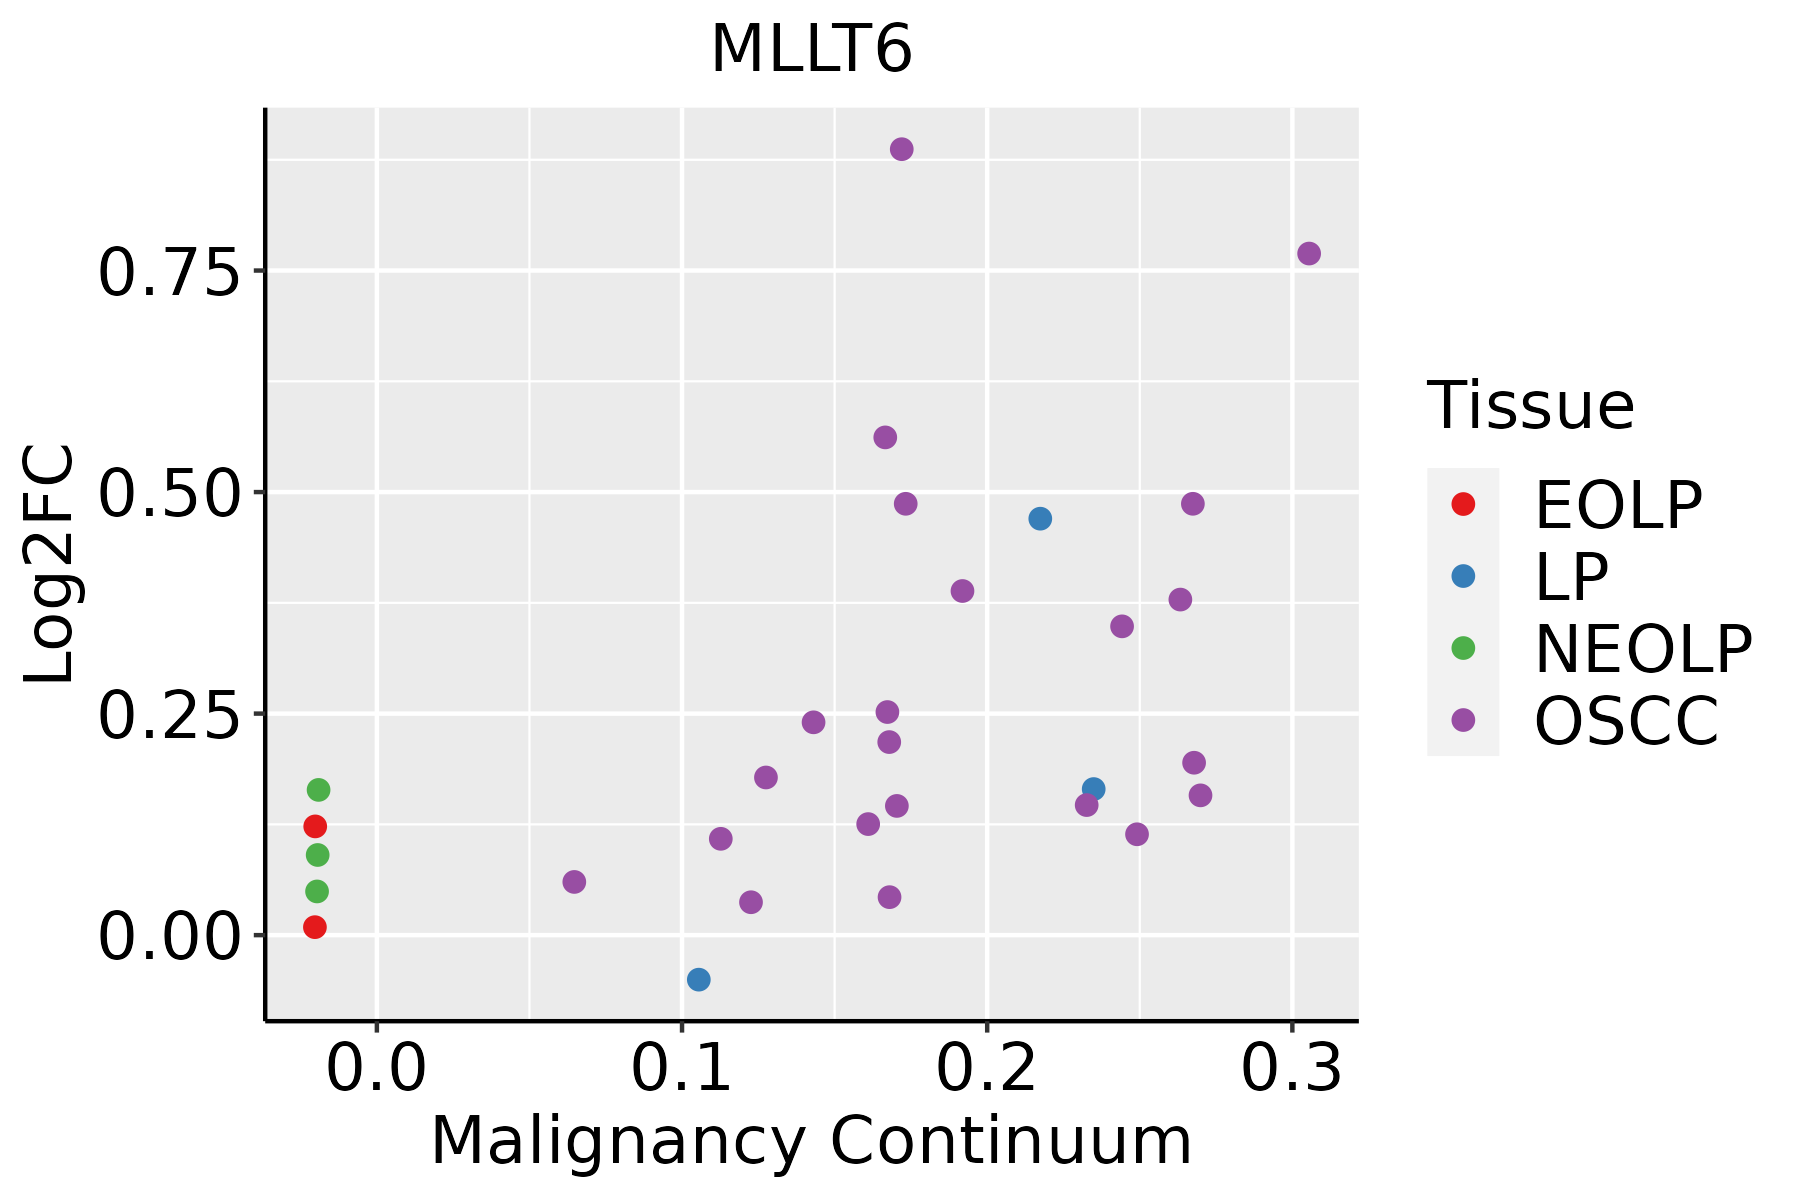
EOLP: Erosive Oral lichen planus
LP: leukoplakia
NEOLP: Non-erosive oral lichen planus
OSCC: Oral squamous cell carcinoma
ProstateThe image shows the transcriptomic changes along malignancy continuum.log2FC in expression of this searched gene in stem-like cells from each diseased tissue sample relative to stem-like cells in normal samples in each tissue plotted against the malignancy continuum. Samples are colored based on if they are from different disease stage.BPH: Benign Prostatic Hyperplasia
ThyroidThe image shows the transcriptomic changes along malignancy continuum.log2FC in expression of this searched gene in stem-like cells from each diseased tissue sample relative to stem-like cells in normal samples in each tissue plotted against the malignancy continuum. Samples are colored based on if they are from different disease stage.ATC: Anaplastic thyroid cancer
HT: Hashimoto's thyroiditis
PTC: Papillary thyroid cancer
∗log2FC in expression of this searched gene in stem-like cells from each diseased tissue sample relative to stem-like cells in normal samples in each tissue plotted against the malignancy continuum. Samples are colored based on if they are from different disease stage.

Top

Malignant transformation related pathway analysis

check buttonFind out the enriched GO biological processes and KEGG pathways involved in transition from healthy to precancer to cancer
check button Figure of enriched GO biological processes.
TissueDisease StageEnriched GO biological Processes
ColorectumADGO analysis - Figure of enriched GO biological processes: Top 15 enriched GO BP terms are showed in the bar plot of each disease state in each tissue. Each row represents a significant GO biological process which is colored according to the -log10(p.adjust).
ColorectumSERGO analysis - Figure of enriched GO biological processes: Top 15 enriched GO BP terms are showed in the bar plot of each disease state in each tissue. Each row represents a significant GO biological process which is colored according to the -log10(p.adjust).
ColorectumMSSGO analysis - Figure of enriched GO biological processes: Top 15 enriched GO BP terms are showed in the bar plot of each disease state in each tissue. Each row represents a significant GO biological process which is colored according to the -log10(p.adjust).
ColorectumMSI-HGO analysis - Figure of enriched GO biological processes: Top 15 enriched GO BP terms are showed in the bar plot of each disease state in each tissue. Each row represents a significant GO biological process which is colored according to the -log10(p.adjust).
ColorectumFAPGO analysis - Figure of enriched GO biological processes: Top 15 enriched GO BP terms are showed in the bar plot of each disease state in each tissue. Each row represents a significant GO biological process which is colored according to the -log10(p.adjust).
∗Top 15 enriched GO BP terms are showed in the bar plot of each disease state in each tissue. Each row represents a significant GO biological process which is colored according to the -log10(p.adjust).
Page: 1 2 3 4 5 6 7 8 9 

check button Enriched GO biological processes.
GO IDTissueDisease StageDescriptionGene RatioBg Ratiopvaluep.adjustCount
GO:005087813BreastIDCregulation of body fluid levels50/1434379/187231.12e-042.10e-0350
GO:001095913BreastIDCregulation of metal ion transport52/1434406/187231.76e-042.97e-0352
GO:00432703BreastIDCpositive regulation of ion transport36/1434275/187231.11e-031.22e-0236
GO:005087823BreastDCISregulation of body fluid levels50/1390379/187235.17e-051.06e-0350
GO:001095921BreastDCISregulation of metal ion transport50/1390406/187232.86e-044.22e-0350
GO:004327011BreastDCISpositive regulation of ion transport34/1390275/187232.35e-032.13e-0234
GO:00030144BreastDCISrenal system process16/1390110/187237.16e-034.85e-0216
GO:0002028ColorectumADregulation of sodium ion transport36/391890/187232.89e-055.37e-0436
GO:0010765ColorectumADpositive regulation of sodium ion transport17/391835/187232.48e-043.13e-0317
GO:0050878ColorectumADregulation of body fluid levels108/3918379/187232.54e-043.20e-03108
GO:0003014ColorectumADrenal system process35/3918110/187234.85e-033.27e-0235
GO:0055067ColorectumADmonovalent inorganic cation homeostasis45/3918151/187236.19e-033.88e-0245
GO:0031056ColorectumADregulation of histone modification45/3918152/187237.05e-034.31e-0245
GO:00020282ColorectumMSSregulation of sodium ion transport32/346790/187239.56e-051.50e-0332
GO:00508782ColorectumMSSregulation of body fluid levels99/3467379/187231.40e-042.07e-0399
GO:00107652ColorectumMSSpositive regulation of sodium ion transport15/346735/187237.59e-048.09e-0315
GO:0016570ColorectumMSShistone modification113/3467463/187238.37e-048.68e-03113
GO:00310562ColorectumMSSregulation of histone modification41/3467152/187236.41e-034.27e-0241
GO:00020284ColorectumFAPregulation of sodium ion transport33/262290/187236.51e-084.54e-0633
GO:00107654ColorectumFAPpositive regulation of sodium ion transport16/262235/187235.99e-061.90e-0416
Page: 1 2 3 4 5 6 7 8 9 

check button Enriched KEGG pathways.
Pathway IDTissueDisease StageDescriptionGene RatioBg Ratiopvaluep.adjustqvalueCount
Page: 1 

Top

Cell-cell communication analysis

check buttonIdentification of potential cell-cell interactions between two cell types and their ligand-receptor pairs for different disease states
LigandReceptorLRpairPathwayTissueDisease Stage
Page: 1 

Top

Single-cell gene regulatory network inference analysis

check buttonFind out the significant the regulons (TFs) and the target genes of each regulon across cell types for different disease states
TFCell TypeTissueDisease StageTarget GeneRSSRegulon Activity
∗The dot plots of a searched regulon are shown for all cell subpopulations in each disease state of each tissue based on the regulon specific score inferred using pySCENIC and by calculating the average expression.
Page: 1 

Top

Somatic mutation of malignant transformation related genes

check buttonAnnotation of somatic variants for genes involved in malignant transformation
Hugo SymbolVariant ClassVariant ClassificationdbSNP RSHGVScHGVSpHGVSp ShortSWISSPROTBIOTYPESIFTPolyPhenTumor Sample BarcodeTissueHistologySexAgeStageTherapy TypesDrugsOutcome
MLLT6SNVMissense_Mutationnovelc.877N>Ap.Glu293Lysp.E293Kprotein_codingtolerated(0.08)probably_damaging(0.953)TCGA-AC-A23H-01Breastbreast invasive carcinomaFemale>=65I/IIUnknownUnknownPD
MLLT6insertionFrame_Shift_Insnovelc.997_998insGTAAAGAp.Ser333CysfsTer24p.S333Cfs*24protein_codingTCGA-AQ-A04J-01Breastbreast invasive carcinomaFemale<65I/IIChemotherapycytoxanSD
MLLT6insertionFrame_Shift_Insnovelc.998_999insACTGACACTTATCGACGTTGAGAp.Ser334LeufsTer123p.S334Lfs*123protein_codingTCGA-AQ-A04J-01Breastbreast invasive carcinomaFemale<65I/IIChemotherapycytoxanSD
MLLT6deletionFrame_Shift_Delnovelc.609_619delCAGCATGGGGGp.Ser204ArgfsTer42p.S204Rfs*42protein_codingTCGA-B6-A409-01Breastbreast invasive carcinomaFemale<65III/IVChemotherapycyclophosphamidePD
MLLT6deletionFrame_Shift_Delnovelc.1382_1392delNNNNNNNNNNNp.Thr461ArgfsTer92p.T461Rfs*92protein_codingTCGA-C8-A12V-01Breastbreast invasive carcinomaFemale<65I/IIUnknownUnknownSD
MLLT6SNVMissense_Mutationnovelc.235N>Cp.Asp79Hisp.D79Hprotein_codingdeleterious(0)probably_damaging(0.999)TCGA-EK-A2PL-01Cervixcervical & endocervical cancerFemale<65III/IVUnknownUnknownSD
MLLT6SNVMissense_Mutationnovelc.228N>Cp.Lys76Asnp.K76Nprotein_codingdeleterious(0)probably_damaging(0.997)TCGA-HM-A4S6-01Cervixcervical & endocervical cancerFemale<65III/IVChemotherapycisplatinCR
MLLT6SNVMissense_Mutationnovelc.1831C>Gp.Gln611Glup.Q611Eprotein_codingdeleterious(0)probably_damaging(0.939)TCGA-IR-A3LK-01Cervixcervical & endocervical cancerFemale>=65I/IIChemotherapycisplatinPD
MLLT6SNVMissense_Mutationnovelc.1927N>Ap.Glu643Lysp.E643Kprotein_codingdeleterious(0)probably_damaging(0.99)TCGA-MY-A5BF-01Cervixcervical & endocervical cancerFemale>=65I/IIChemotherapycisplatinCR
MLLT6SNVMissense_Mutationnovelc.1330N>Tp.Arg444Trpp.R444Wprotein_codingdeleterious(0)probably_damaging(0.997)TCGA-AA-3492-01Colorectumcolon adenocarcinomaFemale>=65I/IIUnknownUnknownSD
Page: 1 2 3 4 5 6 7 8 9 

Top

Related drugs of malignant transformation related genes

check buttonIdentification of chemicals and drugs interact with genes involved in malignant transfromation
(DGIdb 4.0)
Entrez IDSymbolCategoryInteraction TypesDrug Claim NameDrug NamePMIDs
Page: 1