
|
|||||
|
 | |
| |
| |
| |
| |
| |
|
Gene: MLLT3 |
Gene summary for MLLT3 |
| Gene information | Species | Human | Gene symbol | MLLT3 | Gene ID | 4300 |
| Gene name | MLLT3 super elongation complex subunit | |
| Gene Alias | AF9 | |
| Cytomap | 9p21.3 | |
| Gene Type | protein-coding | GO ID | GO:0001736 | UniProtAcc | P42568 |
Top |
Malignant transformation analysis |
| Identification of the aberrant gene expression in precancerous and cancerous lesions by comparing the gene expression of stem-like cells in diseased tissues with normal stem cells |
| Entrez ID | Symbol | Replicates | Species | Organ | Tissue | Adj P-value | Log2FC | Malignancy |
| 4300 | MLLT3 | CCI_1 | Human | Cervix | CC | 3.87e-04 | 5.38e-01 | 0.528 |
| 4300 | MLLT3 | CCI_2 | Human | Cervix | CC | 4.35e-06 | 9.32e-01 | 0.5249 |
| 4300 | MLLT3 | CCI_3 | Human | Cervix | CC | 4.13e-08 | 5.51e-01 | 0.516 |
| 4300 | MLLT3 | HTA11_3410_2000001011 | Human | Colorectum | AD | 5.30e-11 | -4.42e-01 | 0.0155 |
| 4300 | MLLT3 | HTA11_2487_2000001011 | Human | Colorectum | SER | 9.13e-05 | -4.56e-01 | -0.1808 |
| 4300 | MLLT3 | HTA11_347_2000001011 | Human | Colorectum | AD | 5.01e-05 | 5.41e-01 | -0.1954 |
| 4300 | MLLT3 | HTA11_3361_2000001011 | Human | Colorectum | AD | 4.73e-04 | -4.28e-01 | -0.1207 |
| 4300 | MLLT3 | HTA11_866_3004761011 | Human | Colorectum | AD | 1.34e-02 | -3.61e-01 | 0.096 |
| 4300 | MLLT3 | HTA11_4255_2000001011 | Human | Colorectum | SER | 1.49e-03 | -4.90e-01 | 0.0446 |
| 4300 | MLLT3 | HTA11_8622_2000001021 | Human | Colorectum | SER | 1.77e-02 | -6.09e-01 | 0.0528 |
| 4300 | MLLT3 | HTA11_99999970781_79442 | Human | Colorectum | MSS | 2.61e-02 | 4.79e-01 | 0.294 |
| 4300 | MLLT3 | HTA11_99999965104_69814 | Human | Colorectum | MSS | 5.67e-03 | 5.18e-01 | 0.281 |
| 4300 | MLLT3 | HTA11_99999974143_84620 | Human | Colorectum | MSS | 1.13e-32 | -7.96e-01 | 0.3005 |
| 4300 | MLLT3 | F007 | Human | Colorectum | FAP | 2.67e-02 | 1.87e-02 | 0.1176 |
| 4300 | MLLT3 | A002-C-010 | Human | Colorectum | FAP | 1.22e-03 | 2.19e-01 | 0.242 |
| 4300 | MLLT3 | A001-C-207 | Human | Colorectum | FAP | 8.74e-03 | 1.88e-01 | 0.1278 |
| 4300 | MLLT3 | A015-C-203 | Human | Colorectum | FAP | 1.17e-27 | -3.67e-01 | -0.1294 |
| 4300 | MLLT3 | A015-C-204 | Human | Colorectum | FAP | 1.23e-04 | -1.77e-01 | -0.0228 |
| 4300 | MLLT3 | A014-C-040 | Human | Colorectum | FAP | 4.76e-07 | -3.54e-01 | -0.1184 |
| 4300 | MLLT3 | A002-C-201 | Human | Colorectum | FAP | 8.44e-12 | -1.76e-01 | 0.0324 |
| Page: 1 2 3 4 5 6 7 8 |
| Tissue | Expression Dynamics | Abbreviation |
| Cervix |  | CC: Cervix cancer |
| HSIL_HPV: HPV-infected high-grade squamous intraepithelial lesions | ||
| N_HPV: HPV-infected normal cervix | ||
| Colorectum (GSE201348) |  | FAP: Familial adenomatous polyposis |
| CRC: Colorectal cancer | ||
| Colorectum (HTA11) |  | AD: Adenomas |
| SER: Sessile serrated lesions | ||
| MSI-H: Microsatellite-high colorectal cancer | ||
| MSS: Microsatellite stable colorectal cancer | ||
| Endometrium |  | AEH: Atypical endometrial hyperplasia |
| EEC: Endometrioid Cancer | ||
| Esophagus | 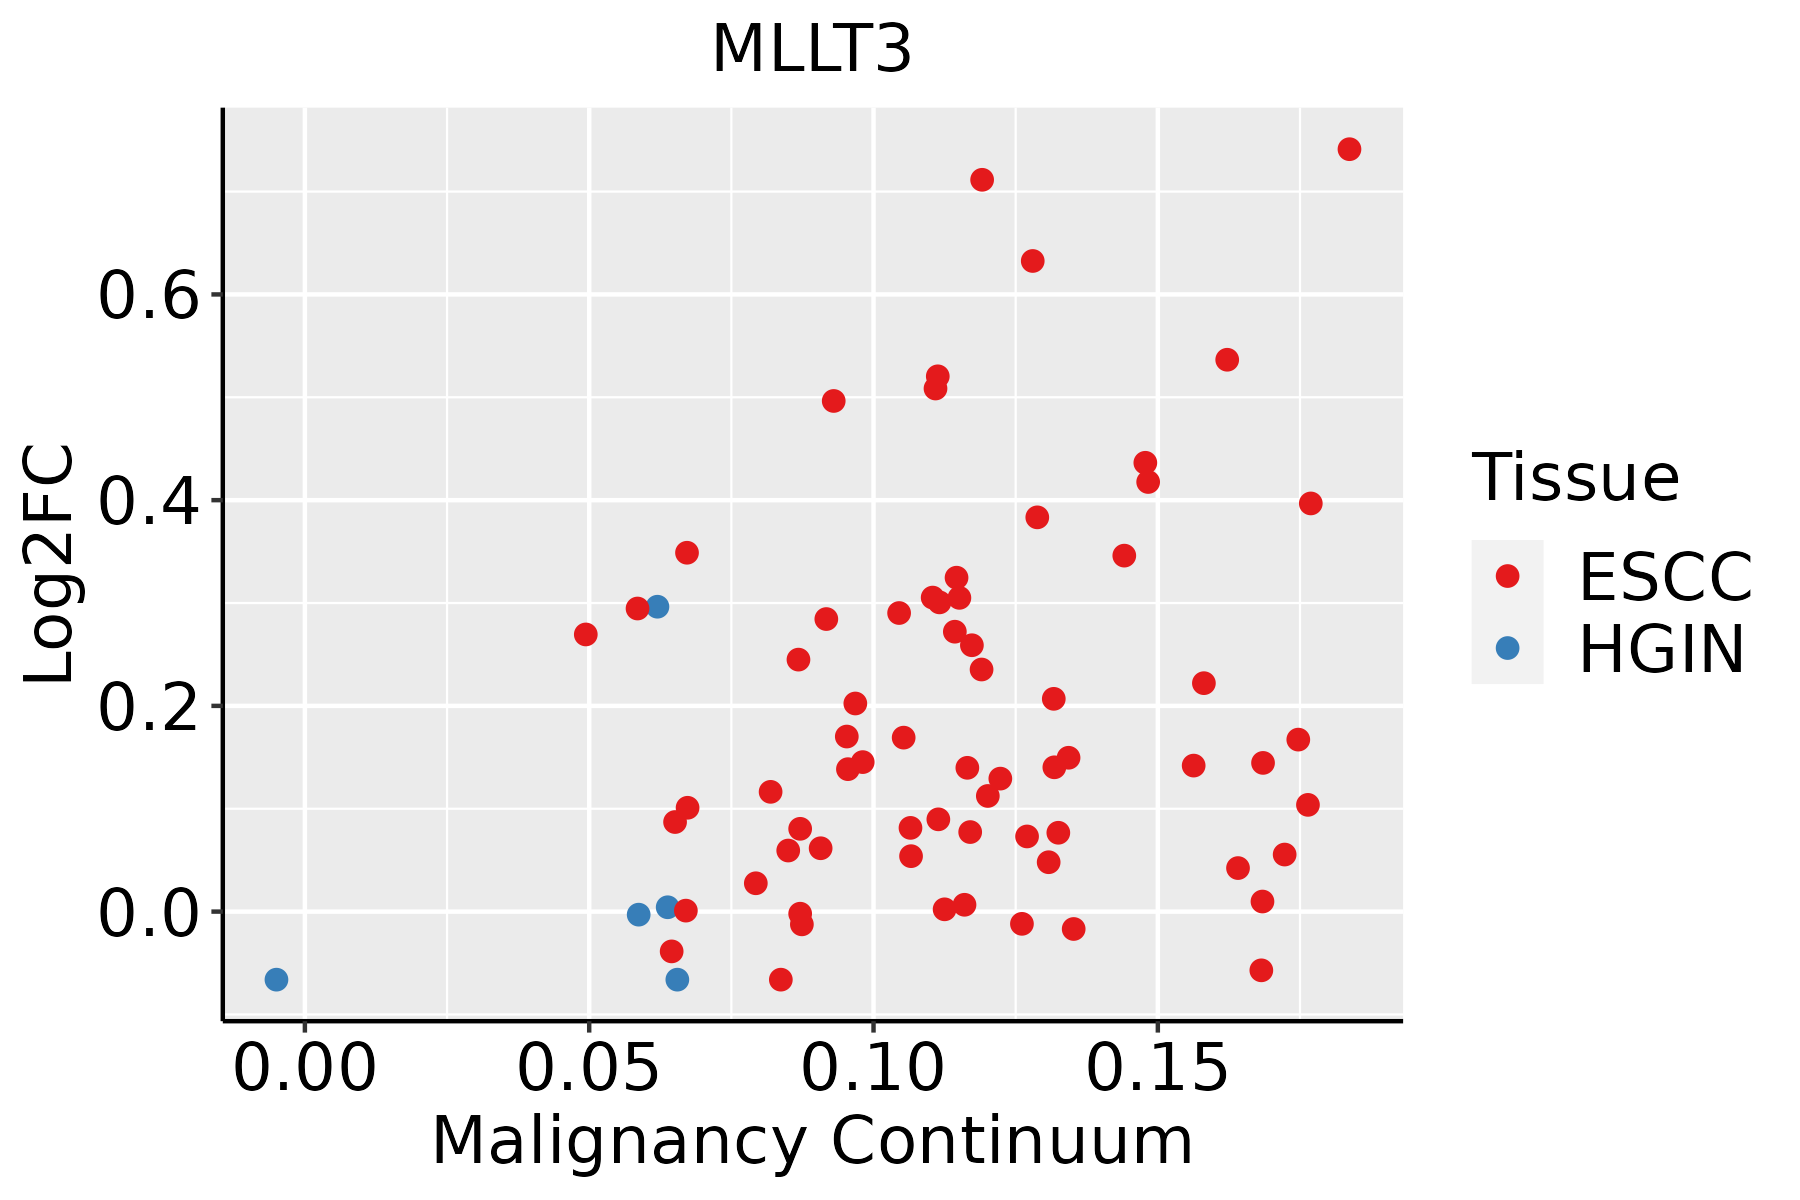 | ESCC: Esophageal squamous cell carcinoma |
| HGIN: High-grade intraepithelial neoplasias | ||
| LGIN: Low-grade intraepithelial neoplasias | ||
| Liver | 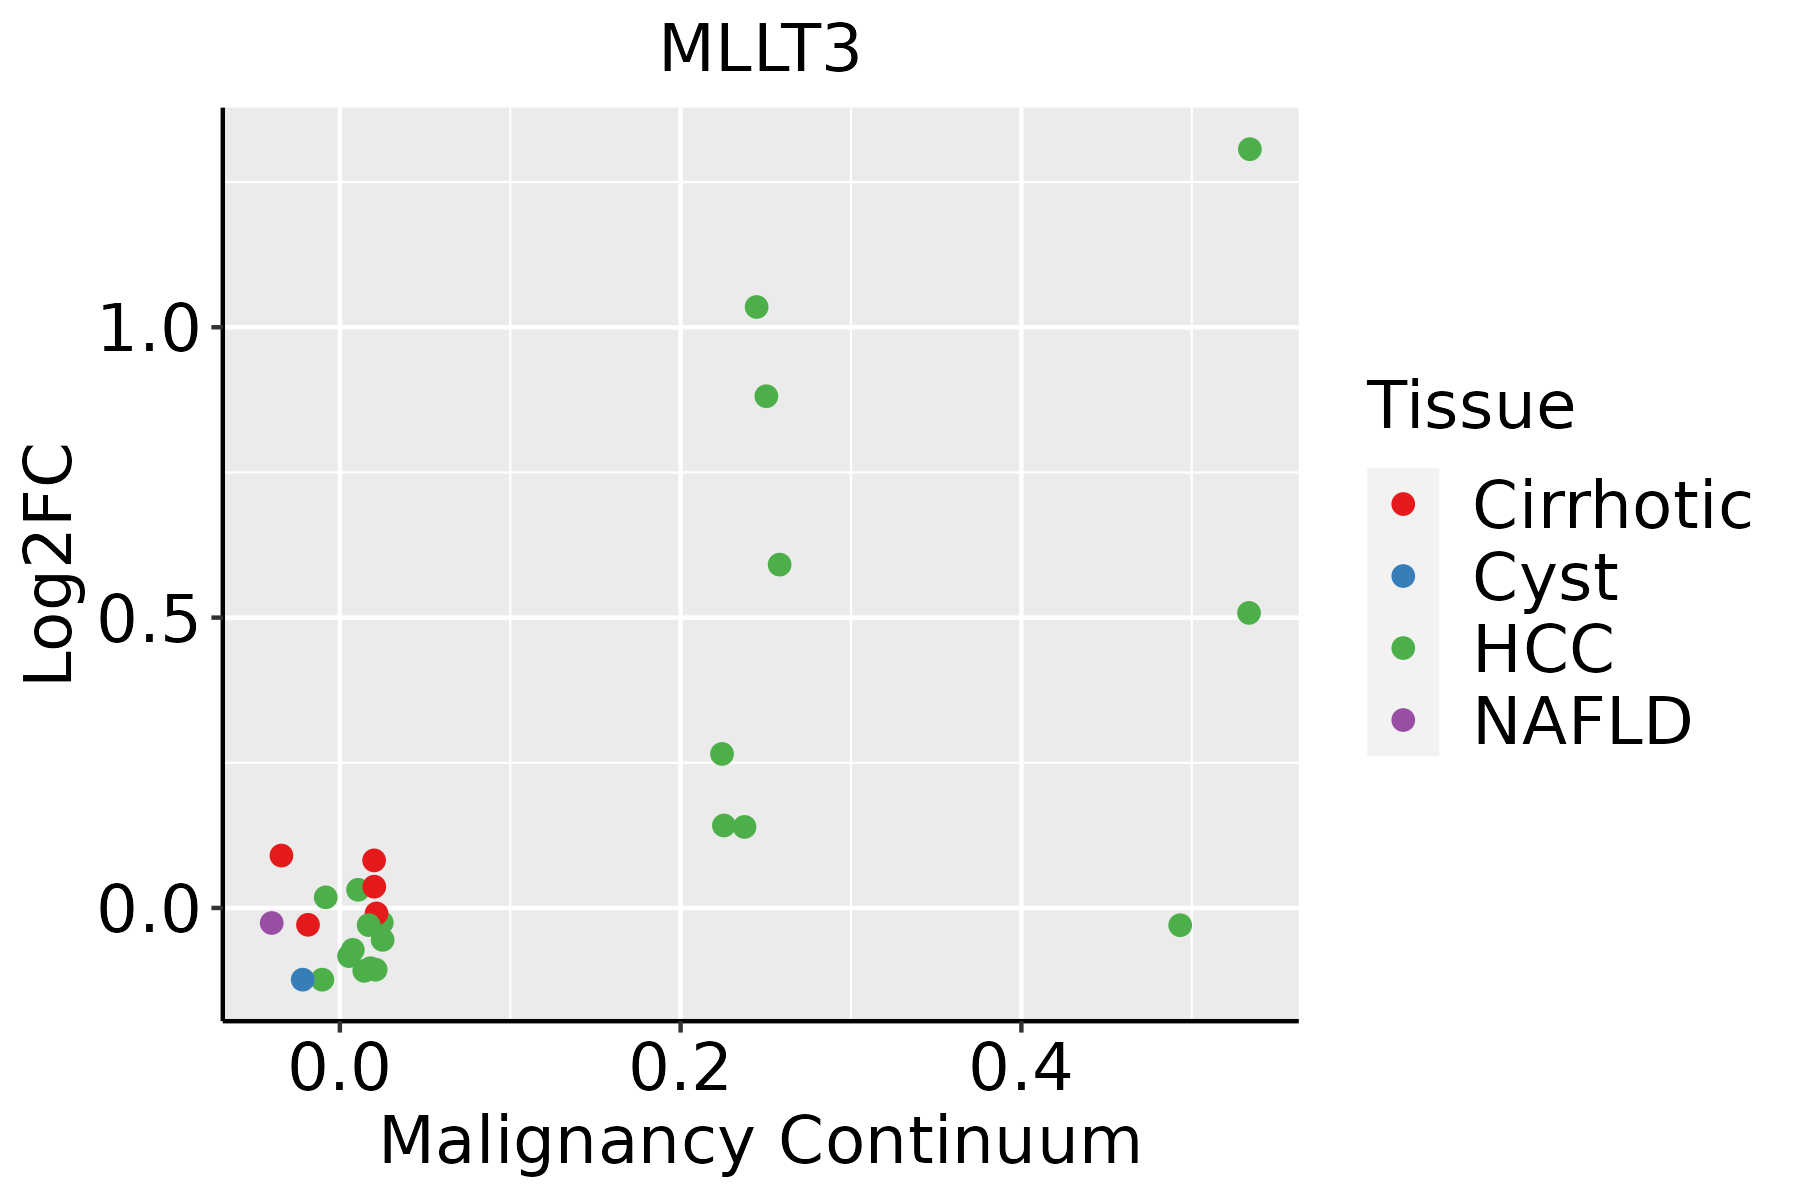 | HCC: Hepatocellular carcinoma |
| NAFLD: Non-alcoholic fatty liver disease | ||
| Lung |  | AAH: Atypical adenomatous hyperplasia |
| AIS: Adenocarcinoma in situ | ||
| IAC: Invasive lung adenocarcinoma | ||
| MIA: Minimally invasive adenocarcinoma | ||
| Thyroid | 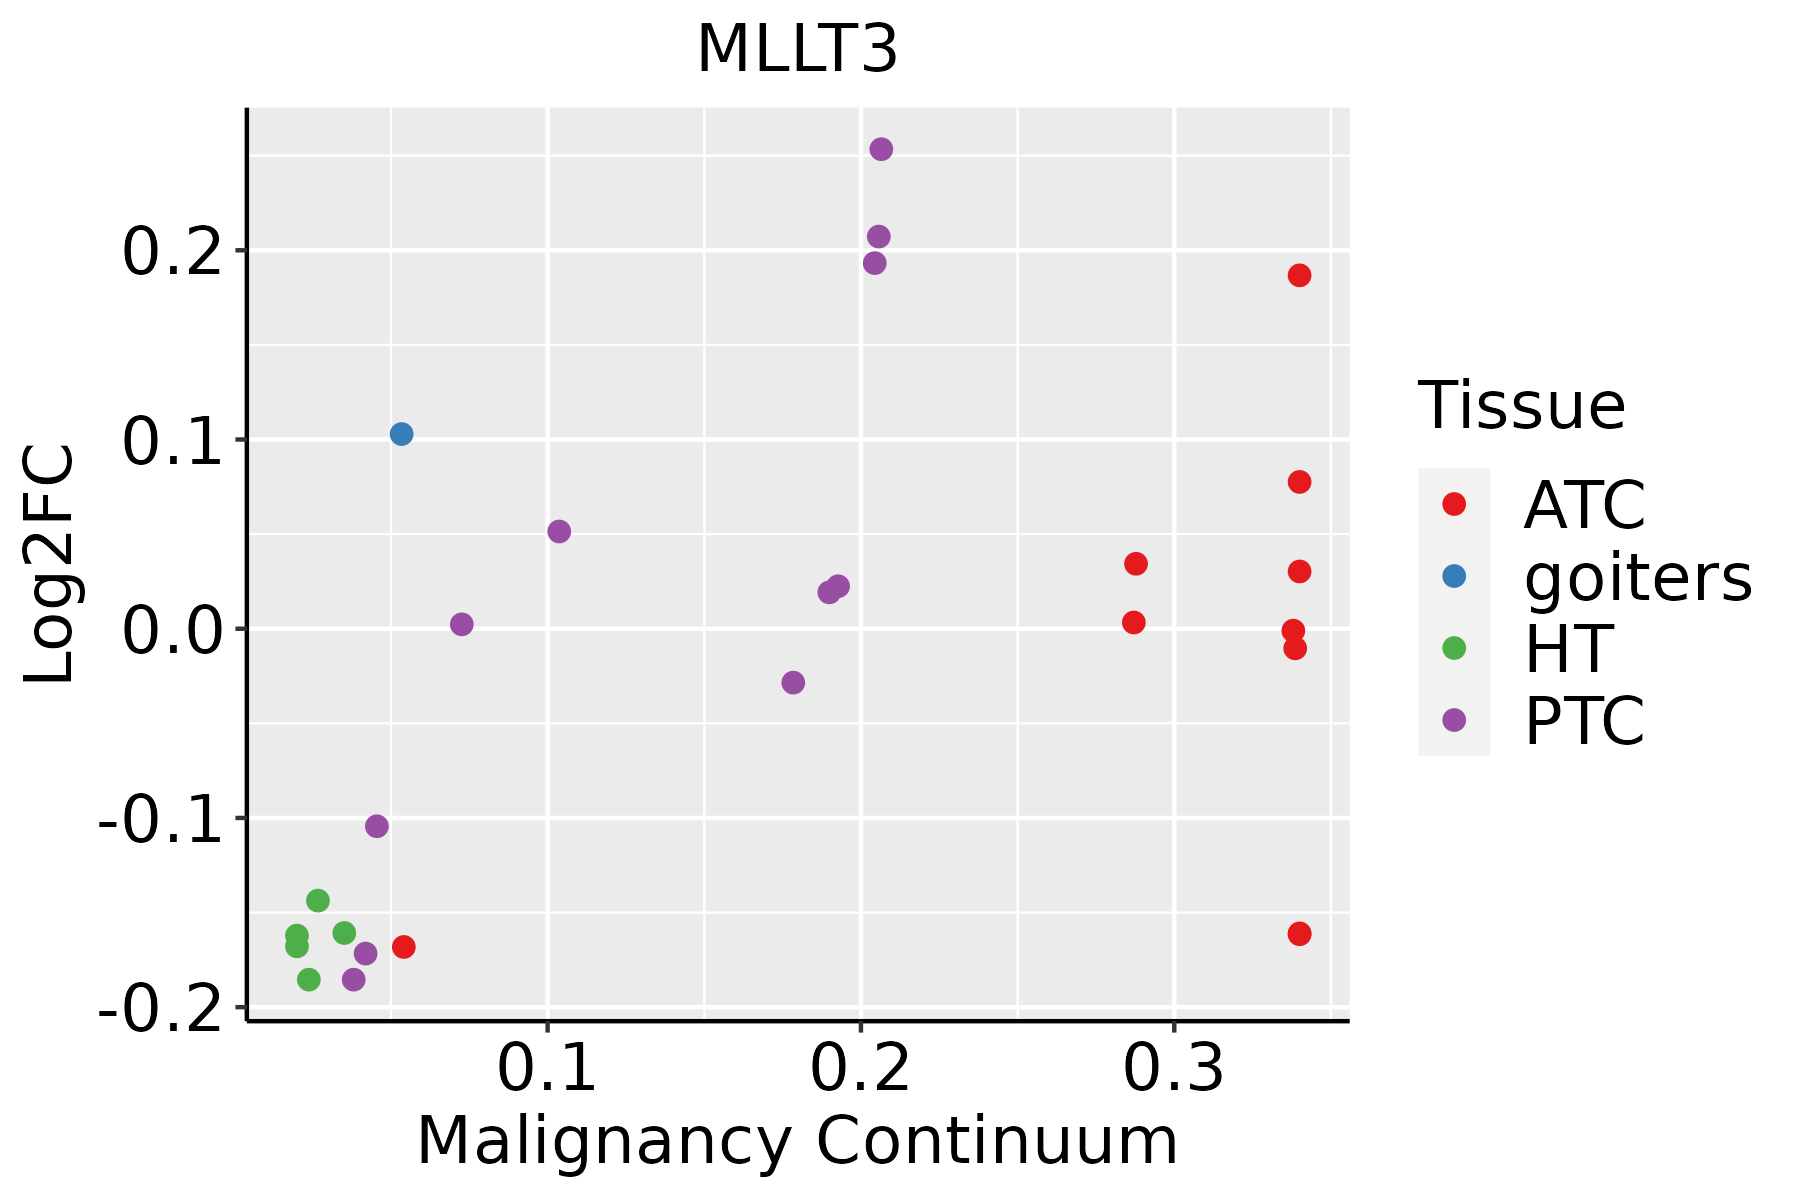 | ATC: Anaplastic thyroid cancer |
| HT: Hashimoto's thyroiditis | ||
| PTC: Papillary thyroid cancer |
| ∗log2FC in expression of this searched gene in stem-like cells from each diseased tissue sample relative to stem-like cells in normal samples in each tissue plotted against the malignancy continuum. Samples are colored based on if they are from different disease stage. |
Top |
Malignant transformation related pathway analysis |
| Find out the enriched GO biological processes and KEGG pathways involved in transition from healthy to precancer to cancer |
| Tissue | Disease Stage | Enriched GO biological Processes |
| Colorectum | AD |  |
| Colorectum | SER |  |
| Colorectum | MSS |  |
| Colorectum | MSI-H |  |
| Colorectum | FAP |  |
| ∗Top 15 enriched GO BP terms are showed in the bar plot of each disease state in each tissue. Each row represents a significant GO biological process which is colored according to the -log10(p.adjust). |
| Page: 1 2 3 4 5 6 7 8 9 |
| GO ID | Tissue | Disease Stage | Description | Gene Ratio | Bg Ratio | pvalue | p.adjust | Count |
| GO:00160557 | Cervix | CC | Wnt signaling pathway | 98/2311 | 444/18723 | 4.82e-09 | 4.65e-07 | 98 |
| GO:01987387 | Cervix | CC | cell-cell signaling by wnt | 98/2311 | 446/18723 | 6.16e-09 | 5.58e-07 | 98 |
| GO:00301117 | Cervix | CC | regulation of Wnt signaling pathway | 76/2311 | 328/18723 | 3.05e-08 | 2.08e-06 | 76 |
| GO:00608287 | Cervix | CC | regulation of canonical Wnt signaling pathway | 58/2311 | 253/18723 | 1.83e-06 | 5.89e-05 | 58 |
| GO:00600707 | Cervix | CC | canonical Wnt signaling pathway | 66/2311 | 303/18723 | 2.47e-06 | 7.35e-05 | 66 |
| GO:00488634 | Cervix | CC | stem cell differentiation | 46/2311 | 206/18723 | 4.11e-05 | 6.36e-04 | 46 |
| GO:00063257 | Cervix | CC | chromatin organization | 78/2311 | 409/18723 | 5.40e-05 | 8.02e-04 | 78 |
| GO:00513021 | Cervix | CC | regulation of cell division | 39/2311 | 177/18723 | 2.05e-04 | 2.33e-03 | 39 |
| GO:00301776 | Cervix | CC | positive regulation of Wnt signaling pathway | 31/2311 | 140/18723 | 8.01e-04 | 7.02e-03 | 31 |
| GO:00022443 | Cervix | CC | hematopoietic progenitor cell differentiation | 26/2311 | 114/18723 | 1.30e-03 | 1.03e-02 | 26 |
| GO:00301784 | Cervix | CC | negative regulation of Wnt signaling pathway | 35/2311 | 170/18723 | 1.52e-03 | 1.17e-02 | 35 |
| GO:00017384 | Cervix | CC | morphogenesis of a polarized epithelium | 22/2311 | 94/18723 | 2.09e-03 | 1.52e-02 | 22 |
| GO:0060218 | Cervix | CC | hematopoietic stem cell differentiation | 10/2311 | 30/18723 | 2.33e-03 | 1.66e-02 | 10 |
| GO:00900901 | Cervix | CC | negative regulation of canonical Wnt signaling pathway | 29/2311 | 137/18723 | 2.40e-03 | 1.70e-02 | 29 |
| GO:00901752 | Cervix | CC | regulation of establishment of planar polarity | 14/2311 | 56/18723 | 6.93e-03 | 3.74e-02 | 14 |
| GO:0017145 | Cervix | CC | stem cell division | 9/2311 | 30/18723 | 8.28e-03 | 4.28e-02 | 9 |
| GO:00600712 | Cervix | CC | Wnt signaling pathway, planar cell polarity pathway | 13/2311 | 52/18723 | 9.09e-03 | 4.60e-02 | 13 |
| GO:0030111 | Colorectum | AD | regulation of Wnt signaling pathway | 102/3918 | 328/18723 | 8.51e-06 | 2.03e-04 | 102 |
| GO:0016055 | Colorectum | AD | Wnt signaling pathway | 130/3918 | 444/18723 | 1.60e-05 | 3.37e-04 | 130 |
| GO:0198738 | Colorectum | AD | cell-cell signaling by wnt | 130/3918 | 446/18723 | 2.02e-05 | 4.10e-04 | 130 |
| Page: 1 2 3 4 5 6 7 8 9 10 |
| Pathway ID | Tissue | Disease Stage | Description | Gene Ratio | Bg Ratio | pvalue | p.adjust | qvalue | Count |
| hsa03250 | Colorectum | MSS | Viral life cycle - HIV-1 | 23/1875 | 63/8465 | 6.55e-03 | 2.64e-02 | 1.62e-02 | 23 |
| hsa032501 | Colorectum | MSS | Viral life cycle - HIV-1 | 23/1875 | 63/8465 | 6.55e-03 | 2.64e-02 | 1.62e-02 | 23 |
| hsa05202 | Colorectum | FAP | Transcriptional misregulation in cancer | 45/1404 | 193/8465 | 9.19e-03 | 3.33e-02 | 2.03e-02 | 45 |
| hsa052021 | Colorectum | FAP | Transcriptional misregulation in cancer | 45/1404 | 193/8465 | 9.19e-03 | 3.33e-02 | 2.03e-02 | 45 |
| hsa032509 | Esophagus | ESCC | Viral life cycle - HIV-1 | 54/4205 | 63/8465 | 2.01e-09 | 2.17e-08 | 1.11e-08 | 54 |
| hsa052028 | Esophagus | ESCC | Transcriptional misregulation in cancer | 116/4205 | 193/8465 | 2.08e-03 | 5.95e-03 | 3.05e-03 | 116 |
| hsa0325014 | Esophagus | ESCC | Viral life cycle - HIV-1 | 54/4205 | 63/8465 | 2.01e-09 | 2.17e-08 | 1.11e-08 | 54 |
| hsa0520213 | Esophagus | ESCC | Transcriptional misregulation in cancer | 116/4205 | 193/8465 | 2.08e-03 | 5.95e-03 | 3.05e-03 | 116 |
| hsa032502 | Liver | HCC | Viral life cycle - HIV-1 | 46/4020 | 63/8465 | 3.25e-05 | 1.88e-04 | 1.04e-04 | 46 |
| hsa0325011 | Liver | HCC | Viral life cycle - HIV-1 | 46/4020 | 63/8465 | 3.25e-05 | 1.88e-04 | 1.04e-04 | 46 |
| hsa052026 | Lung | IAC | Transcriptional misregulation in cancer | 40/1053 | 193/8465 | 6.90e-04 | 5.90e-03 | 3.92e-03 | 40 |
| hsa0520211 | Lung | IAC | Transcriptional misregulation in cancer | 40/1053 | 193/8465 | 6.90e-04 | 5.90e-03 | 3.92e-03 | 40 |
| hsa052022 | Lung | AIS | Transcriptional misregulation in cancer | 39/961 | 193/8465 | 2.15e-04 | 2.41e-03 | 1.54e-03 | 39 |
| hsa052023 | Lung | AIS | Transcriptional misregulation in cancer | 39/961 | 193/8465 | 2.15e-04 | 2.41e-03 | 1.54e-03 | 39 |
| hsa052024 | Lung | MIAC | Transcriptional misregulation in cancer | 22/507 | 193/8465 | 2.64e-03 | 2.26e-02 | 1.64e-02 | 22 |
| hsa052025 | Lung | MIAC | Transcriptional misregulation in cancer | 22/507 | 193/8465 | 2.64e-03 | 2.26e-02 | 1.64e-02 | 22 |
| Page: 1 |
Top |
Cell-cell communication analysis |
| Identification of potential cell-cell interactions between two cell types and their ligand-receptor pairs for different disease states |
| Ligand | Receptor | LRpair | Pathway | Tissue | Disease Stage |
| Page: 1 |
Top |
Single-cell gene regulatory network inference analysis |
| Find out the significant the regulons (TFs) and the target genes of each regulon across cell types for different disease states |
| TF | Cell Type | Tissue | Disease Stage | Target Gene | RSS | Regulon Activity |
| ∗The dot plots of a searched regulon are shown for all cell subpopulations in each disease state of each tissue based on the regulon specific score inferred using pySCENIC and by calculating the average expression. |
| Page: 1 |
Top |
Somatic mutation of malignant transformation related genes |
| Annotation of somatic variants for genes involved in malignant transformation |
| Hugo Symbol | Variant Class | Variant Classification | dbSNP RS | HGVSc | HGVSp | HGVSp Short | SWISSPROT | BIOTYPE | SIFT | PolyPhen | Tumor Sample Barcode | Tissue | Histology | Sex | Age | Stage | Therapy Types | Drugs | Outcome |
| MLLT3 | SNV | Missense_Mutation | c.1320N>A | p.Ser440Arg | p.S440R | P42568 | protein_coding | tolerated(0.29) | benign(0.034) | TCGA-A2-A25A-01 | Breast | breast invasive carcinoma | Female | <65 | I/II | Unspecific | Cytoxan | SD | |
| MLLT3 | SNV | Missense_Mutation | c.589N>A | p.His197Asn | p.H197N | P42568 | protein_coding | deleterious(0) | benign(0.081) | TCGA-AC-A23H-01 | Breast | breast invasive carcinoma | Female | >=65 | I/II | Unknown | Unknown | PD | |
| MLLT3 | SNV | Missense_Mutation | rs767415332 | c.178N>T | p.Pro60Ser | p.P60S | P42568 | protein_coding | deleterious(0.01) | probably_damaging(0.955) | TCGA-E2-A14N-01 | Breast | breast invasive carcinoma | Female | <65 | I/II | Chemotherapy | cyclophosphamide | SD |
| MLLT3 | SNV | Missense_Mutation | c.1163C>G | p.Ser388Cys | p.S388C | P42568 | protein_coding | deleterious(0) | probably_damaging(0.971) | TCGA-C5-A1BQ-01 | Cervix | cervical & endocervical cancer | Female | >=65 | III/IV | Chemotherapy | cisplatin | CR | |
| MLLT3 | insertion | In_Frame_Ins | novel | c.501_521dupTAGCAGCAGCAGCAGCAGCAG | p.Ser184_Ser190dup | p.S184_S190dup | P42568 | protein_coding | TCGA-EA-A3HS-01 | Cervix | cervical & endocervical cancer | Female | <65 | I/II | Unknown | Unknown | SD | ||
| MLLT3 | SNV | Missense_Mutation | novel | c.874N>A | p.Glu292Lys | p.E292K | P42568 | protein_coding | tolerated(1) | benign(0.037) | TCGA-AZ-4315-01 | Colorectum | colon adenocarcinoma | Male | <65 | I/II | Unknown | Unknown | SD |
| MLLT3 | SNV | Missense_Mutation | c.935N>T | p.Ser312Ile | p.S312I | P42568 | protein_coding | deleterious(0.03) | benign(0.094) | TCGA-NH-A6GC-01 | Colorectum | colon adenocarcinoma | Female | >=65 | I/II | Chemotherapy | fluorouracil | SD | |
| MLLT3 | SNV | Missense_Mutation | rs747900361 | c.1322N>A | p.Arg441Gln | p.R441Q | P42568 | protein_coding | deleterious(0.03) | benign(0.034) | TCGA-AG-A002-01 | Colorectum | rectum adenocarcinoma | Male | <65 | I/II | Unknown | Unknown | SD |
| MLLT3 | insertion | Frame_Shift_Ins | novel | c.430_431insTGTTCTCT | p.Arg144MetfsTer59 | p.R144Mfs*59 | P42568 | protein_coding | TCGA-A6-2677-01 | Colorectum | colon adenocarcinoma | Female | >=65 | III/IV | Ancillary | leucovorin | SD | ||
| MLLT3 | insertion | In_Frame_Ins | novel | c.564_566dupCAG | p.Ser190dup | p.S190dup | P42568 | protein_coding | TCGA-AA-3845-01 | Colorectum | colon adenocarcinoma | Female | >=65 | I/II | Unknown | Unknown | PD |
| Page: 1 2 3 4 5 6 7 |
Top |
Related drugs of malignant transformation related genes |
| Identification of chemicals and drugs interact with genes involved in malignant transfromation |
| (DGIdb 4.0) |
| Entrez ID | Symbol | Category | Interaction Types | Drug Claim Name | Drug Name | PMIDs |
| 4300 | MLLT3 | CLINICALLY ACTIONABLE | cisplatin | CISPLATIN | 27150640 | |
| 4300 | MLLT3 | CLINICALLY ACTIONABLE | montelukast | MONTELUKAST | 26083242 |
| Page: 1 |

Copyright 2023-Present -The University of Texas Health Science Center at Houston |