
|
|||||
|
 | |
| |
| |
| |
| |
| |
|
Gene: MLLT10 |
Gene summary for MLLT10 |
| Gene information | Species | Human | Gene symbol | MLLT10 | Gene ID | 8028 |
| Gene name | MLLT10 histone lysine methyltransferase DOT1L cofactor | |
| Gene Alias | AF10 | |
| Cytomap | 10p12.31 | |
| Gene Type | protein-coding | GO ID | GO:0006139 | UniProtAcc | P55197 |
Top |
Malignant transformation analysis |
| Identification of the aberrant gene expression in precancerous and cancerous lesions by comparing the gene expression of stem-like cells in diseased tissues with normal stem cells |
| Entrez ID | Symbol | Replicates | Species | Organ | Tissue | Adj P-value | Log2FC | Malignancy |
| 8028 | MLLT10 | CCI_1 | Human | Cervix | CC | 8.14e-04 | 7.06e-01 | 0.528 |
| 8028 | MLLT10 | CCI_2 | Human | Cervix | CC | 6.09e-08 | 8.99e-01 | 0.5249 |
| 8028 | MLLT10 | CCI_3 | Human | Cervix | CC | 1.95e-11 | 9.49e-01 | 0.516 |
| 8028 | MLLT10 | EEC-subject2 | Human | Endometrium | EEC | 7.74e-04 | 2.38e-01 | -0.2607 |
| 8028 | MLLT10 | EEC-subject3 | Human | Endometrium | EEC | 5.77e-06 | -9.15e-02 | -0.2525 |
| 8028 | MLLT10 | EEC-subject4 | Human | Endometrium | EEC | 2.99e-03 | 1.19e-01 | -0.2571 |
| 8028 | MLLT10 | GSM5276934 | Human | Endometrium | EEC | 5.18e-07 | -1.58e-01 | -0.0913 |
| 8028 | MLLT10 | GSM5276937 | Human | Endometrium | EEC | 9.73e-04 | -1.81e-01 | -0.0897 |
| 8028 | MLLT10 | GSM6177620_NYU_UCEC1_lib1_lib1 | Human | Endometrium | EEC | 6.71e-10 | -8.75e-02 | -0.1869 |
| 8028 | MLLT10 | GSM6177620_NYU_UCEC1_lib2_lib2 | Human | Endometrium | EEC | 3.18e-06 | -8.94e-02 | -0.1875 |
| 8028 | MLLT10 | GSM6177620_NYU_UCEC1_lib3_lib3 | Human | Endometrium | EEC | 6.23e-13 | -1.22e-01 | -0.1883 |
| 8028 | MLLT10 | GSM6177621_NYU_UCEC2_lib1_lib1 | Human | Endometrium | EEC | 1.15e-07 | 1.19e-02 | -0.1934 |
| 8028 | MLLT10 | GSM6177622_NYU_UCEC3_lib1_lib1 | Human | Endometrium | EEC | 5.13e-14 | -1.51e-01 | -0.1917 |
| 8028 | MLLT10 | GSM6177622_NYU_UCEC3_lib2_lib2 | Human | Endometrium | EEC | 3.80e-13 | -1.03e-01 | -0.1916 |
| 8028 | MLLT10 | LZE4T | Human | Esophagus | ESCC | 1.06e-11 | 4.74e-01 | 0.0811 |
| 8028 | MLLT10 | LZE7T | Human | Esophagus | ESCC | 2.42e-04 | 1.81e-01 | 0.0667 |
| 8028 | MLLT10 | LZE8T | Human | Esophagus | ESCC | 4.26e-05 | 1.83e-01 | 0.067 |
| 8028 | MLLT10 | LZE24T | Human | Esophagus | ESCC | 3.08e-18 | 5.56e-01 | 0.0596 |
| 8028 | MLLT10 | P1T-E | Human | Esophagus | ESCC | 1.19e-08 | 4.97e-01 | 0.0875 |
| 8028 | MLLT10 | P2T-E | Human | Esophagus | ESCC | 7.98e-24 | 4.51e-01 | 0.1177 |
| Page: 1 2 3 4 5 6 7 |
| Tissue | Expression Dynamics | Abbreviation |
| Cervix | 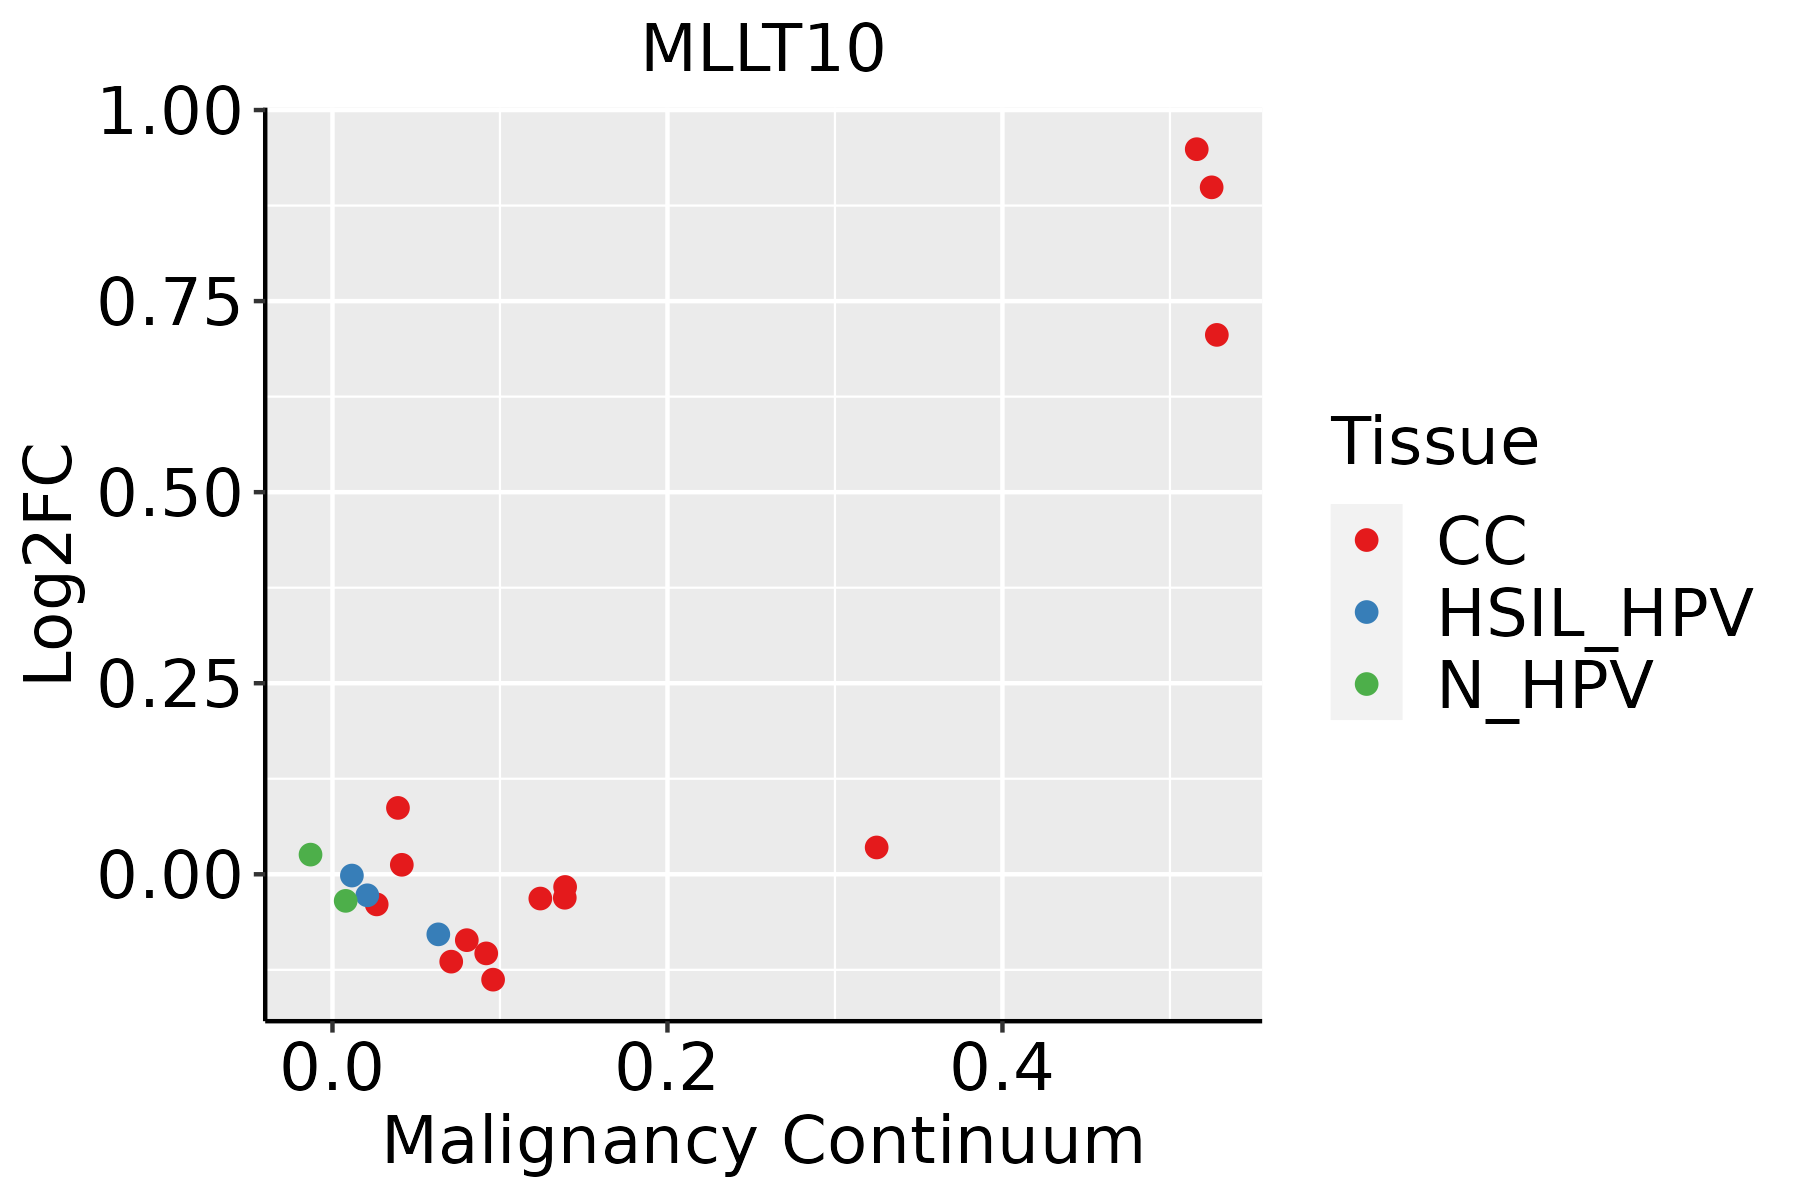 | CC: Cervix cancer |
| HSIL_HPV: HPV-infected high-grade squamous intraepithelial lesions | ||
| N_HPV: HPV-infected normal cervix | ||
| Endometrium |  | AEH: Atypical endometrial hyperplasia |
| EEC: Endometrioid Cancer | ||
| Esophagus | 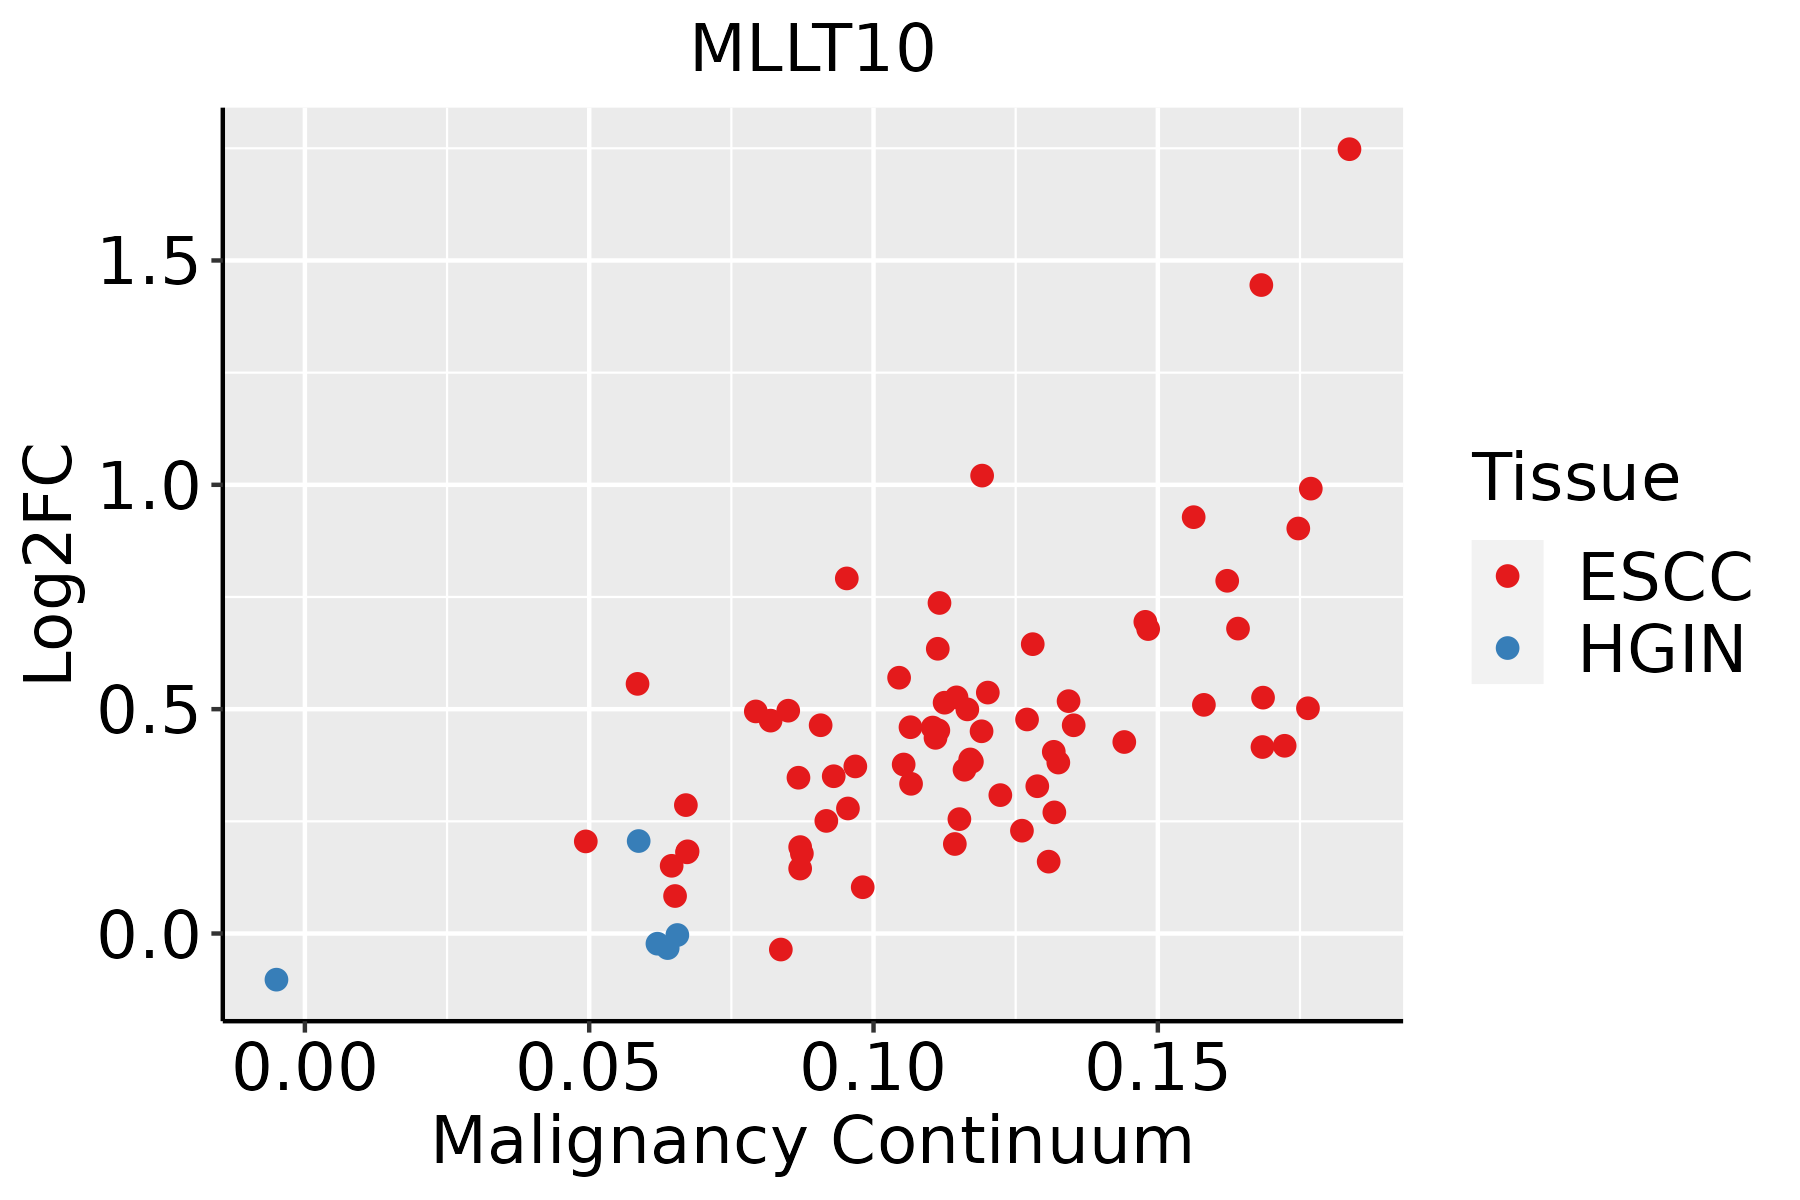 | ESCC: Esophageal squamous cell carcinoma |
| HGIN: High-grade intraepithelial neoplasias | ||
| LGIN: Low-grade intraepithelial neoplasias | ||
| Liver | 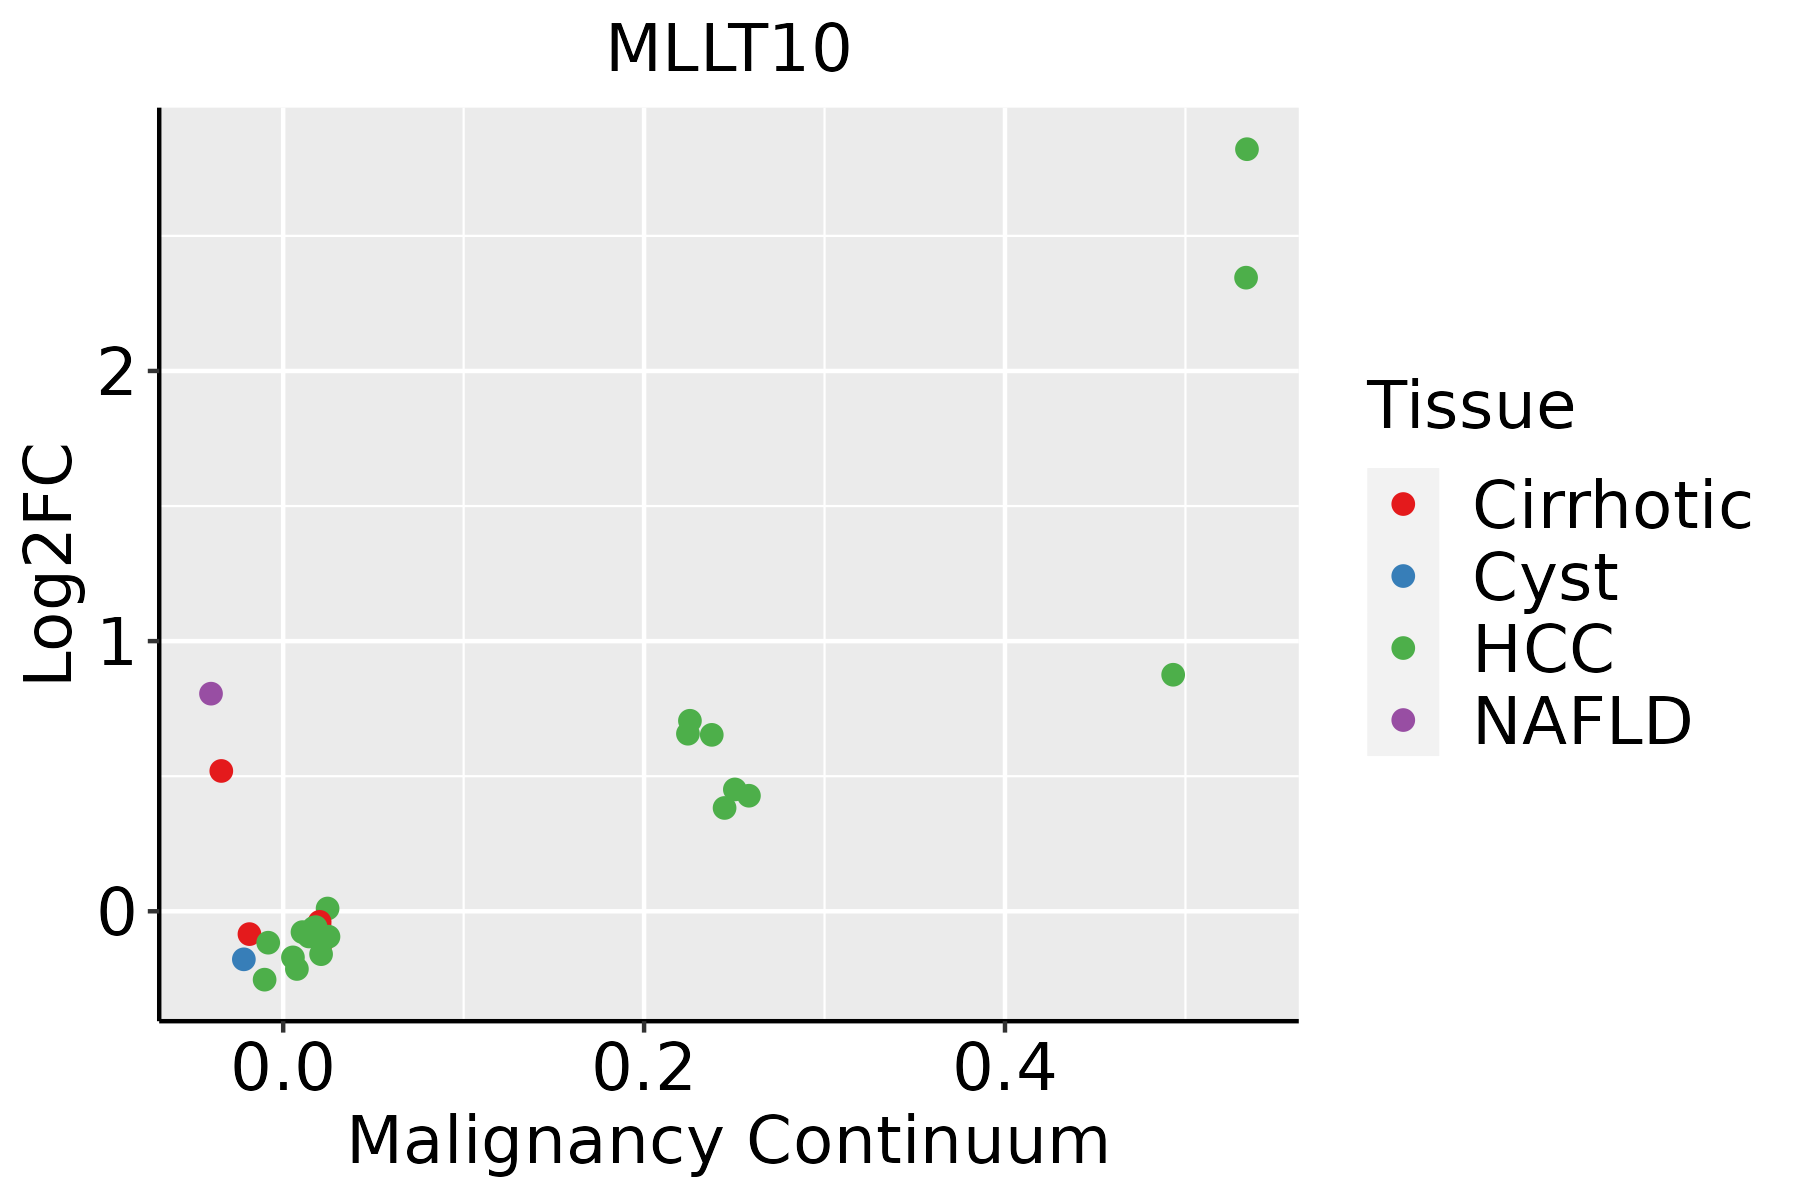 | HCC: Hepatocellular carcinoma |
| NAFLD: Non-alcoholic fatty liver disease | ||
| Lung | 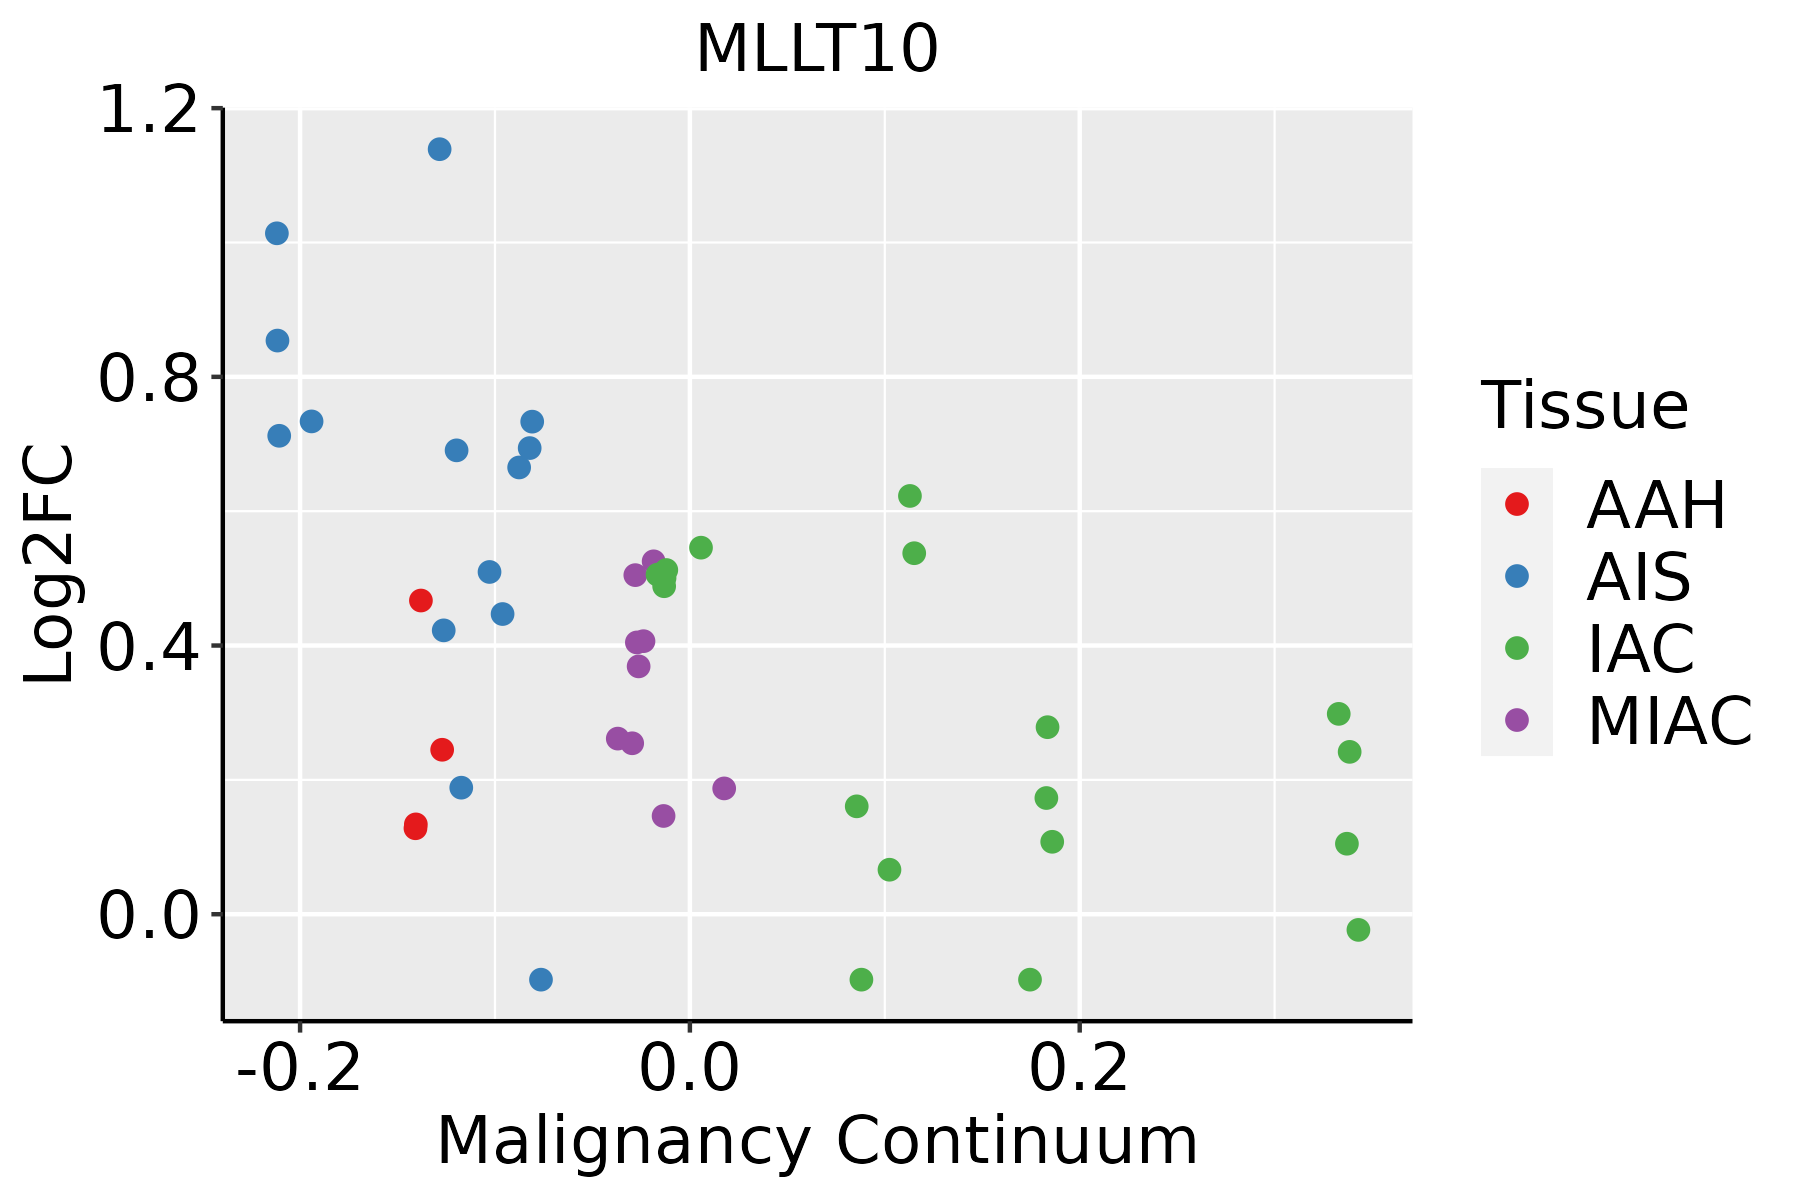 | AAH: Atypical adenomatous hyperplasia |
| AIS: Adenocarcinoma in situ | ||
| IAC: Invasive lung adenocarcinoma | ||
| MIA: Minimally invasive adenocarcinoma | ||
| Oral Cavity |  | EOLP: Erosive Oral lichen planus |
| LP: leukoplakia | ||
| NEOLP: Non-erosive oral lichen planus | ||
| OSCC: Oral squamous cell carcinoma | ||
| Thyroid | 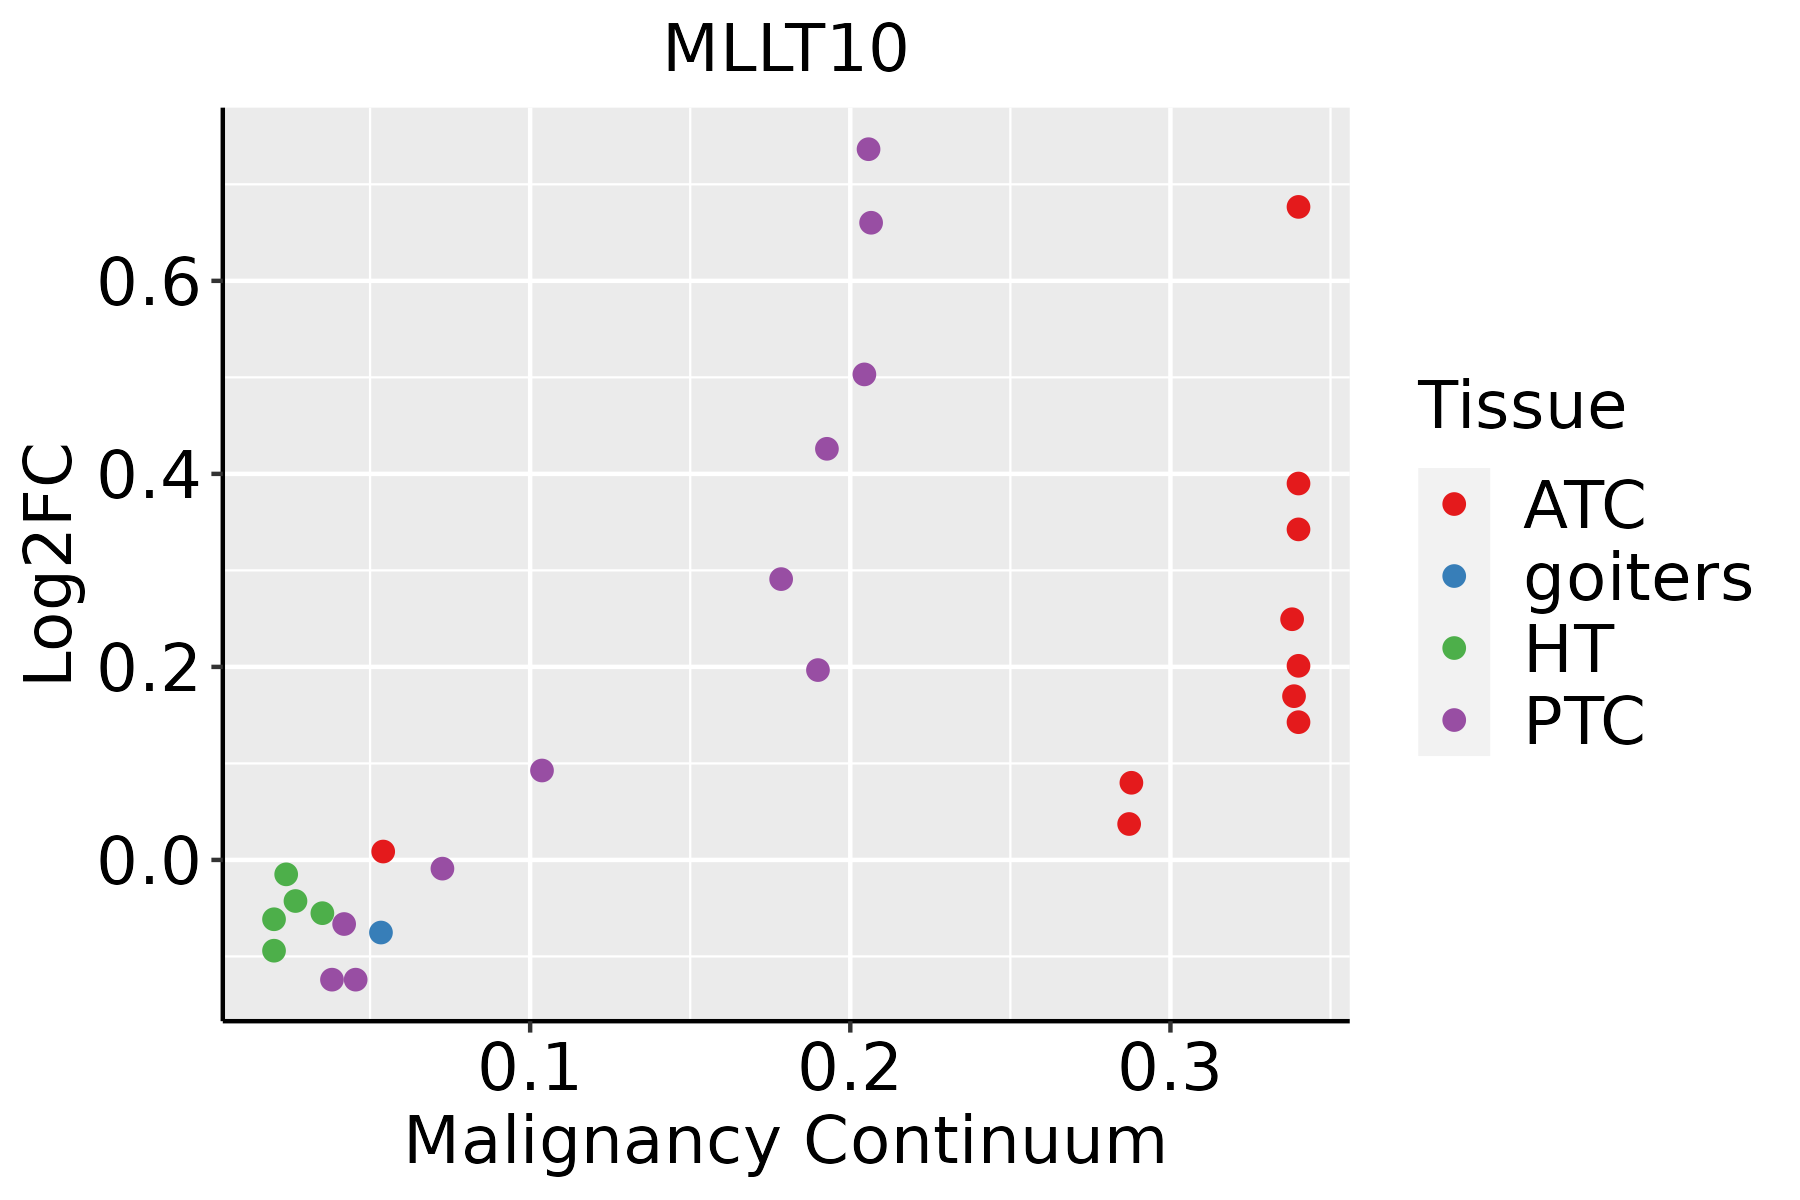 | ATC: Anaplastic thyroid cancer |
| HT: Hashimoto's thyroiditis | ||
| PTC: Papillary thyroid cancer |
| ∗log2FC in expression of this searched gene in stem-like cells from each diseased tissue sample relative to stem-like cells in normal samples in each tissue plotted against the malignancy continuum. Samples are colored based on if they are from different disease stage. |
Top |
Malignant transformation related pathway analysis |
| Find out the enriched GO biological processes and KEGG pathways involved in transition from healthy to precancer to cancer |
| Tissue | Disease Stage | Enriched GO biological Processes |
| Colorectum | AD |  |
| Colorectum | SER |  |
| Colorectum | MSS |  |
| Colorectum | MSI-H |  |
| Colorectum | FAP |  |
| ∗Top 15 enriched GO BP terms are showed in the bar plot of each disease state in each tissue. Each row represents a significant GO biological process which is colored according to the -log10(p.adjust). |
| Page: 1 2 3 4 5 6 7 8 9 |
| GO ID | Tissue | Disease Stage | Description | Gene Ratio | Bg Ratio | pvalue | p.adjust | Count |
| Page: 1 |
| Pathway ID | Tissue | Disease Stage | Description | Gene Ratio | Bg Ratio | pvalue | p.adjust | qvalue | Count |
| Page: 1 |
Top |
Cell-cell communication analysis |
| Identification of potential cell-cell interactions between two cell types and their ligand-receptor pairs for different disease states |
| Ligand | Receptor | LRpair | Pathway | Tissue | Disease Stage |
| Page: 1 |
Top |
Single-cell gene regulatory network inference analysis |
| Find out the significant the regulons (TFs) and the target genes of each regulon across cell types for different disease states |
| TF | Cell Type | Tissue | Disease Stage | Target Gene | RSS | Regulon Activity |
| ∗The dot plots of a searched regulon are shown for all cell subpopulations in each disease state of each tissue based on the regulon specific score inferred using pySCENIC and by calculating the average expression. |
| Page: 1 |
Top |
Somatic mutation of malignant transformation related genes |
| Annotation of somatic variants for genes involved in malignant transformation |
| Hugo Symbol | Variant Class | Variant Classification | dbSNP RS | HGVSc | HGVSp | HGVSp Short | SWISSPROT | BIOTYPE | SIFT | PolyPhen | Tumor Sample Barcode | Tissue | Histology | Sex | Age | Stage | Therapy Types | Drugs | Outcome |
| MLLT10 | SNV | Missense_Mutation | c.2063G>T | p.Arg688Leu | p.R688L | P55197 | protein_coding | tolerated(0.07) | probably_damaging(0.982) | TCGA-3C-AALJ-01 | Breast | breast invasive carcinoma | Female | <65 | I/II | Chemotherapy | doxorubicin | SD | |
| MLLT10 | SNV | Missense_Mutation | c.1265N>T | p.Ser422Leu | p.S422L | P55197 | protein_coding | deleterious(0.01) | benign(0.003) | TCGA-A8-A06Q-01 | Breast | breast invasive carcinoma | Female | <65 | III/IV | Unknown | Unknown | SD | |
| MLLT10 | SNV | Missense_Mutation | c.2377C>A | p.His793Asn | p.H793N | P55197 | protein_coding | tolerated(0.2) | benign(0.015) | TCGA-AC-A23H-01 | Breast | breast invasive carcinoma | Female | >=65 | I/II | Unknown | Unknown | PD | |
| MLLT10 | SNV | Missense_Mutation | c.2539C>G | p.Leu847Val | p.L847V | P55197 | protein_coding | tolerated(0.55) | possibly_damaging(0.672) | TCGA-AC-A23H-01 | Breast | breast invasive carcinoma | Female | >=65 | I/II | Unknown | Unknown | PD | |
| MLLT10 | SNV | Missense_Mutation | novel | c.514C>G | p.Gln172Glu | p.Q172E | P55197 | protein_coding | deleterious(0) | probably_damaging(0.926) | TCGA-BH-A0B6-01 | Breast | breast invasive carcinoma | Female | <65 | I/II | Unknown | Unknown | SD |
| MLLT10 | SNV | Missense_Mutation | c.2053N>T | p.Leu685Phe | p.L685F | P55197 | protein_coding | deleterious(0.04) | possibly_damaging(0.637) | TCGA-D8-A140-01 | Breast | breast invasive carcinoma | Female | <65 | I/II | Chemotherapy | doxorubicin+cyclophosphamid | SD | |
| MLLT10 | SNV | Missense_Mutation | c.983N>A | p.Arg328Lys | p.R328K | P55197 | protein_coding | tolerated(0.42) | probably_damaging(0.931) | TCGA-E2-A14O-01 | Breast | breast invasive carcinoma | Female | >=65 | III/IV | Hormone Therapy | arimidex | SD | |
| MLLT10 | SNV | Missense_Mutation | novel | c.549N>G | p.Asn183Lys | p.N183K | P55197 | protein_coding | tolerated(1) | possibly_damaging(0.906) | TCGA-E2-A2P5-01 | Breast | breast invasive carcinoma | Female | >=65 | III/IV | Hormone Therapy | arimidex | PD |
| MLLT10 | SNV | Missense_Mutation | c.1367C>G | p.Ser456Cys | p.S456C | P55197 | protein_coding | tolerated(0.05) | probably_damaging(0.981) | TCGA-EW-A1PB-01 | Breast | breast invasive carcinoma | Female | >=65 | III/IV | Unknown | Unknown | SD | |
| MLLT10 | SNV | Missense_Mutation | c.2063G>C | p.Arg688Pro | p.R688P | P55197 | protein_coding | deleterious(0.04) | probably_damaging(0.992) | TCGA-GM-A2DD-01 | Breast | breast invasive carcinoma | Female | <65 | I/II | Chemotherapy | fluorouracil | CR |
| Page: 1 2 3 4 5 6 7 8 9 10 11 |
Top |
Related drugs of malignant transformation related genes |
| Identification of chemicals and drugs interact with genes involved in malignant transfromation |
| (DGIdb 4.0) |
| Entrez ID | Symbol | Category | Interaction Types | Drug Claim Name | Drug Name | PMIDs |
| Page: 1 |

Copyright 2023-Present -The University of Texas Health Science Center at Houston |