
|
|||||
|
 | |
| |
| |
| |
| |
| |
|
Gene: MLLT1 |
Gene summary for MLLT1 |
| Gene information | Species | Human | Gene symbol | MLLT1 | Gene ID | 4298 |
| Gene name | MLLT1 super elongation complex subunit | |
| Gene Alias | ENL | |
| Cytomap | 19p13.3 | |
| Gene Type | protein-coding | GO ID | GO:0001932 | UniProtAcc | Q03111 |
Top |
Malignant transformation analysis |
| Identification of the aberrant gene expression in precancerous and cancerous lesions by comparing the gene expression of stem-like cells in diseased tissues with normal stem cells |
| Entrez ID | Symbol | Replicates | Species | Organ | Tissue | Adj P-value | Log2FC | Malignancy |
| 4298 | MLLT1 | C04 | Human | Oral cavity | OSCC | 1.11e-14 | 5.36e-01 | 0.2633 |
| 4298 | MLLT1 | C21 | Human | Oral cavity | OSCC | 6.56e-11 | 3.34e-01 | 0.2678 |
| 4298 | MLLT1 | C30 | Human | Oral cavity | OSCC | 4.52e-26 | 8.09e-01 | 0.3055 |
| 4298 | MLLT1 | C43 | Human | Oral cavity | OSCC | 4.92e-14 | 2.20e-01 | 0.1704 |
| 4298 | MLLT1 | C46 | Human | Oral cavity | OSCC | 1.29e-12 | 2.21e-01 | 0.1673 |
| 4298 | MLLT1 | C51 | Human | Oral cavity | OSCC | 1.33e-05 | 3.60e-01 | 0.2674 |
| 4298 | MLLT1 | C08 | Human | Oral cavity | OSCC | 2.24e-11 | 2.01e-01 | 0.1919 |
| 4298 | MLLT1 | C09 | Human | Oral cavity | OSCC | 8.64e-08 | 2.85e-01 | 0.1431 |
| 4298 | MLLT1 | LN46 | Human | Oral cavity | OSCC | 4.02e-07 | 2.54e-01 | 0.1666 |
| 4298 | MLLT1 | SYSMH1 | Human | Oral cavity | OSCC | 6.34e-12 | 1.81e-01 | 0.1127 |
| 4298 | MLLT1 | SYSMH2 | Human | Oral cavity | OSCC | 8.41e-08 | 2.04e-01 | 0.2326 |
| 4298 | MLLT1 | SYSMH3 | Human | Oral cavity | OSCC | 3.41e-17 | 4.24e-01 | 0.2442 |
| 4298 | MLLT1 | SYSMH4 | Human | Oral cavity | OSCC | 1.87e-04 | 3.52e-02 | 0.1226 |
| 4298 | MLLT1 | SYSMH5 | Human | Oral cavity | OSCC | 8.19e-04 | 1.09e-01 | 0.0647 |
| 4298 | MLLT1 | male-WTA | Human | Thyroid | PTC | 1.60e-32 | 2.10e-01 | 0.1037 |
| 4298 | MLLT1 | PTC01 | Human | Thyroid | PTC | 6.90e-08 | -2.30e-02 | 0.1899 |
| 4298 | MLLT1 | PTC04 | Human | Thyroid | PTC | 1.01e-06 | 7.93e-02 | 0.1927 |
| 4298 | MLLT1 | PTC05 | Human | Thyroid | PTC | 7.10e-10 | 3.18e-01 | 0.2065 |
| 4298 | MLLT1 | PTC06 | Human | Thyroid | PTC | 3.27e-13 | 2.79e-01 | 0.2057 |
| 4298 | MLLT1 | PTC07 | Human | Thyroid | PTC | 1.73e-26 | 1.50e-01 | 0.2044 |
| Page: 1 2 |
| Tissue | Expression Dynamics | Abbreviation |
| Oral Cavity |  | EOLP: Erosive Oral lichen planus |
| LP: leukoplakia | ||
| NEOLP: Non-erosive oral lichen planus | ||
| OSCC: Oral squamous cell carcinoma | ||
| Thyroid | 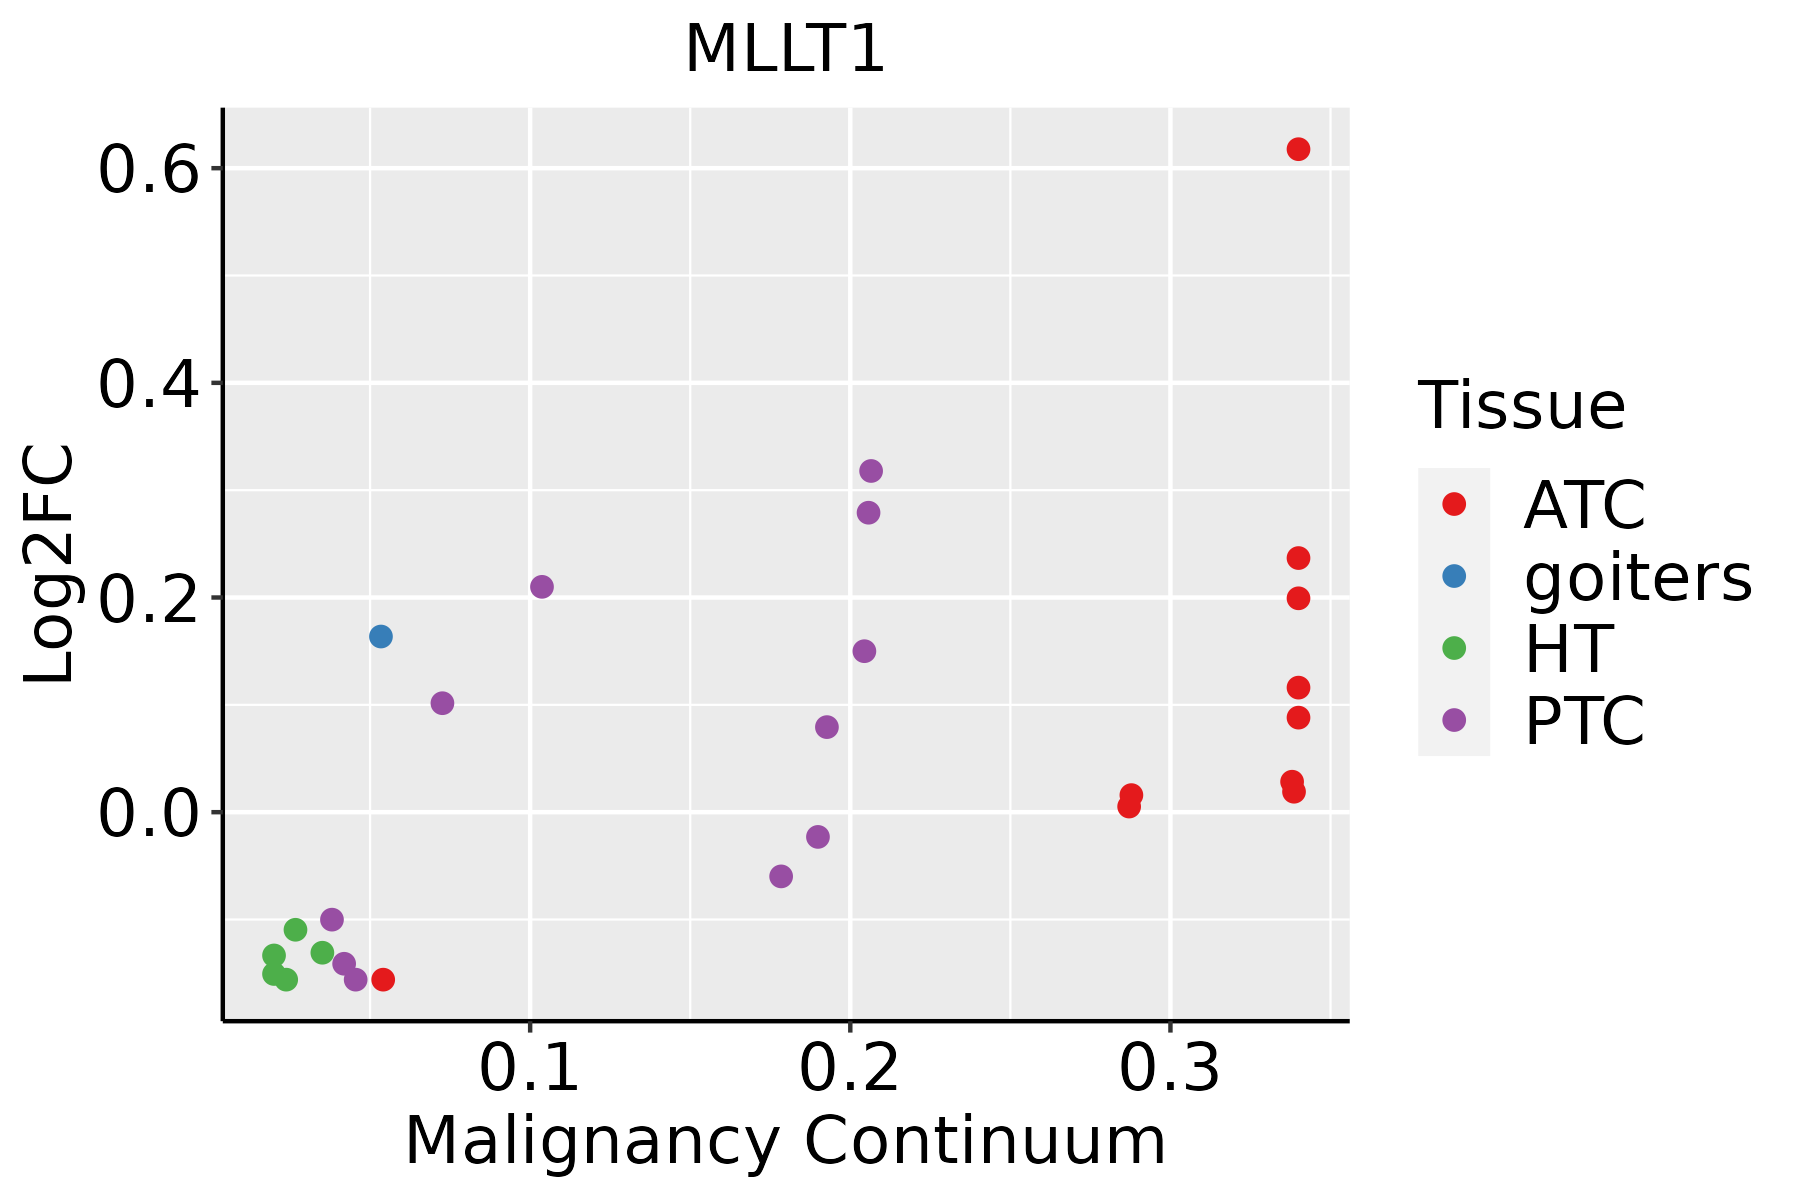 | ATC: Anaplastic thyroid cancer |
| HT: Hashimoto's thyroiditis | ||
| PTC: Papillary thyroid cancer |
| ∗log2FC in expression of this searched gene in stem-like cells from each diseased tissue sample relative to stem-like cells in normal samples in each tissue plotted against the malignancy continuum. Samples are colored based on if they are from different disease stage. |
Top |
Malignant transformation related pathway analysis |
| Find out the enriched GO biological processes and KEGG pathways involved in transition from healthy to precancer to cancer |
| Tissue | Disease Stage | Enriched GO biological Processes |
| Colorectum | AD |  |
| Colorectum | SER |  |
| Colorectum | MSS |  |
| Colorectum | MSI-H |  |
| Colorectum | FAP |  |
| ∗Top 15 enriched GO BP terms are showed in the bar plot of each disease state in each tissue. Each row represents a significant GO biological process which is colored according to the -log10(p.adjust). |
| Page: 1 2 3 4 5 6 7 8 9 |
| GO ID | Tissue | Disease Stage | Description | Gene Ratio | Bg Ratio | pvalue | p.adjust | Count |
| GO:0097193111 | Esophagus | ESCC | intrinsic apoptotic signaling pathway | 222/8552 | 288/18723 | 5.87e-28 | 2.02e-25 | 222 |
| GO:0097191111 | Esophagus | ESCC | extrinsic apoptotic signaling pathway | 159/8552 | 219/18723 | 4.12e-16 | 2.94e-14 | 159 |
| GO:0010821110 | Esophagus | ESCC | regulation of mitochondrion organization | 107/8552 | 144/18723 | 2.31e-12 | 9.41e-11 | 107 |
| GO:0008637110 | Esophagus | ESCC | apoptotic mitochondrial changes | 83/8552 | 107/18723 | 1.43e-11 | 5.08e-10 | 83 |
| GO:001082215 | Esophagus | ESCC | positive regulation of mitochondrion organization | 58/8552 | 74/18723 | 8.55e-09 | 1.73e-07 | 58 |
| GO:000183619 | Esophagus | ESCC | release of cytochrome c from mitochondria | 47/8552 | 59/18723 | 9.02e-08 | 1.51e-06 | 47 |
| GO:009019914 | Esophagus | ESCC | regulation of release of cytochrome c from mitochondria | 38/8552 | 48/18723 | 2.11e-06 | 2.43e-05 | 38 |
| GO:005188110 | Esophagus | ESCC | regulation of mitochondrial membrane potential | 51/8552 | 74/18723 | 4.42e-05 | 3.51e-04 | 51 |
| GO:00902004 | Esophagus | ESCC | positive regulation of release of cytochrome c from mitochondria | 22/8552 | 28/18723 | 3.95e-04 | 2.26e-03 | 22 |
| GO:009719322 | Liver | HCC | intrinsic apoptotic signaling pathway | 184/7958 | 288/18723 | 1.50e-13 | 8.32e-12 | 184 |
| GO:009719122 | Liver | HCC | extrinsic apoptotic signaling pathway | 143/7958 | 219/18723 | 6.99e-12 | 2.97e-10 | 143 |
| GO:001082112 | Liver | HCC | regulation of mitochondrion organization | 96/7958 | 144/18723 | 3.82e-09 | 1.02e-07 | 96 |
| GO:000863712 | Liver | HCC | apoptotic mitochondrial changes | 70/7958 | 107/18723 | 1.39e-06 | 2.01e-05 | 70 |
| GO:001082211 | Liver | HCC | positive regulation of mitochondrion organization | 48/7958 | 74/18723 | 8.50e-05 | 7.46e-04 | 48 |
| GO:000183612 | Liver | HCC | release of cytochrome c from mitochondria | 39/7958 | 59/18723 | 2.14e-04 | 1.63e-03 | 39 |
| GO:005188112 | Liver | HCC | regulation of mitochondrial membrane potential | 45/7958 | 74/18723 | 1.13e-03 | 6.43e-03 | 45 |
| GO:00901995 | Liver | HCC | regulation of release of cytochrome c from mitochondria | 31/7958 | 48/18723 | 1.66e-03 | 8.71e-03 | 31 |
| GO:009719320 | Oral cavity | OSCC | intrinsic apoptotic signaling pathway | 202/7305 | 288/18723 | 4.64e-27 | 1.73e-24 | 202 |
| GO:009719120 | Oral cavity | OSCC | extrinsic apoptotic signaling pathway | 142/7305 | 219/18723 | 7.34e-15 | 4.55e-13 | 142 |
| GO:005134820 | Oral cavity | OSCC | negative regulation of transferase activity | 165/7305 | 268/18723 | 5.02e-14 | 2.74e-12 | 165 |
| Page: 1 2 3 4 5 |
| Pathway ID | Tissue | Disease Stage | Description | Gene Ratio | Bg Ratio | pvalue | p.adjust | qvalue | Count |
| hsa032508 | Oral cavity | OSCC | Viral life cycle - HIV-1 | 45/3704 | 63/8465 | 7.62e-06 | 3.59e-05 | 1.83e-05 | 45 |
| hsa0325013 | Oral cavity | OSCC | Viral life cycle - HIV-1 | 45/3704 | 63/8465 | 7.62e-06 | 3.59e-05 | 1.83e-05 | 45 |
| Page: 1 |
Top |
Cell-cell communication analysis |
| Identification of potential cell-cell interactions between two cell types and their ligand-receptor pairs for different disease states |
| Ligand | Receptor | LRpair | Pathway | Tissue | Disease Stage |
| Page: 1 |
Top |
Single-cell gene regulatory network inference analysis |
| Find out the significant the regulons (TFs) and the target genes of each regulon across cell types for different disease states |
| TF | Cell Type | Tissue | Disease Stage | Target Gene | RSS | Regulon Activity |
| ∗The dot plots of a searched regulon are shown for all cell subpopulations in each disease state of each tissue based on the regulon specific score inferred using pySCENIC and by calculating the average expression. |
| Page: 1 |
Top |
Somatic mutation of malignant transformation related genes |
| Annotation of somatic variants for genes involved in malignant transformation |
| Hugo Symbol | Variant Class | Variant Classification | dbSNP RS | HGVSc | HGVSp | HGVSp Short | SWISSPROT | BIOTYPE | SIFT | PolyPhen | Tumor Sample Barcode | Tissue | Histology | Sex | Age | Stage | Therapy Types | Drugs | Outcome |
| MLLT1 | SNV | Missense_Mutation | novel | c.101T>G | p.Val34Gly | p.V34G | Q03111 | protein_coding | deleterious(0) | probably_damaging(0.991) | TCGA-A8-A096-01 | Breast | breast invasive carcinoma | Female | >=65 | I/II | Unknown | Unknown | SD |
| MLLT1 | SNV | Missense_Mutation | novel | c.1010N>C | p.Arg337Thr | p.R337T | Q03111 | protein_coding | tolerated(0.11) | benign(0.015) | TCGA-C8-A1HE-01 | Breast | breast invasive carcinoma | Female | <65 | I/II | Unknown | Unknown | SD |
| MLLT1 | SNV | Missense_Mutation | c.76N>C | p.Glu26Gln | p.E26Q | Q03111 | protein_coding | deleterious(0.03) | possibly_damaging(0.522) | TCGA-D8-A1JP-01 | Breast | breast invasive carcinoma | Female | >=65 | I/II | Hormone Therapy | tamoxiphen | SD | |
| MLLT1 | SNV | Missense_Mutation | rs762239820 | c.974N>T | p.Ser325Leu | p.S325L | Q03111 | protein_coding | tolerated(0.27) | benign(0.017) | TCGA-A6-2686-01 | Colorectum | colon adenocarcinoma | Female | >=65 | I/II | Unknown | Unknown | SD |
| MLLT1 | SNV | Missense_Mutation | c.142N>A | p.Val48Met | p.V48M | Q03111 | protein_coding | deleterious(0) | probably_damaging(0.997) | TCGA-A6-2686-01 | Colorectum | colon adenocarcinoma | Female | >=65 | I/II | Unknown | Unknown | SD | |
| MLLT1 | SNV | Missense_Mutation | c.332N>G | p.Asn111Ser | p.N111S | Q03111 | protein_coding | deleterious(0.03) | benign(0.28) | TCGA-AA-3715-01 | Colorectum | colon adenocarcinoma | Male | >=65 | I/II | Unknown | Unknown | PD | |
| MLLT1 | SNV | Missense_Mutation | c.49G>A | p.Ala17Thr | p.A17T | Q03111 | protein_coding | deleterious(0) | probably_damaging(0.949) | TCGA-AA-3811-01 | Colorectum | colon adenocarcinoma | Female | >=65 | III/IV | Unknown | Unknown | PD | |
| MLLT1 | SNV | Missense_Mutation | rs759257032 | c.617G>A | p.Arg206His | p.R206H | Q03111 | protein_coding | tolerated(0.14) | probably_damaging(0.991) | TCGA-AA-A010-01 | Colorectum | colon adenocarcinoma | Female | <65 | I/II | Chemotherapy | folinic | CR |
| MLLT1 | SNV | Missense_Mutation | c.538N>A | p.Gly180Ser | p.G180S | Q03111 | protein_coding | tolerated(0.14) | benign(0.067) | TCGA-AZ-6601-01 | Colorectum | colon adenocarcinoma | Male | >=65 | I/II | Unknown | Unknown | PD | |
| MLLT1 | SNV | Missense_Mutation | c.1148N>T | p.Ser383Leu | p.S383L | Q03111 | protein_coding | deleterious(0) | benign(0.062) | TCGA-D5-6922-01 | Colorectum | colon adenocarcinoma | Male | >=65 | III/IV | Unknown | Unknown | SD |
| Page: 1 2 3 4 5 6 |
Top |
Related drugs of malignant transformation related genes |
| Identification of chemicals and drugs interact with genes involved in malignant transfromation |
| (DGIdb 4.0) |
| Entrez ID | Symbol | Category | Interaction Types | Drug Claim Name | Drug Name | PMIDs |
| Page: 1 |

Copyright 2023-Present -The University of Texas Health Science Center at Houston |