
|
|||||
|
 | |
| |
| |
| |
| |
| |
|
Gene: MLKL |
Gene summary for MLKL |
| Gene information | Species | Human | Gene symbol | MLKL | Gene ID | 197259 |
| Gene name | mixed lineage kinase domain like pseudokinase | |
| Gene Alias | hMLKL | |
| Cytomap | 16q23.1 | |
| Gene Type | protein-coding | GO ID | GO:0002376 | UniProtAcc | Q8NB16 |
Top |
Malignant transformation analysis |
| Identification of the aberrant gene expression in precancerous and cancerous lesions by comparing the gene expression of stem-like cells in diseased tissues with normal stem cells |
| Entrez ID | Symbol | Replicates | Species | Organ | Tissue | Adj P-value | Log2FC | Malignancy |
| 197259 | MLKL | P4T-E | Human | Esophagus | ESCC | 1.18e-02 | 1.52e-01 | 0.1323 |
| 197259 | MLKL | P11T-E | Human | Esophagus | ESCC | 1.93e-05 | 2.91e-01 | 0.1426 |
| 197259 | MLKL | P20T-E | Human | Esophagus | ESCC | 1.15e-03 | 9.61e-02 | 0.1124 |
| 197259 | MLKL | P21T-E | Human | Esophagus | ESCC | 1.66e-06 | 2.36e-01 | 0.1617 |
| 197259 | MLKL | P23T-E | Human | Esophagus | ESCC | 2.29e-03 | 1.47e-01 | 0.108 |
| 197259 | MLKL | P24T-E | Human | Esophagus | ESCC | 1.71e-12 | 1.25e-01 | 0.1287 |
| 197259 | MLKL | P26T-E | Human | Esophagus | ESCC | 8.87e-05 | 8.44e-02 | 0.1276 |
| 197259 | MLKL | P28T-E | Human | Esophagus | ESCC | 4.17e-03 | 1.05e-01 | 0.1149 |
| 197259 | MLKL | P32T-E | Human | Esophagus | ESCC | 4.71e-05 | 7.60e-02 | 0.1666 |
| 197259 | MLKL | P36T-E | Human | Esophagus | ESCC | 8.81e-08 | 1.96e-01 | 0.1187 |
| 197259 | MLKL | P48T-E | Human | Esophagus | ESCC | 2.19e-03 | 4.50e-02 | 0.0959 |
| 197259 | MLKL | P52T-E | Human | Esophagus | ESCC | 4.45e-12 | 3.41e-01 | 0.1555 |
| 197259 | MLKL | P62T-E | Human | Esophagus | ESCC | 3.56e-14 | 3.09e-01 | 0.1302 |
| 197259 | MLKL | P74T-E | Human | Esophagus | ESCC | 2.73e-02 | 1.59e-01 | 0.1479 |
| 197259 | MLKL | P75T-E | Human | Esophagus | ESCC | 2.39e-03 | 2.93e-01 | 0.1125 |
| 197259 | MLKL | P76T-E | Human | Esophagus | ESCC | 1.56e-06 | 8.48e-02 | 0.1207 |
| 197259 | MLKL | P80T-E | Human | Esophagus | ESCC | 4.27e-13 | 3.01e-01 | 0.155 |
| 197259 | MLKL | P83T-E | Human | Esophagus | ESCC | 3.10e-18 | 6.01e-01 | 0.1738 |
| 197259 | MLKL | P89T-E | Human | Esophagus | ESCC | 6.22e-09 | 5.13e-01 | 0.1752 |
| 197259 | MLKL | P107T-E | Human | Esophagus | ESCC | 1.12e-06 | 1.85e-01 | 0.171 |
| Page: 1 2 |
| Tissue | Expression Dynamics | Abbreviation |
| Esophagus | 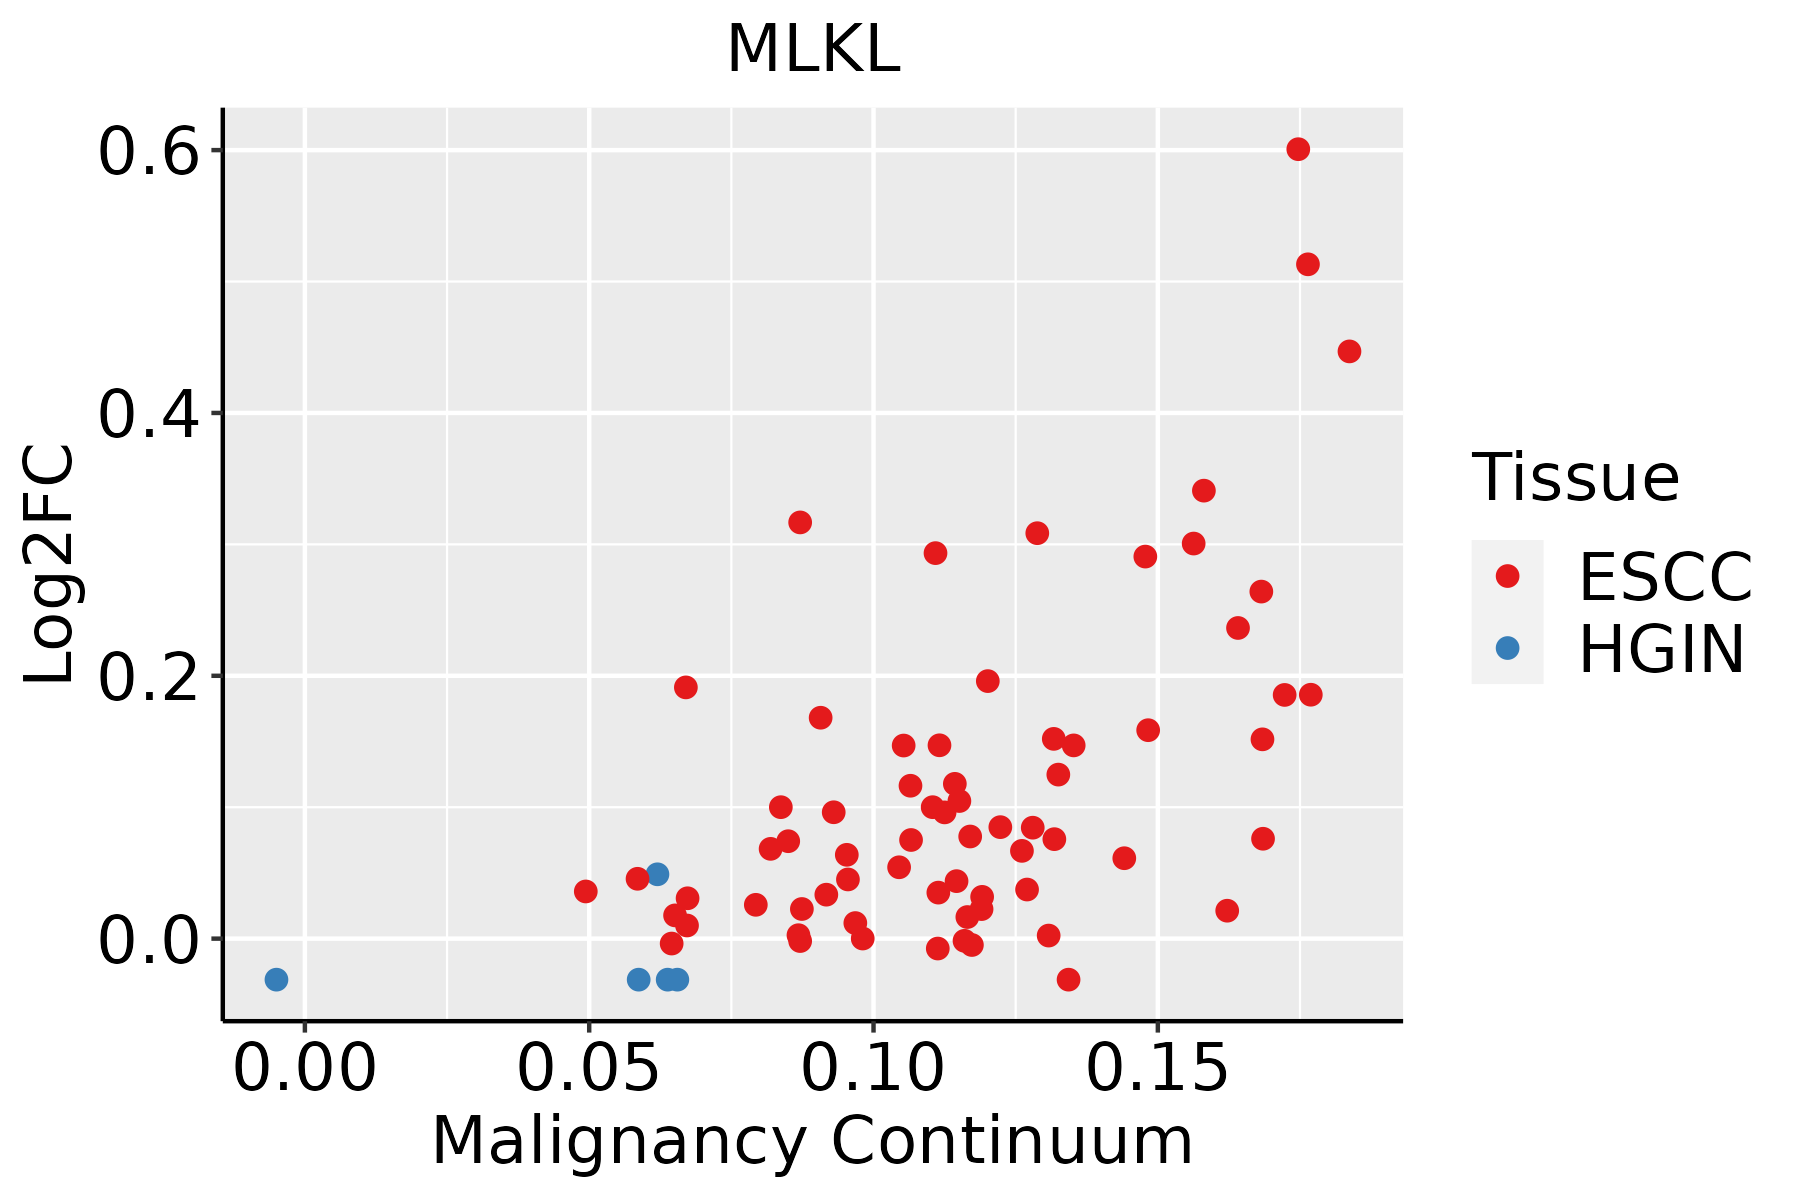 | ESCC: Esophageal squamous cell carcinoma |
| HGIN: High-grade intraepithelial neoplasias | ||
| LGIN: Low-grade intraepithelial neoplasias | ||
| Liver | 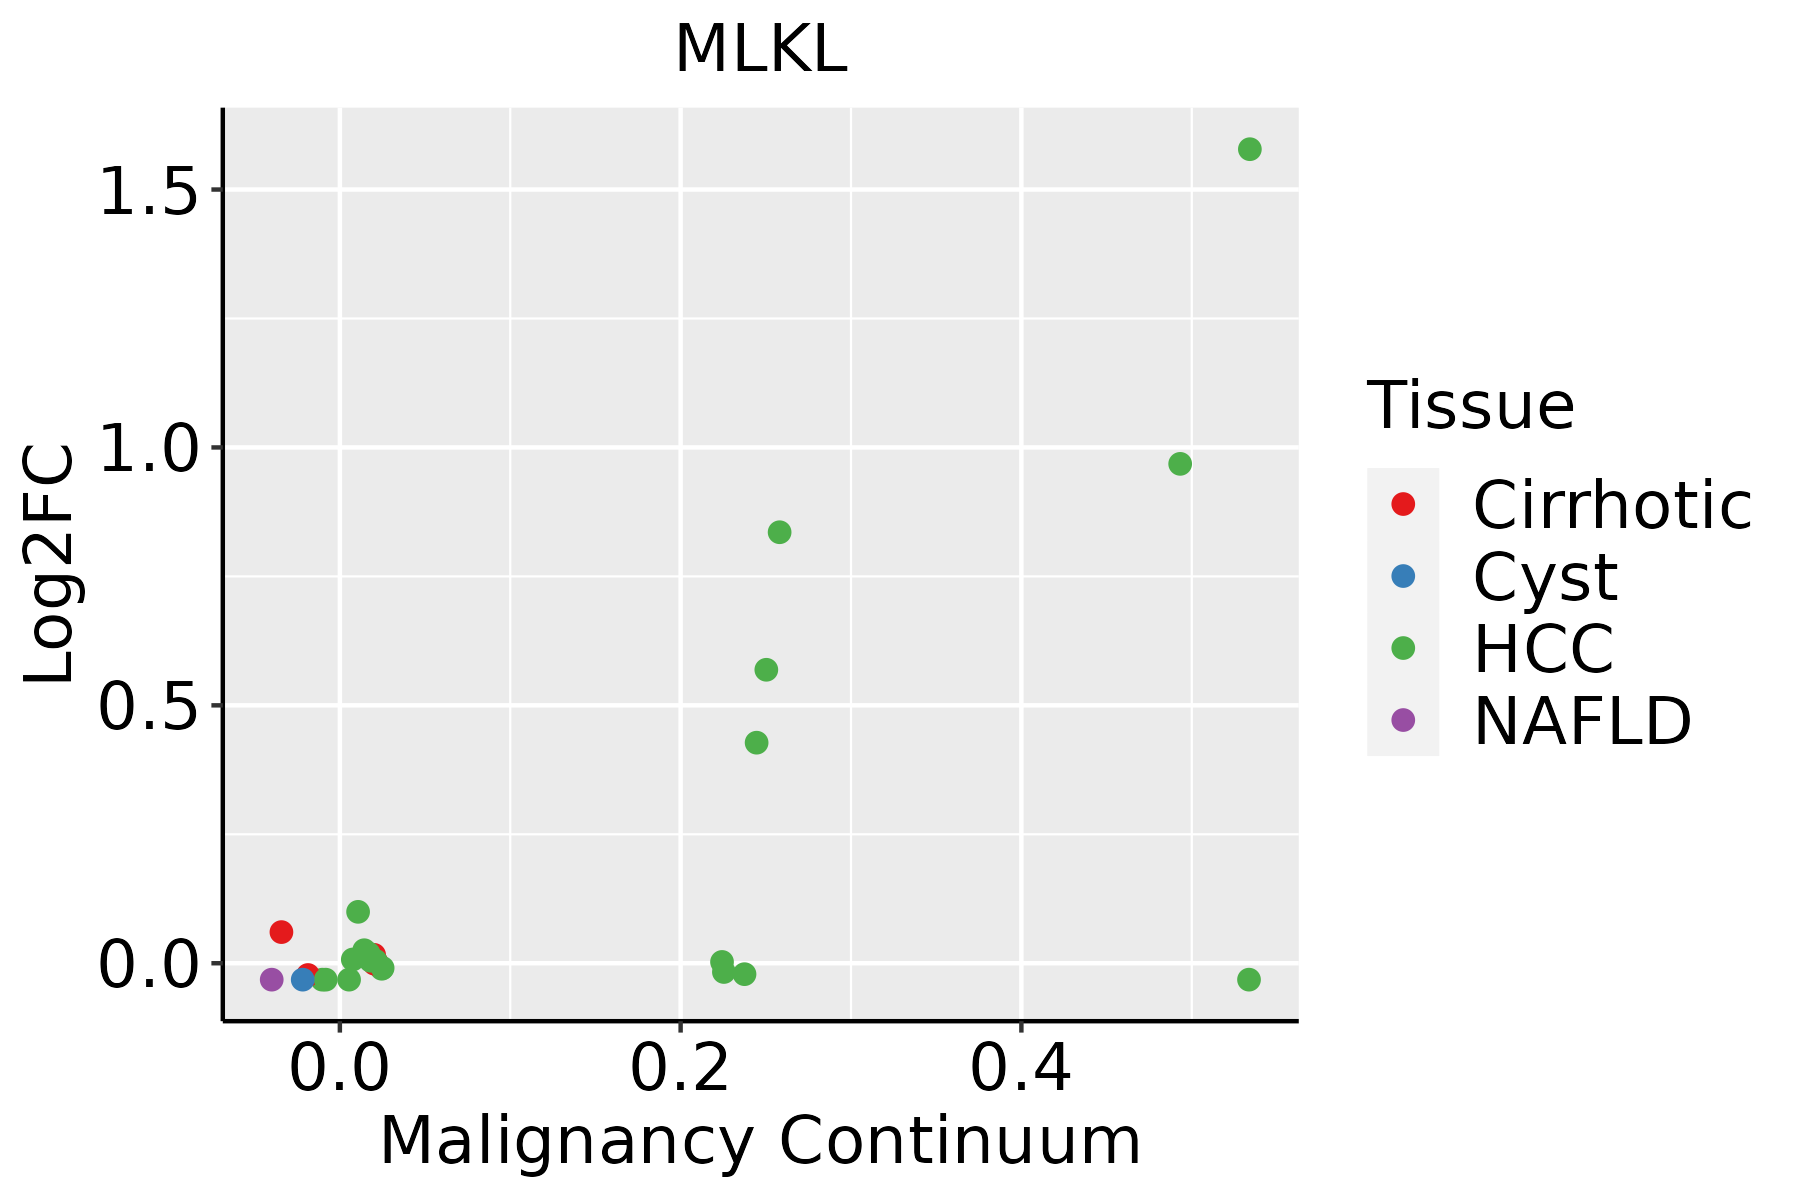 | HCC: Hepatocellular carcinoma |
| NAFLD: Non-alcoholic fatty liver disease |
| ∗log2FC in expression of this searched gene in stem-like cells from each diseased tissue sample relative to stem-like cells in normal samples in each tissue plotted against the malignancy continuum. Samples are colored based on if they are from different disease stage. |
Top |
Malignant transformation related pathway analysis |
| Find out the enriched GO biological processes and KEGG pathways involved in transition from healthy to precancer to cancer |
| Tissue | Disease Stage | Enriched GO biological Processes |
| Colorectum | AD |  |
| Colorectum | SER |  |
| Colorectum | MSS |  |
| Colorectum | MSI-H |  |
| Colorectum | FAP |  |
| ∗Top 15 enriched GO BP terms are showed in the bar plot of each disease state in each tissue. Each row represents a significant GO biological process which is colored according to the -log10(p.adjust). |
| Page: 1 2 3 4 5 6 7 8 9 |
| GO ID | Tissue | Disease Stage | Description | Gene Ratio | Bg Ratio | pvalue | p.adjust | Count |
| GO:000961518 | Esophagus | ESCC | response to virus | 238/8552 | 367/18723 | 6.65e-14 | 3.32e-12 | 238 |
| GO:00516075 | Esophagus | ESCC | defense response to virus | 171/8552 | 265/18723 | 3.91e-10 | 1.05e-08 | 171 |
| GO:01405465 | Esophagus | ESCC | defense response to symbiont | 171/8552 | 265/18723 | 3.91e-10 | 1.05e-08 | 171 |
| GO:00973002 | Esophagus | ESCC | programmed necrotic cell death | 32/8552 | 47/18723 | 1.59e-03 | 7.43e-03 | 32 |
| GO:00512592 | Esophagus | ESCC | protein complex oligomerization | 130/8552 | 238/18723 | 3.29e-03 | 1.36e-02 | 130 |
| GO:00702654 | Esophagus | ESCC | necrotic cell death | 39/8552 | 62/18723 | 4.68e-03 | 1.82e-02 | 39 |
| GO:000961511 | Liver | HCC | response to virus | 210/7958 | 367/18723 | 7.32e-09 | 1.86e-07 | 210 |
| GO:00516071 | Liver | HCC | defense response to virus | 151/7958 | 265/18723 | 1.27e-06 | 1.85e-05 | 151 |
| GO:01405461 | Liver | HCC | defense response to symbiont | 151/7958 | 265/18723 | 1.27e-06 | 1.85e-05 | 151 |
| Page: 1 |
| Pathway ID | Tissue | Disease Stage | Description | Gene Ratio | Bg Ratio | pvalue | p.adjust | qvalue | Count |
| hsa05132211 | Esophagus | ESCC | Salmonella infection | 191/4205 | 249/8465 | 6.51e-19 | 5.45e-17 | 2.79e-17 | 191 |
| hsa0466810 | Esophagus | ESCC | TNF signaling pathway | 89/4205 | 114/8465 | 3.36e-10 | 4.01e-09 | 2.06e-09 | 89 |
| hsa046234 | Esophagus | ESCC | Cytosolic DNA-sensing pathway | 49/4205 | 75/8465 | 4.35e-03 | 1.12e-02 | 5.74e-03 | 49 |
| hsa05132310 | Esophagus | ESCC | Salmonella infection | 191/4205 | 249/8465 | 6.51e-19 | 5.45e-17 | 2.79e-17 | 191 |
| hsa0466817 | Esophagus | ESCC | TNF signaling pathway | 89/4205 | 114/8465 | 3.36e-10 | 4.01e-09 | 2.06e-09 | 89 |
| hsa0462311 | Esophagus | ESCC | Cytosolic DNA-sensing pathway | 49/4205 | 75/8465 | 4.35e-03 | 1.12e-02 | 5.74e-03 | 49 |
| hsa0513242 | Liver | HCC | Salmonella infection | 178/4020 | 249/8465 | 5.90e-15 | 1.98e-13 | 1.10e-13 | 178 |
| hsa046684 | Liver | HCC | TNF signaling pathway | 73/4020 | 114/8465 | 2.53e-04 | 1.19e-03 | 6.63e-04 | 73 |
| hsa0513252 | Liver | HCC | Salmonella infection | 178/4020 | 249/8465 | 5.90e-15 | 1.98e-13 | 1.10e-13 | 178 |
| hsa0466811 | Liver | HCC | TNF signaling pathway | 73/4020 | 114/8465 | 2.53e-04 | 1.19e-03 | 6.63e-04 | 73 |
| Page: 1 |
Top |
Cell-cell communication analysis |
| Identification of potential cell-cell interactions between two cell types and their ligand-receptor pairs for different disease states |
| Ligand | Receptor | LRpair | Pathway | Tissue | Disease Stage |
| Page: 1 |
Top |
Single-cell gene regulatory network inference analysis |
| Find out the significant the regulons (TFs) and the target genes of each regulon across cell types for different disease states |
| TF | Cell Type | Tissue | Disease Stage | Target Gene | RSS | Regulon Activity |
| ∗The dot plots of a searched regulon are shown for all cell subpopulations in each disease state of each tissue based on the regulon specific score inferred using pySCENIC and by calculating the average expression. |
| Page: 1 |
Top |
Somatic mutation of malignant transformation related genes |
| Annotation of somatic variants for genes involved in malignant transformation |
| Hugo Symbol | Variant Class | Variant Classification | dbSNP RS | HGVSc | HGVSp | HGVSp Short | SWISSPROT | BIOTYPE | SIFT | PolyPhen | Tumor Sample Barcode | Tissue | Histology | Sex | Age | Stage | Therapy Types | Drugs | Outcome |
| MLKL | SNV | Missense_Mutation | c.485N>C | p.Leu162Pro | p.L162P | Q8NB16 | protein_coding | tolerated(0.06) | possibly_damaging(0.823) | TCGA-AO-A128-01 | Breast | breast invasive carcinoma | Female | <65 | I/II | Chemotherapy | doxorubicin | SD | |
| MLKL | insertion | In_Frame_Ins | novel | c.576_577insCTTAATAAATATCTTTTTTTGTGTGTGTGTGGAGACGTAGTCTCATTC | p.Gln192_Ile193insLeuAsnLysTyrLeuPheLeuCysValCysGlyAspValValSerPhe | p.Q192_I193insLNKYLFLCVCGDVVSF | Q8NB16 | protein_coding | TCGA-A2-A0EO-01 | Breast | breast invasive carcinoma | Female | <65 | I/II | Hormone Therapy | tamoxiphen | SD | ||
| MLKL | insertion | In_Frame_Ins | novel | c.1348_1349insATTATTTCCTCGATGCAGACTTTTATCTCA | p.Ala450delinsAspTyrPheLeuAspAlaAspPheTyrLeuThr | p.A450delinsDYFLDADFYLT | Q8NB16 | protein_coding | TCGA-AR-A0TY-01 | Breast | breast invasive carcinoma | Female | <65 | I/II | Unspecific | Paclitaxel | PD | ||
| MLKL | SNV | Missense_Mutation | c.287N>C | p.Ile96Thr | p.I96T | Q8NB16 | protein_coding | tolerated(0.27) | benign(0.3) | TCGA-FU-A3HZ-01 | Cervix | cervical & endocervical cancer | Female | <65 | I/II | Chemotherapy | cisplatin | CR | |
| MLKL | SNV | Missense_Mutation | novel | c.753N>G | p.Ile251Met | p.I251M | Q8NB16 | protein_coding | deleterious(0) | possibly_damaging(0.828) | TCGA-IR-A3LK-01 | Cervix | cervical & endocervical cancer | Female | >=65 | I/II | Chemotherapy | cisplatin | PD |
| MLKL | SNV | Missense_Mutation | rs750054698 | c.1133N>T | p.Ser378Leu | p.S378L | Q8NB16 | protein_coding | deleterious(0) | probably_damaging(0.917) | TCGA-Q1-A73P-01 | Cervix | cervical & endocervical cancer | Female | <65 | I/II | Unknown | Unknown | SD |
| MLKL | SNV | Missense_Mutation | novel | c.563T>C | p.Ile188Thr | p.I188T | Q8NB16 | protein_coding | tolerated(0.2) | benign(0.01) | TCGA-5M-AAT6-01 | Colorectum | colon adenocarcinoma | Female | <65 | III/IV | Unknown | Unknown | PD |
| MLKL | SNV | Missense_Mutation | rs377446580 | c.827N>T | p.Pro276Leu | p.P276L | Q8NB16 | protein_coding | deleterious(0.01) | benign(0.117) | TCGA-AA-3663-01 | Colorectum | colon adenocarcinoma | Male | <65 | I/II | Unknown | Unknown | SD |
| MLKL | SNV | Missense_Mutation | rs771880061 | c.811N>T | p.Asp271Tyr | p.D271Y | Q8NB16 | protein_coding | deleterious(0) | probably_damaging(0.923) | TCGA-AA-3939-01 | Colorectum | colon adenocarcinoma | Male | >=65 | I/II | Unknown | Unknown | SD |
| MLKL | SNV | Missense_Mutation | rs201376894 | c.275G>A | p.Ser92Asn | p.S92N | Q8NB16 | protein_coding | tolerated(0.54) | benign(0.01) | TCGA-AZ-4615-01 | Colorectum | colon adenocarcinoma | Male | >=65 | III/IV | Chemotherapy | xeloda | PD |
| Page: 1 2 3 4 5 |
Top |
Related drugs of malignant transformation related genes |
| Identification of chemicals and drugs interact with genes involved in malignant transfromation |
| (DGIdb 4.0) |
| Entrez ID | Symbol | Category | Interaction Types | Drug Claim Name | Drug Name | PMIDs |
| 197259 | MLKL | ENZYME, DRUGGABLE GENOME, SERINE THREONINE KINASE, KINASE | inhibitor | 336446900 |
| Page: 1 |

Copyright 2023-Present -The University of Texas Health Science Center at Houston |