
|
|||||
|
 | |
| |
| |
| |
| |
| |
|
Gene: MLH3 |
Gene summary for MLH3 |
| Gene information | Species | Human | Gene symbol | MLH3 | Gene ID | 27030 |
| Gene name | mutL homolog 3 | |
| Gene Alias | HNPCC7 | |
| Cytomap | 14q24.3 | |
| Gene Type | protein-coding | GO ID | GO:0000003 | UniProtAcc | Q9UHC1 |
Top |
Malignant transformation analysis |
| Identification of the aberrant gene expression in precancerous and cancerous lesions by comparing the gene expression of stem-like cells in diseased tissues with normal stem cells |
| Entrez ID | Symbol | Replicates | Species | Organ | Tissue | Adj P-value | Log2FC | Malignancy |
| 27030 | MLH3 | HTA11_3410_2000001011 | Human | Colorectum | AD | 6.27e-14 | -4.57e-01 | 0.0155 |
| 27030 | MLH3 | HTA11_2487_2000001011 | Human | Colorectum | SER | 3.38e-05 | -4.11e-01 | -0.1808 |
| 27030 | MLH3 | HTA11_78_2000001011 | Human | Colorectum | AD | 7.73e-03 | -2.84e-01 | -0.1088 |
| 27030 | MLH3 | HTA11_3361_2000001011 | Human | Colorectum | AD | 1.93e-07 | -4.92e-01 | -0.1207 |
| 27030 | MLH3 | HTA11_696_2000001011 | Human | Colorectum | AD | 1.08e-07 | -3.49e-01 | -0.1464 |
| 27030 | MLH3 | HTA11_866_2000001011 | Human | Colorectum | AD | 1.73e-07 | -2.95e-01 | -0.1001 |
| 27030 | MLH3 | HTA11_1391_2000001011 | Human | Colorectum | AD | 1.99e-02 | -2.81e-01 | -0.059 |
| 27030 | MLH3 | HTA11_5212_2000001011 | Human | Colorectum | AD | 3.42e-02 | -4.79e-01 | -0.2061 |
| 27030 | MLH3 | HTA11_866_3004761011 | Human | Colorectum | AD | 9.04e-05 | -3.32e-01 | 0.096 |
| 27030 | MLH3 | HTA11_10711_2000001011 | Human | Colorectum | AD | 2.90e-03 | -3.24e-01 | 0.0338 |
| 27030 | MLH3 | HTA11_7696_3000711011 | Human | Colorectum | AD | 5.80e-12 | -3.45e-01 | 0.0674 |
| 27030 | MLH3 | HTA11_6818_2000001021 | Human | Colorectum | AD | 5.03e-03 | -3.97e-01 | 0.0588 |
| 27030 | MLH3 | HTA11_99999970781_79442 | Human | Colorectum | MSS | 7.14e-11 | -3.77e-01 | 0.294 |
| 27030 | MLH3 | HTA11_99999971662_82457 | Human | Colorectum | MSS | 5.08e-14 | -4.09e-01 | 0.3859 |
| 27030 | MLH3 | HTA11_99999973899_84307 | Human | Colorectum | MSS | 3.11e-05 | -4.90e-01 | 0.2585 |
| 27030 | MLH3 | HTA11_99999974143_84620 | Human | Colorectum | MSS | 1.40e-10 | -3.61e-01 | 0.3005 |
| 27030 | MLH3 | A001-C-207 | Human | Colorectum | FAP | 1.13e-03 | -1.22e-01 | 0.1278 |
| 27030 | MLH3 | A015-C-203 | Human | Colorectum | FAP | 2.32e-23 | -2.96e-01 | -0.1294 |
| 27030 | MLH3 | A015-C-204 | Human | Colorectum | FAP | 1.76e-07 | -2.91e-01 | -0.0228 |
| 27030 | MLH3 | A014-C-040 | Human | Colorectum | FAP | 1.56e-06 | -5.02e-01 | -0.1184 |
| Page: 1 2 3 4 5 6 |
| Tissue | Expression Dynamics | Abbreviation |
| Colorectum (GSE201348) |  | FAP: Familial adenomatous polyposis |
| CRC: Colorectal cancer | ||
| Colorectum (HTA11) |  | AD: Adenomas |
| SER: Sessile serrated lesions | ||
| MSI-H: Microsatellite-high colorectal cancer | ||
| MSS: Microsatellite stable colorectal cancer | ||
| Esophagus | 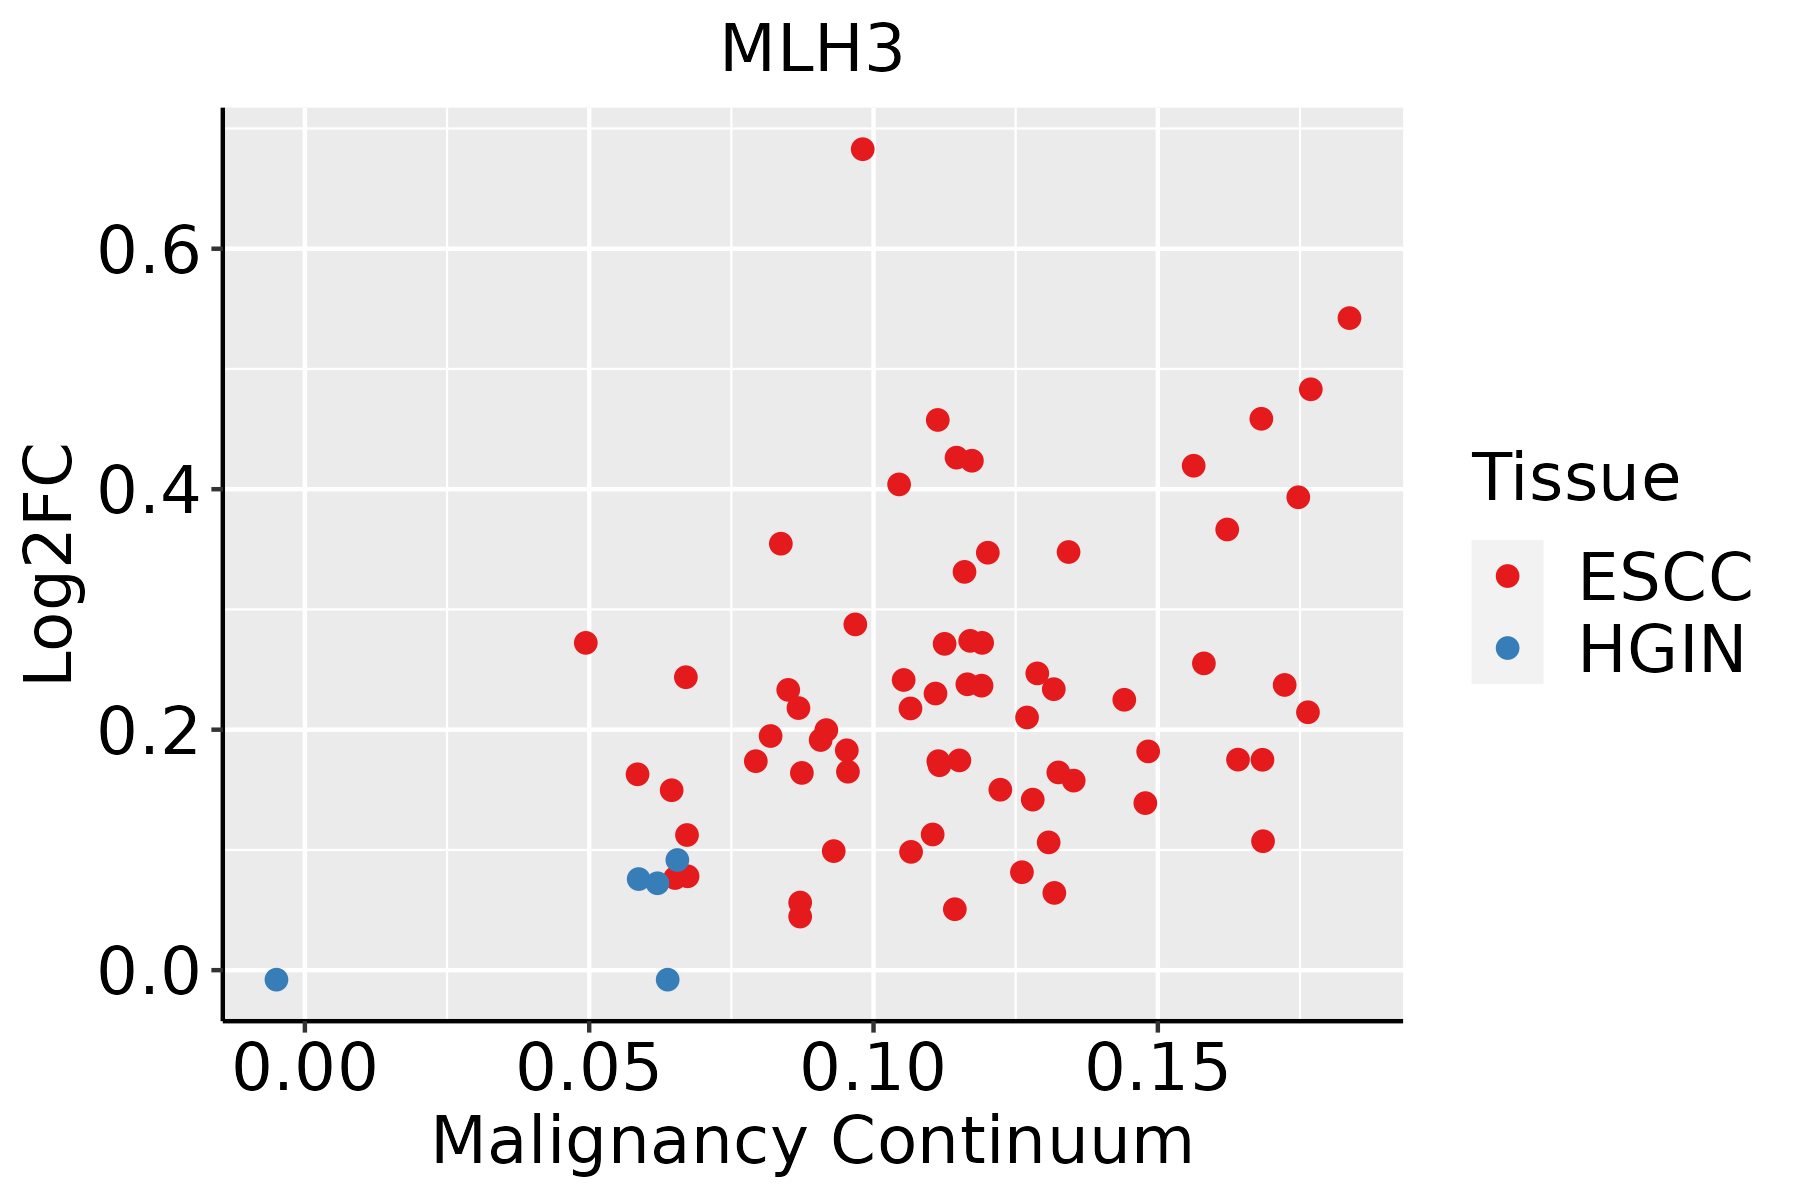 | ESCC: Esophageal squamous cell carcinoma |
| HGIN: High-grade intraepithelial neoplasias | ||
| LGIN: Low-grade intraepithelial neoplasias | ||
| Thyroid |  | ATC: Anaplastic thyroid cancer |
| HT: Hashimoto's thyroiditis | ||
| PTC: Papillary thyroid cancer |
| ∗log2FC in expression of this searched gene in stem-like cells from each diseased tissue sample relative to stem-like cells in normal samples in each tissue plotted against the malignancy continuum. Samples are colored based on if they are from different disease stage. |
Top |
Malignant transformation related pathway analysis |
| Find out the enriched GO biological processes and KEGG pathways involved in transition from healthy to precancer to cancer |
| Tissue | Disease Stage | Enriched GO biological Processes |
| Colorectum | AD |  |
| Colorectum | SER |  |
| Colorectum | MSS |  |
| Colorectum | MSI-H |  |
| Colorectum | FAP |  |
| ∗Top 15 enriched GO BP terms are showed in the bar plot of each disease state in each tissue. Each row represents a significant GO biological process which is colored according to the -log10(p.adjust). |
| Page: 1 2 3 4 5 6 7 8 9 |
| GO ID | Tissue | Disease Stage | Description | Gene Ratio | Bg Ratio | pvalue | p.adjust | Count |
| GO:000705911 | Esophagus | ESCC | chromosome segregation | 238/8552 | 346/18723 | 1.72e-18 | 1.82e-16 | 238 |
| GO:00482853 | Esophagus | ESCC | organelle fission | 301/8552 | 488/18723 | 4.64e-13 | 2.12e-11 | 301 |
| GO:00988133 | Esophagus | ESCC | nuclear chromosome segregation | 187/8552 | 281/18723 | 1.00e-12 | 4.36e-11 | 187 |
| GO:00002802 | Esophagus | ESCC | nuclear division | 270/8552 | 439/18723 | 1.17e-11 | 4.24e-10 | 270 |
| GO:00063101 | Esophagus | ESCC | DNA recombination | 168/8552 | 305/18723 | 5.58e-04 | 3.05e-03 | 168 |
| GO:00070595 | Thyroid | PTC | chromosome segregation | 146/5968 | 346/18723 | 2.99e-05 | 2.87e-04 | 146 |
| GO:00482855 | Thyroid | PTC | organelle fission | 188/5968 | 488/18723 | 9.64e-04 | 5.77e-03 | 188 |
| GO:00988135 | Thyroid | PTC | nuclear chromosome segregation | 114/5968 | 281/18723 | 1.21e-03 | 6.94e-03 | 114 |
| GO:00002804 | Thyroid | PTC | nuclear division | 167/5968 | 439/18723 | 3.27e-03 | 1.60e-02 | 167 |
| GO:000705913 | Thyroid | ATC | chromosome segregation | 183/6293 | 346/18723 | 8.03e-14 | 4.23e-12 | 183 |
| GO:009881312 | Thyroid | ATC | nuclear chromosome segregation | 145/6293 | 281/18723 | 3.06e-10 | 8.61e-09 | 145 |
| GO:004828512 | Thyroid | ATC | organelle fission | 229/6293 | 488/18723 | 4.79e-10 | 1.29e-08 | 229 |
| GO:000028011 | Thyroid | ATC | nuclear division | 207/6293 | 439/18723 | 1.98e-09 | 4.80e-08 | 207 |
| Page: 1 |
| Pathway ID | Tissue | Disease Stage | Description | Gene Ratio | Bg Ratio | pvalue | p.adjust | qvalue | Count |
| Page: 1 |
Top |
Cell-cell communication analysis |
| Identification of potential cell-cell interactions between two cell types and their ligand-receptor pairs for different disease states |
| Ligand | Receptor | LRpair | Pathway | Tissue | Disease Stage |
| Page: 1 |
Top |
Single-cell gene regulatory network inference analysis |
| Find out the significant the regulons (TFs) and the target genes of each regulon across cell types for different disease states |
| TF | Cell Type | Tissue | Disease Stage | Target Gene | RSS | Regulon Activity |
| ∗The dot plots of a searched regulon are shown for all cell subpopulations in each disease state of each tissue based on the regulon specific score inferred using pySCENIC and by calculating the average expression. |
| Page: 1 |
Top |
Somatic mutation of malignant transformation related genes |
| Annotation of somatic variants for genes involved in malignant transformation |
| Hugo Symbol | Variant Class | Variant Classification | dbSNP RS | HGVSc | HGVSp | HGVSp Short | SWISSPROT | BIOTYPE | SIFT | PolyPhen | Tumor Sample Barcode | Tissue | Histology | Sex | Age | Stage | Therapy Types | Drugs | Outcome |
| MLH3 | SNV | Missense_Mutation | novel | c.2047C>A | p.Leu683Ile | p.L683I | Q9UHC1 | protein_coding | tolerated(0.08) | benign(0.023) | TCGA-AC-A2QJ-01 | Breast | breast invasive carcinoma | Female | <65 | III/IV | Chemotherapy | cytoxan | PD |
| MLH3 | SNV | Missense_Mutation | c.1469N>A | p.Ser490Tyr | p.S490Y | Q9UHC1 | protein_coding | tolerated(0.14) | benign(0) | TCGA-AN-A046-01 | Breast | breast invasive carcinoma | Female | >=65 | I/II | Unknown | Unknown | SD | |
| MLH3 | SNV | Missense_Mutation | novel | c.3838N>C | p.Lys1280Gln | p.K1280Q | Q9UHC1 | protein_coding | deleterious(0.04) | possibly_damaging(0.702) | TCGA-AR-A24Q-01 | Breast | breast invasive carcinoma | Female | <65 | I/II | Chemotherapy | doxorubicin | SD |
| MLH3 | SNV | Missense_Mutation | c.3726N>C | p.Glu1242Asp | p.E1242D | Q9UHC1 | protein_coding | tolerated(0.06) | benign(0.166) | TCGA-B6-A0I9-01 | Breast | breast invasive carcinoma | Female | <65 | III/IV | Unknown | Unknown | PD | |
| MLH3 | SNV | Missense_Mutation | novel | c.3363G>A | p.Met1121Ile | p.M1121I | Q9UHC1 | protein_coding | tolerated(0.19) | benign(0.015) | TCGA-BH-A0B6-01 | Breast | breast invasive carcinoma | Female | <65 | I/II | Unknown | Unknown | SD |
| MLH3 | SNV | Missense_Mutation | c.1024N>A | p.Glu342Lys | p.E342K | Q9UHC1 | protein_coding | deleterious(0.01) | probably_damaging(0.996) | TCGA-BH-A0DZ-01 | Breast | breast invasive carcinoma | Female | <65 | I/II | Chemotherapy | docetaxel | SD | |
| MLH3 | SNV | Missense_Mutation | c.2660N>T | p.Thr887Ile | p.T887I | Q9UHC1 | protein_coding | deleterious(0.04) | benign(0.023) | TCGA-BH-A0HF-01 | Breast | breast invasive carcinoma | Female | >=65 | I/II | Hormone Therapy | arimidex | SD | |
| MLH3 | SNV | Missense_Mutation | novel | c.150N>A | p.Phe50Leu | p.F50L | Q9UHC1 | protein_coding | deleterious(0.03) | benign(0.306) | TCGA-BH-A2L8-01 | Breast | breast invasive carcinoma | Female | <65 | I/II | Chemotherapy | cytoxan | CR |
| MLH3 | SNV | Missense_Mutation | c.712N>C | p.Tyr238His | p.Y238H | Q9UHC1 | protein_coding | deleterious(0.03) | benign(0.359) | TCGA-C8-A8HR-01 | Breast | breast invasive carcinoma | Female | <65 | III/IV | Chemotherapy | 5-fluorouracil | CR | |
| MLH3 | SNV | Missense_Mutation | c.1537C>G | p.Gln513Glu | p.Q513E | Q9UHC1 | protein_coding | tolerated(0.45) | benign(0.036) | TCGA-D8-A1J8-01 | Breast | breast invasive carcinoma | Female | >=65 | I/II | Hormone Therapy | nolvadex | SD |
| Page: 1 2 3 4 5 6 7 8 9 10 11 12 13 14 15 |
Top |
Related drugs of malignant transformation related genes |
| Identification of chemicals and drugs interact with genes involved in malignant transfromation |
| (DGIdb 4.0) |
| Entrez ID | Symbol | Category | Interaction Types | Drug Claim Name | Drug Name | PMIDs |
| Page: 1 |

Copyright 2023-Present -The University of Texas Health Science Center at Houston |