
|
|||||
|
 | |
| |
| |
| |
| |
| |
|
Gene: MLH1 |
Gene summary for MLH1 |
| Gene information | Species | Human | Gene symbol | MLH1 | Gene ID | 4292 |
| Gene name | mutL homolog 1 | |
| Gene Alias | COCA2 | |
| Cytomap | 3p22.2 | |
| Gene Type | protein-coding | GO ID | GO:0000003 | UniProtAcc | P40692 |
Top |
Malignant transformation analysis |
| Identification of the aberrant gene expression in precancerous and cancerous lesions by comparing the gene expression of stem-like cells in diseased tissues with normal stem cells |
| Entrez ID | Symbol | Replicates | Species | Organ | Tissue | Adj P-value | Log2FC | Malignancy |
| 4292 | MLH1 | HTA11_1938_2000001011 | Human | Colorectum | AD | 4.70e-05 | 2.45e-01 | -0.0811 |
| 4292 | MLH1 | HTA11_347_2000001011 | Human | Colorectum | AD | 2.08e-05 | 2.56e-01 | -0.1954 |
| 4292 | MLH1 | HTA11_1391_2000001011 | Human | Colorectum | AD | 3.52e-03 | 2.33e-01 | -0.059 |
| 4292 | MLH1 | HTA11_7469_2000001011 | Human | Colorectum | AD | 1.61e-20 | 1.99e+00 | -0.0124 |
| 4292 | MLH1 | HTA11_99999970781_79442 | Human | Colorectum | MSS | 1.31e-04 | 3.06e-01 | 0.294 |
| 4292 | MLH1 | HTA11_99999965104_69814 | Human | Colorectum | MSS | 7.32e-37 | 1.51e+00 | 0.281 |
| 4292 | MLH1 | LZE4T | Human | Esophagus | ESCC | 9.96e-08 | 2.22e-01 | 0.0811 |
| 4292 | MLH1 | LZE24T | Human | Esophagus | ESCC | 1.05e-04 | 1.17e-01 | 0.0596 |
| 4292 | MLH1 | P2T-E | Human | Esophagus | ESCC | 6.07e-14 | 2.44e-01 | 0.1177 |
| 4292 | MLH1 | P4T-E | Human | Esophagus | ESCC | 5.09e-10 | 2.58e-01 | 0.1323 |
| 4292 | MLH1 | P5T-E | Human | Esophagus | ESCC | 6.19e-07 | 1.48e-01 | 0.1327 |
| 4292 | MLH1 | P8T-E | Human | Esophagus | ESCC | 4.75e-10 | 1.72e-01 | 0.0889 |
| 4292 | MLH1 | P10T-E | Human | Esophagus | ESCC | 2.57e-13 | 1.64e-01 | 0.116 |
| 4292 | MLH1 | P11T-E | Human | Esophagus | ESCC | 9.05e-08 | 3.50e-01 | 0.1426 |
| 4292 | MLH1 | P12T-E | Human | Esophagus | ESCC | 7.63e-28 | 4.75e-01 | 0.1122 |
| 4292 | MLH1 | P15T-E | Human | Esophagus | ESCC | 4.57e-07 | 1.41e-01 | 0.1149 |
| 4292 | MLH1 | P16T-E | Human | Esophagus | ESCC | 1.29e-14 | 2.65e-01 | 0.1153 |
| 4292 | MLH1 | P17T-E | Human | Esophagus | ESCC | 5.02e-06 | 2.14e-01 | 0.1278 |
| 4292 | MLH1 | P19T-E | Human | Esophagus | ESCC | 3.47e-02 | 2.43e-01 | 0.1662 |
| 4292 | MLH1 | P20T-E | Human | Esophagus | ESCC | 2.36e-09 | 1.01e-01 | 0.1124 |
| Page: 1 2 3 |
| Tissue | Expression Dynamics | Abbreviation |
| Colorectum (GSE201348) |  | FAP: Familial adenomatous polyposis |
| CRC: Colorectal cancer | ||
| Colorectum (HTA11) |  | AD: Adenomas |
| SER: Sessile serrated lesions | ||
| MSI-H: Microsatellite-high colorectal cancer | ||
| MSS: Microsatellite stable colorectal cancer | ||
| Esophagus | 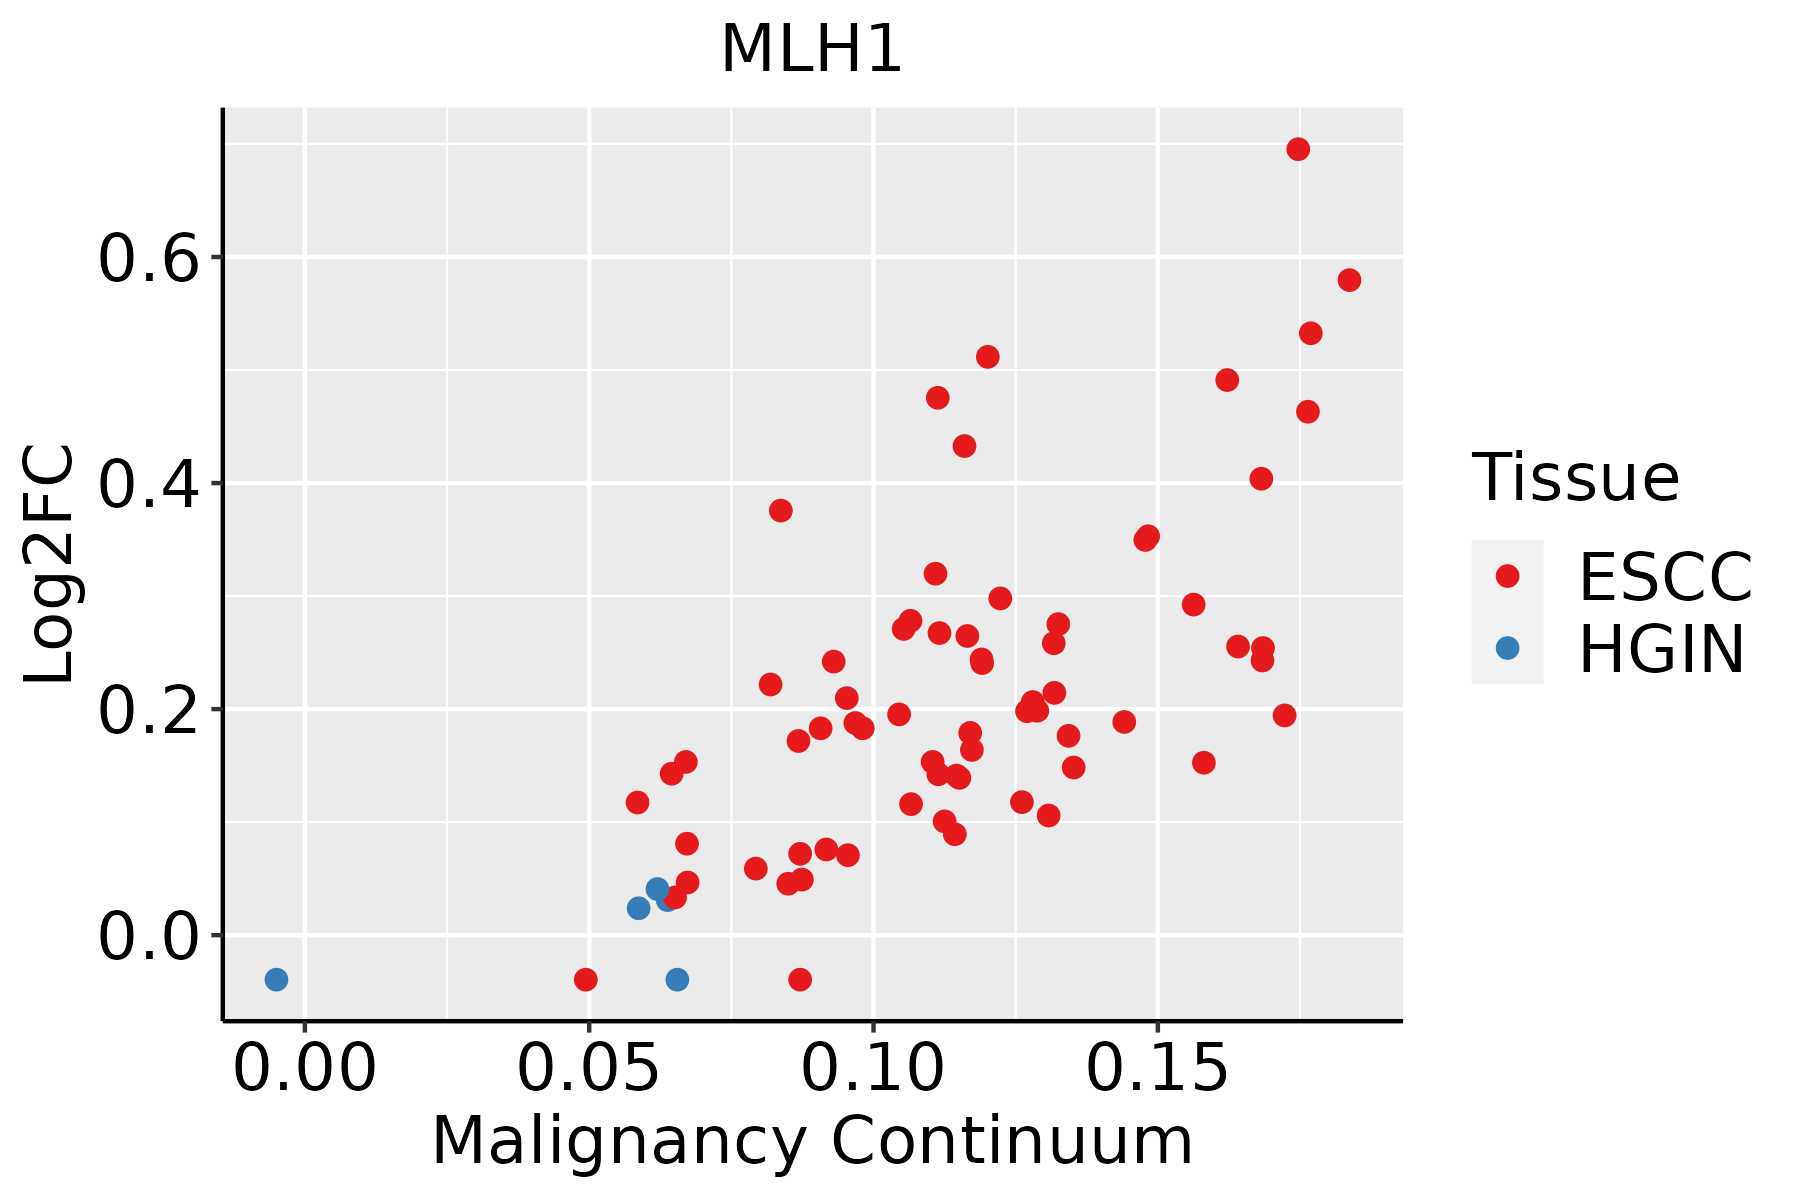 | ESCC: Esophageal squamous cell carcinoma |
| HGIN: High-grade intraepithelial neoplasias | ||
| LGIN: Low-grade intraepithelial neoplasias |
| ∗log2FC in expression of this searched gene in stem-like cells from each diseased tissue sample relative to stem-like cells in normal samples in each tissue plotted against the malignancy continuum. Samples are colored based on if they are from different disease stage. |
Top |
Malignant transformation related pathway analysis |
| Find out the enriched GO biological processes and KEGG pathways involved in transition from healthy to precancer to cancer |
| Tissue | Disease Stage | Enriched GO biological Processes |
| Colorectum | AD |  |
| Colorectum | SER |  |
| Colorectum | MSS |  |
| Colorectum | MSI-H |  |
| Colorectum | FAP |  |
| ∗Top 15 enriched GO BP terms are showed in the bar plot of each disease state in each tissue. Each row represents a significant GO biological process which is colored according to the -log10(p.adjust). |
| Page: 1 2 3 4 5 6 7 8 9 |
| GO ID | Tissue | Disease Stage | Description | Gene Ratio | Bg Ratio | pvalue | p.adjust | Count |
| GO:0009896 | Colorectum | AD | positive regulation of catabolic process | 180/3918 | 492/18723 | 4.33e-16 | 1.94e-13 | 180 |
| GO:1903311 | Colorectum | AD | regulation of mRNA metabolic process | 117/3918 | 288/18723 | 1.69e-14 | 4.23e-12 | 117 |
| GO:0031331 | Colorectum | AD | positive regulation of cellular catabolic process | 156/3918 | 427/18723 | 4.68e-14 | 1.05e-11 | 156 |
| GO:0097193 | Colorectum | AD | intrinsic apoptotic signaling pathway | 108/3918 | 288/18723 | 6.25e-11 | 6.41e-09 | 108 |
| GO:0006401 | Colorectum | AD | RNA catabolic process | 102/3918 | 278/18723 | 8.64e-10 | 6.76e-08 | 102 |
| GO:0051656 | Colorectum | AD | establishment of organelle localization | 131/3918 | 390/18723 | 3.00e-09 | 2.06e-07 | 131 |
| GO:0044270 | Colorectum | AD | cellular nitrogen compound catabolic process | 147/3918 | 451/18723 | 3.35e-09 | 2.23e-07 | 147 |
| GO:0046700 | Colorectum | AD | heterocycle catabolic process | 145/3918 | 445/18723 | 4.37e-09 | 2.84e-07 | 145 |
| GO:0006402 | Colorectum | AD | mRNA catabolic process | 87/3918 | 232/18723 | 4.40e-09 | 2.84e-07 | 87 |
| GO:0034655 | Colorectum | AD | nucleobase-containing compound catabolic process | 133/3918 | 407/18723 | 1.56e-08 | 9.12e-07 | 133 |
| GO:0019439 | Colorectum | AD | aromatic compound catabolic process | 146/3918 | 467/18723 | 7.48e-08 | 3.84e-06 | 146 |
| GO:1901361 | Colorectum | AD | organic cyclic compound catabolic process | 153/3918 | 495/18723 | 8.23e-08 | 4.18e-06 | 153 |
| GO:0061013 | Colorectum | AD | regulation of mRNA catabolic process | 64/3918 | 166/18723 | 1.44e-07 | 6.59e-06 | 64 |
| GO:0051052 | Colorectum | AD | regulation of DNA metabolic process | 116/3918 | 359/18723 | 2.47e-07 | 1.00e-05 | 116 |
| GO:0051054 | Colorectum | AD | positive regulation of DNA metabolic process | 73/3918 | 201/18723 | 3.27e-07 | 1.29e-05 | 73 |
| GO:0043487 | Colorectum | AD | regulation of RNA stability | 63/3918 | 170/18723 | 9.17e-07 | 3.12e-05 | 63 |
| GO:0006417 | Colorectum | AD | regulation of translation | 141/3918 | 468/18723 | 1.32e-06 | 4.22e-05 | 141 |
| GO:0043488 | Colorectum | AD | regulation of mRNA stability | 59/3918 | 158/18723 | 1.50e-06 | 4.66e-05 | 59 |
| GO:1903313 | Colorectum | AD | positive regulation of mRNA metabolic process | 44/3918 | 118/18723 | 3.20e-05 | 5.87e-04 | 44 |
| GO:0000956 | Colorectum | AD | nuclear-transcribed mRNA catabolic process | 40/3918 | 112/18723 | 2.11e-04 | 2.79e-03 | 40 |
| Page: 1 2 3 4 5 6 |
| Pathway ID | Tissue | Disease Stage | Description | Gene Ratio | Bg Ratio | pvalue | p.adjust | qvalue | Count |
| hsa05213 | Colorectum | AD | Endometrial cancer | 29/2092 | 58/8465 | 2.69e-05 | 2.57e-04 | 1.64e-04 | 29 |
| hsa05210 | Colorectum | AD | Colorectal cancer | 35/2092 | 86/8465 | 7.54e-04 | 5.49e-03 | 3.50e-03 | 35 |
| hsa052131 | Colorectum | AD | Endometrial cancer | 29/2092 | 58/8465 | 2.69e-05 | 2.57e-04 | 1.64e-04 | 29 |
| hsa052101 | Colorectum | AD | Colorectal cancer | 35/2092 | 86/8465 | 7.54e-04 | 5.49e-03 | 3.50e-03 | 35 |
| hsa052102 | Colorectum | MSS | Colorectal cancer | 36/1875 | 86/8465 | 3.08e-05 | 3.22e-04 | 1.97e-04 | 36 |
| hsa052134 | Colorectum | MSS | Endometrial cancer | 27/1875 | 58/8465 | 3.18e-05 | 3.23e-04 | 1.98e-04 | 27 |
| hsa01524 | Colorectum | MSS | Platinum drug resistance | 25/1875 | 73/8465 | 1.17e-02 | 3.99e-02 | 2.44e-02 | 25 |
| hsa052103 | Colorectum | MSS | Colorectal cancer | 36/1875 | 86/8465 | 3.08e-05 | 3.22e-04 | 1.97e-04 | 36 |
| hsa052135 | Colorectum | MSS | Endometrial cancer | 27/1875 | 58/8465 | 3.18e-05 | 3.23e-04 | 1.98e-04 | 27 |
| hsa015241 | Colorectum | MSS | Platinum drug resistance | 25/1875 | 73/8465 | 1.17e-02 | 3.99e-02 | 2.44e-02 | 25 |
| hsa0521020 | Esophagus | ESCC | Colorectal cancer | 69/4205 | 86/8465 | 4.06e-09 | 4.13e-08 | 2.11e-08 | 69 |
| hsa015247 | Esophagus | ESCC | Platinum drug resistance | 56/4205 | 73/8465 | 1.85e-06 | 1.13e-05 | 5.78e-06 | 56 |
| hsa0521320 | Esophagus | ESCC | Endometrial cancer | 45/4205 | 58/8465 | 1.14e-05 | 5.98e-05 | 3.06e-05 | 45 |
| hsa034304 | Esophagus | ESCC | Mismatch repair | 21/4205 | 23/8465 | 2.85e-05 | 1.35e-04 | 6.90e-05 | 21 |
| hsa05210110 | Esophagus | ESCC | Colorectal cancer | 69/4205 | 86/8465 | 4.06e-09 | 4.13e-08 | 2.11e-08 | 69 |
| hsa0152414 | Esophagus | ESCC | Platinum drug resistance | 56/4205 | 73/8465 | 1.85e-06 | 1.13e-05 | 5.78e-06 | 56 |
| hsa05213110 | Esophagus | ESCC | Endometrial cancer | 45/4205 | 58/8465 | 1.14e-05 | 5.98e-05 | 3.06e-05 | 45 |
| hsa0343011 | Esophagus | ESCC | Mismatch repair | 21/4205 | 23/8465 | 2.85e-05 | 1.35e-04 | 6.90e-05 | 21 |
| Page: 1 |
Top |
Cell-cell communication analysis |
| Identification of potential cell-cell interactions between two cell types and their ligand-receptor pairs for different disease states |
| Ligand | Receptor | LRpair | Pathway | Tissue | Disease Stage |
| Page: 1 |
Top |
Single-cell gene regulatory network inference analysis |
| Find out the significant the regulons (TFs) and the target genes of each regulon across cell types for different disease states |
| TF | Cell Type | Tissue | Disease Stage | Target Gene | RSS | Regulon Activity |
| ∗The dot plots of a searched regulon are shown for all cell subpopulations in each disease state of each tissue based on the regulon specific score inferred using pySCENIC and by calculating the average expression. |
| Page: 1 |
Top |
Somatic mutation of malignant transformation related genes |
| Annotation of somatic variants for genes involved in malignant transformation |
| Hugo Symbol | Variant Class | Variant Classification | dbSNP RS | HGVSc | HGVSp | HGVSp Short | SWISSPROT | BIOTYPE | SIFT | PolyPhen | Tumor Sample Barcode | Tissue | Histology | Sex | Age | Stage | Therapy Types | Drugs | Outcome |
| MLH1 | SNV | Missense_Mutation | c.595N>A | p.Glu199Lys | p.E199K | P40692 | protein_coding | deleterious(0.01) | possibly_damaging(0.548) | TCGA-AC-A23H-01 | Breast | breast invasive carcinoma | Female | >=65 | I/II | Unknown | Unknown | PD | |
| MLH1 | SNV | Missense_Mutation | novel | c.1648N>A | p.Leu550Ile | p.L550I | P40692 | protein_coding | tolerated(0.44) | benign(0.056) | TCGA-AN-A046-01 | Breast | breast invasive carcinoma | Female | >=65 | I/II | Unknown | Unknown | SD |
| MLH1 | SNV | Missense_Mutation | rs587779951 | c.1202N>A | p.Ser401Asn | p.S401N | P40692 | protein_coding | tolerated(0.67) | benign(0.001) | TCGA-AN-A0AK-01 | Breast | breast invasive carcinoma | Female | >=65 | I/II | Unknown | Unknown | SD |
| MLH1 | SNV | Missense_Mutation | c.1500N>G | p.Ile500Met | p.I500M | P40692 | protein_coding | tolerated(0.06) | benign(0.161) | TCGA-AO-A128-01 | Breast | breast invasive carcinoma | Female | <65 | I/II | Chemotherapy | doxorubicin | SD | |
| MLH1 | SNV | Missense_Mutation | c.1891G>C | p.Asp631His | p.D631H | P40692 | protein_coding | deleterious(0.01) | probably_damaging(0.984) | TCGA-C8-A1HE-01 | Breast | breast invasive carcinoma | Female | <65 | I/II | Unknown | Unknown | SD | |
| MLH1 | SNV | Missense_Mutation | c.2126N>A | p.Pro709Gln | p.P709Q | P40692 | protein_coding | tolerated(0.4) | benign(0.003) | TCGA-D8-A1X9-01 | Breast | breast invasive carcinoma | Female | >=65 | I/II | Chemotherapy | adriamycin+cyclophosphamide | SD | |
| MLH1 | SNV | Missense_Mutation | rs587779005 | c.331N>C | p.Ala111Pro | p.A111P | P40692 | protein_coding | deleterious(0) | probably_damaging(0.999) | TCGA-D8-A1XK-01 | Breast | breast invasive carcinoma | Female | <65 | I/II | Chemotherapy | doxorubicine+cyclophosphamide | SD |
| MLH1 | insertion | Frame_Shift_Ins | novel | c.1656_1657insCTTCTATTAGAAGGTGTCATCTATG | p.Thr553LeufsTer12 | p.T553Lfs*12 | P40692 | protein_coding | TCGA-A8-A082-01 | Breast | breast invasive carcinoma | Female | <65 | I/II | Chemotherapy | 5-fluorouracil | CR | ||
| MLH1 | insertion | Frame_Shift_Ins | novel | c.1504_1505insTT | p.Asn502IlefsTer7 | p.N502Ifs*7 | P40692 | protein_coding | TCGA-AC-A3QQ-01 | Breast | breast invasive carcinoma | Female | <65 | I/II | Unknown | Unknown | SD | ||
| MLH1 | deletion | Frame_Shift_Del | novel | c.1506_1507delNN | p.Leu503HisfsTer2 | p.L503Hfs*2 | P40692 | protein_coding | TCGA-AC-A3QQ-01 | Breast | breast invasive carcinoma | Female | <65 | I/II | Unknown | Unknown | SD |
| Page: 1 2 3 4 5 6 7 8 9 |
Top |
Related drugs of malignant transformation related genes |
| Identification of chemicals and drugs interact with genes involved in malignant transfromation |
| (DGIdb 4.0) |
| Entrez ID | Symbol | Category | Interaction Types | Drug Claim Name | Drug Name | PMIDs |
| 4292 | MLH1 | CLINICALLY ACTIONABLE, DRUGGABLE GENOME | KU60648 | 28224663 | ||
| 4292 | MLH1 | CLINICALLY ACTIONABLE, DRUGGABLE GENOME | N/A | 22810696 |
| Page: 1 |

Copyright 2023-Present -The University of Texas Health Science Center at Houston |