
|
|||||
|
 | |
| |
| |
| |
| |
| |
|
Gene: MLF1 |
Gene summary for MLF1 |
| Gene information | Species | Human | Gene symbol | MLF1 | Gene ID | 4291 |
| Gene name | myeloid leukemia factor 1 | |
| Gene Alias | MLF1 | |
| Cytomap | 3q25.32 | |
| Gene Type | protein-coding | GO ID | GO:0002244 | UniProtAcc | A0A140VKD2 |
Top |
Malignant transformation analysis |
| Identification of the aberrant gene expression in precancerous and cancerous lesions by comparing the gene expression of stem-like cells in diseased tissues with normal stem cells |
| Entrez ID | Symbol | Replicates | Species | Organ | Tissue | Adj P-value | Log2FC | Malignancy |
| 4291 | MLF1 | CA_HPV_2 | Human | Cervix | CC | 4.38e-03 | 2.08e-01 | 0.0391 |
| 4291 | MLF1 | HSIL_HPV_2 | Human | Cervix | HSIL_HPV | 4.08e-04 | 2.03e-01 | 0.0208 |
| 4291 | MLF1 | CCI_2 | Human | Cervix | CC | 1.45e-07 | 7.52e-01 | 0.5249 |
| 4291 | MLF1 | Tumor | Human | Cervix | CC | 4.13e-15 | 3.48e-01 | 0.1241 |
| 4291 | MLF1 | sample1 | Human | Cervix | CC | 5.13e-21 | 6.89e-01 | 0.0959 |
| 4291 | MLF1 | sample3 | Human | Cervix | CC | 8.62e-25 | 4.04e-01 | 0.1387 |
| 4291 | MLF1 | L1 | Human | Cervix | CC | 7.04e-03 | 3.35e-01 | 0.0802 |
| 4291 | MLF1 | T1 | Human | Cervix | CC | 7.49e-23 | 5.67e-01 | 0.0918 |
| 4291 | MLF1 | T2 | Human | Cervix | CC | 6.11e-05 | 3.76e-01 | 0.0709 |
| 4291 | MLF1 | T3 | Human | Cervix | CC | 1.83e-17 | 3.82e-01 | 0.1389 |
| 4291 | MLF1 | LZE4T | Human | Esophagus | ESCC | 3.45e-05 | 4.80e-01 | 0.0811 |
| 4291 | MLF1 | LZE7T | Human | Esophagus | ESCC | 1.81e-07 | 7.31e-01 | 0.0667 |
| 4291 | MLF1 | LZE8T | Human | Esophagus | ESCC | 2.04e-17 | 8.87e-01 | 0.067 |
| 4291 | MLF1 | LZE20T | Human | Esophagus | ESCC | 1.58e-02 | 8.81e-02 | 0.0662 |
| 4291 | MLF1 | LZE22T | Human | Esophagus | ESCC | 2.63e-05 | 9.99e-01 | 0.068 |
| 4291 | MLF1 | LZE24T | Human | Esophagus | ESCC | 5.89e-40 | 1.81e+00 | 0.0596 |
| 4291 | MLF1 | LZE6T | Human | Esophagus | ESCC | 3.45e-06 | 3.98e-01 | 0.0845 |
| 4291 | MLF1 | P1T-E | Human | Esophagus | ESCC | 2.99e-09 | 9.22e-01 | 0.0875 |
| 4291 | MLF1 | P2T-E | Human | Esophagus | ESCC | 1.23e-99 | 2.07e+00 | 0.1177 |
| 4291 | MLF1 | P4T-E | Human | Esophagus | ESCC | 1.46e-11 | 4.74e-01 | 0.1323 |
| Page: 1 2 3 4 5 6 |
| Tissue | Expression Dynamics | Abbreviation |
| Cervix |  | CC: Cervix cancer |
| HSIL_HPV: HPV-infected high-grade squamous intraepithelial lesions | ||
| N_HPV: HPV-infected normal cervix | ||
| Esophagus |  | ESCC: Esophageal squamous cell carcinoma |
| HGIN: High-grade intraepithelial neoplasias | ||
| LGIN: Low-grade intraepithelial neoplasias | ||
| Liver | 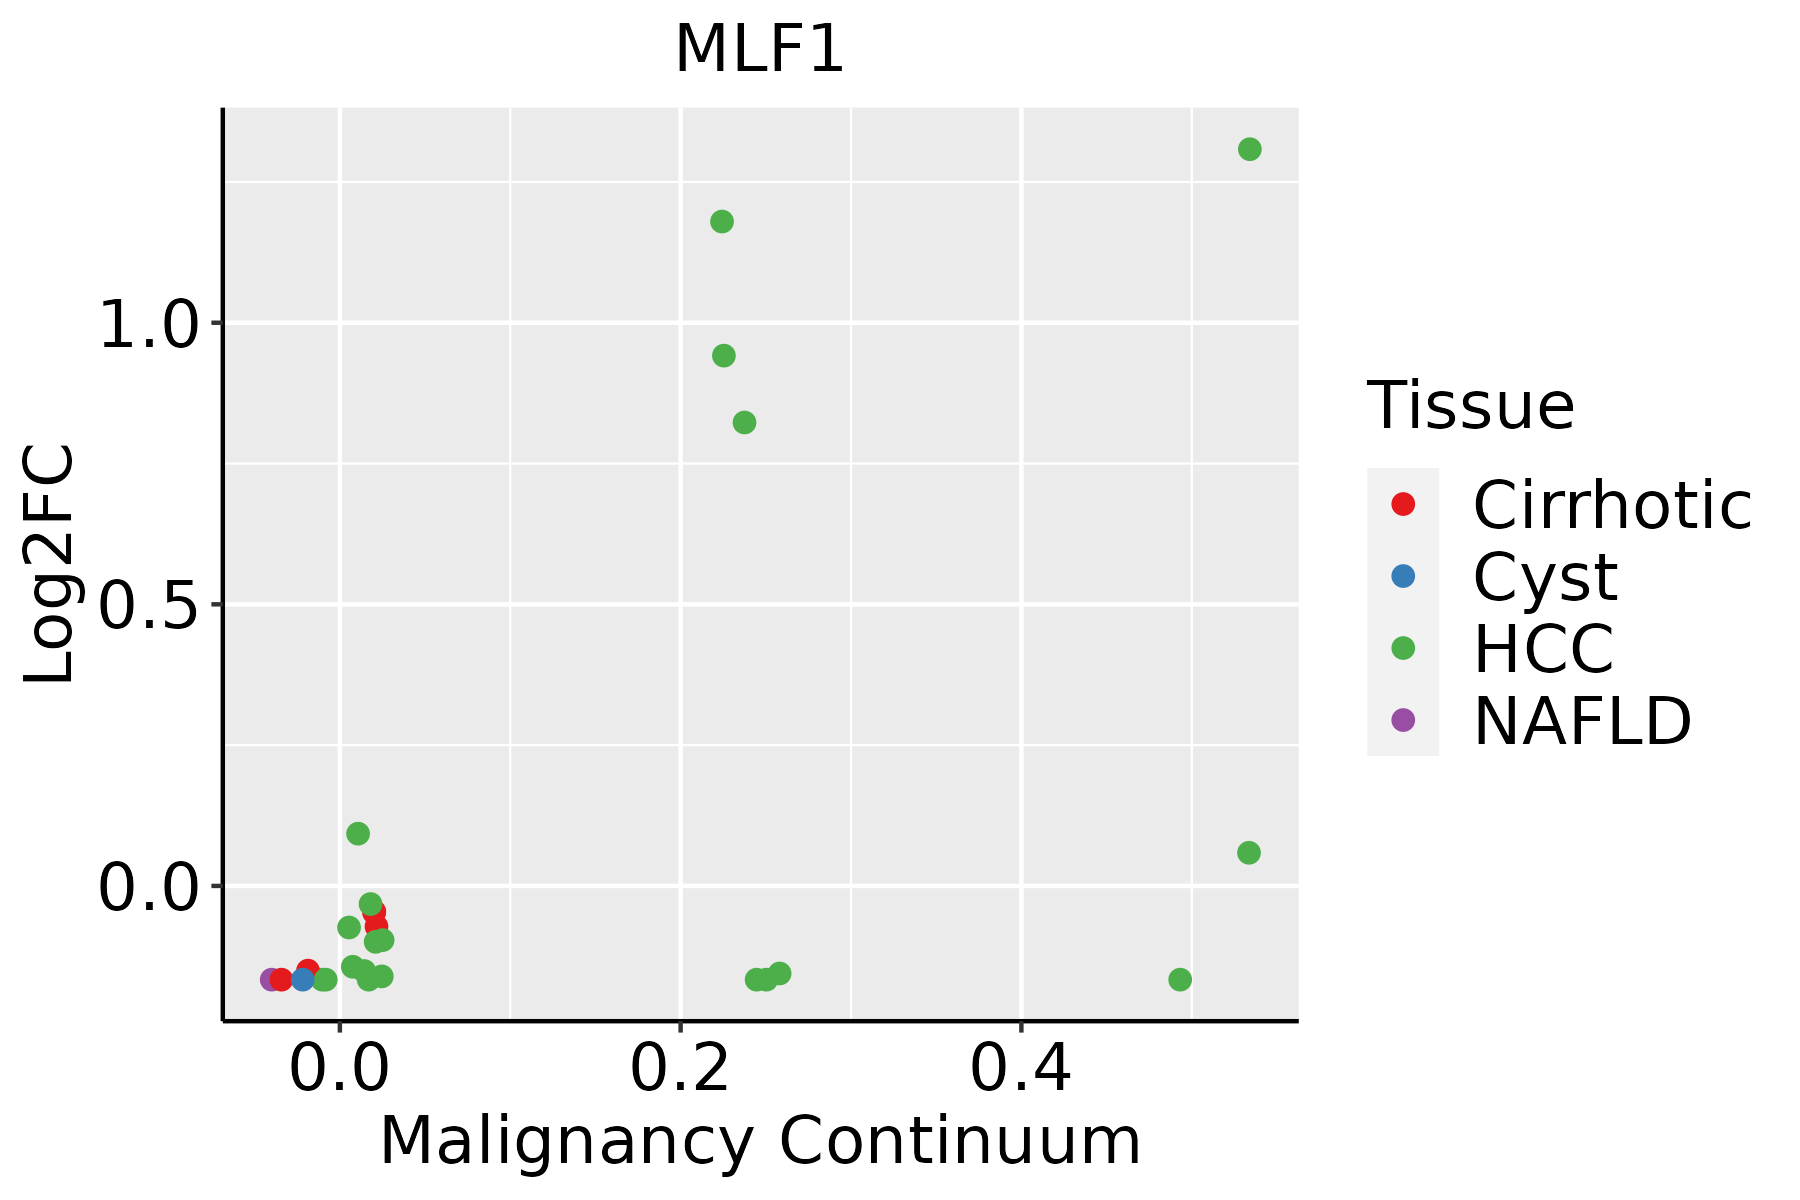 | HCC: Hepatocellular carcinoma |
| NAFLD: Non-alcoholic fatty liver disease | ||
| Oral Cavity | 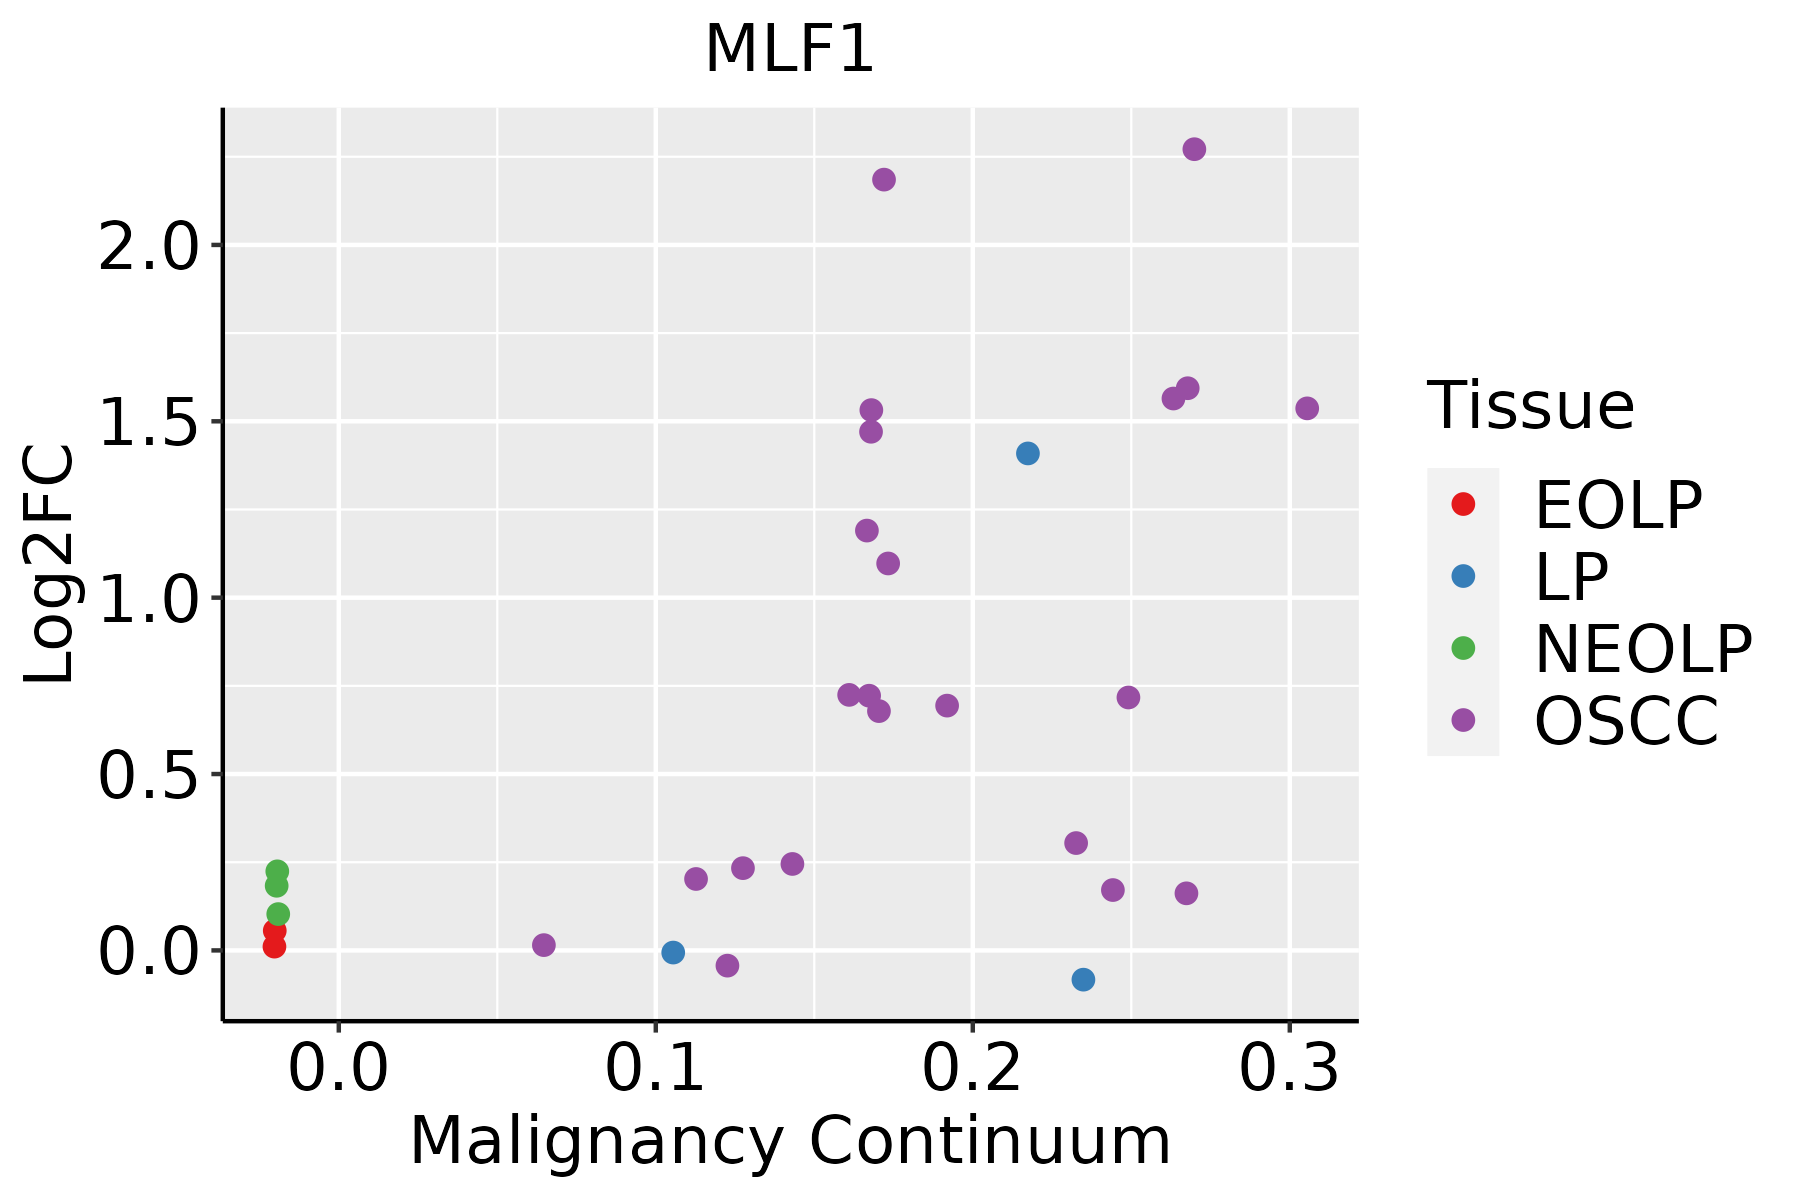 | EOLP: Erosive Oral lichen planus |
| LP: leukoplakia | ||
| NEOLP: Non-erosive oral lichen planus | ||
| OSCC: Oral squamous cell carcinoma | ||
| Prostate |  | BPH: Benign Prostatic Hyperplasia |
| ∗log2FC in expression of this searched gene in stem-like cells from each diseased tissue sample relative to stem-like cells in normal samples in each tissue plotted against the malignancy continuum. Samples are colored based on if they are from different disease stage. |
Top |
Malignant transformation related pathway analysis |
| Find out the enriched GO biological processes and KEGG pathways involved in transition from healthy to precancer to cancer |
| Tissue | Disease Stage | Enriched GO biological Processes |
| Colorectum | AD |  |
| Colorectum | SER |  |
| Colorectum | MSS |  |
| Colorectum | MSI-H |  |
| Colorectum | FAP |  |
| ∗Top 15 enriched GO BP terms are showed in the bar plot of each disease state in each tissue. Each row represents a significant GO biological process which is colored according to the -log10(p.adjust). |
| Page: 1 2 3 4 5 6 7 8 9 |
| GO ID | Tissue | Disease Stage | Description | Gene Ratio | Bg Ratio | pvalue | p.adjust | Count |
| GO:00022443 | Cervix | CC | hematopoietic progenitor cell differentiation | 26/2311 | 114/18723 | 1.30e-03 | 1.03e-02 | 26 |
| GO:00022446 | Esophagus | ESCC | hematopoietic progenitor cell differentiation | 66/8552 | 114/18723 | 5.74e-03 | 2.13e-02 | 66 |
| GO:00022445 | Oral cavity | OSCC | hematopoietic progenitor cell differentiation | 57/7305 | 114/18723 | 1.09e-02 | 3.71e-02 | 57 |
| GO:00022444 | Prostate | BPH | hematopoietic progenitor cell differentiation | 34/3107 | 114/18723 | 3.08e-04 | 2.37e-03 | 34 |
| GO:000224411 | Prostate | Tumor | hematopoietic progenitor cell differentiation | 34/3246 | 114/18723 | 7.00e-04 | 4.92e-03 | 34 |
| Page: 1 |
| Pathway ID | Tissue | Disease Stage | Description | Gene Ratio | Bg Ratio | pvalue | p.adjust | qvalue | Count |
| hsa052028 | Esophagus | ESCC | Transcriptional misregulation in cancer | 116/4205 | 193/8465 | 2.08e-03 | 5.95e-03 | 3.05e-03 | 116 |
| hsa0520213 | Esophagus | ESCC | Transcriptional misregulation in cancer | 116/4205 | 193/8465 | 2.08e-03 | 5.95e-03 | 3.05e-03 | 116 |
| hsa052027 | Prostate | BPH | Transcriptional misregulation in cancer | 53/1718 | 193/8465 | 9.56e-03 | 2.92e-02 | 1.81e-02 | 53 |
| hsa0520212 | Prostate | BPH | Transcriptional misregulation in cancer | 53/1718 | 193/8465 | 9.56e-03 | 2.92e-02 | 1.81e-02 | 53 |
| hsa0520221 | Prostate | Tumor | Transcriptional misregulation in cancer | 59/1791 | 193/8465 | 1.22e-03 | 5.26e-03 | 3.26e-03 | 59 |
| hsa0520231 | Prostate | Tumor | Transcriptional misregulation in cancer | 59/1791 | 193/8465 | 1.22e-03 | 5.26e-03 | 3.26e-03 | 59 |
| Page: 1 |
Top |
Cell-cell communication analysis |
| Identification of potential cell-cell interactions between two cell types and their ligand-receptor pairs for different disease states |
| Ligand | Receptor | LRpair | Pathway | Tissue | Disease Stage |
| Page: 1 |
Top |
Single-cell gene regulatory network inference analysis |
| Find out the significant the regulons (TFs) and the target genes of each regulon across cell types for different disease states |
| TF | Cell Type | Tissue | Disease Stage | Target Gene | RSS | Regulon Activity |
| ∗The dot plots of a searched regulon are shown for all cell subpopulations in each disease state of each tissue based on the regulon specific score inferred using pySCENIC and by calculating the average expression. |
| Page: 1 |
Top |
Somatic mutation of malignant transformation related genes |
| Annotation of somatic variants for genes involved in malignant transformation |
| Hugo Symbol | Variant Class | Variant Classification | dbSNP RS | HGVSc | HGVSp | HGVSp Short | SWISSPROT | BIOTYPE | SIFT | PolyPhen | Tumor Sample Barcode | Tissue | Histology | Sex | Age | Stage | Therapy Types | Drugs | Outcome |
| MLF1 | SNV | Missense_Mutation | c.701N>C | p.Val234Ala | p.V234A | P58340 | protein_coding | tolerated(0.29) | possibly_damaging(0.741) | TCGA-AC-A23H-01 | Breast | breast invasive carcinoma | Female | >=65 | I/II | Unknown | Unknown | PD | |
| MLF1 | SNV | Missense_Mutation | c.468N>T | p.Gln156His | p.Q156H | P58340 | protein_coding | deleterious(0.02) | probably_damaging(0.997) | TCGA-BH-A18G-01 | Breast | breast invasive carcinoma | Female | >=65 | I/II | Unknown | Unknown | SD | |
| MLF1 | SNV | Missense_Mutation | novel | c.203N>T | p.His68Leu | p.H68L | P58340 | protein_coding | tolerated(0.66) | benign(0.006) | TCGA-LL-A73Y-01 | Breast | breast invasive carcinoma | Female | >=65 | I/II | Chemotherapy | taxotere | SD |
| MLF1 | SNV | Missense_Mutation | c.586C>T | p.His196Tyr | p.H196Y | P58340 | protein_coding | deleterious(0) | probably_damaging(1) | TCGA-EA-A3HQ-01 | Cervix | cervical & endocervical cancer | Female | <65 | I/II | Unknown | Unknown | SD | |
| MLF1 | SNV | Missense_Mutation | rs779550712 | c.140N>T | p.Arg47Ile | p.R47I | P58340 | protein_coding | deleterious(0) | probably_damaging(0.975) | TCGA-AA-3984-01 | Colorectum | colon adenocarcinoma | Female | <65 | I/II | Unknown | Unknown | SD |
| MLF1 | SNV | Missense_Mutation | rs765550387 | c.485G>A | p.Arg162His | p.R162H | P58340 | protein_coding | tolerated(0.09) | probably_damaging(0.995) | TCGA-AZ-4313-01 | Colorectum | colon adenocarcinoma | Female | <65 | I/II | Unknown | Unknown | SD |
| MLF1 | SNV | Missense_Mutation | rs201952489 | c.488N>A | p.Arg163Gln | p.R163Q | P58340 | protein_coding | tolerated(0.21) | possibly_damaging(0.9) | TCGA-F4-6809-01 | Colorectum | colon adenocarcinoma | Female | <65 | I/II | Unknown | Unknown | PD |
| MLF1 | SNV | Missense_Mutation | c.539N>A | p.Ser180Asn | p.S180N | P58340 | protein_coding | deleterious(0.01) | probably_damaging(0.993) | TCGA-AG-4001-01 | Colorectum | rectum adenocarcinoma | Female | >=65 | I/II | Unknown | Unknown | SD | |
| MLF1 | SNV | Missense_Mutation | novel | c.31N>C | p.Lys11Gln | p.K11Q | P58340 | protein_coding | deleterious_low_confidence(0) | benign(0.03) | TCGA-AJ-A3EL-01 | Endometrium | uterine corpus endometrioid carcinoma | Female | <65 | I/II | Unknown | Unknown | SD |
| MLF1 | SNV | Missense_Mutation | rs199951975 | c.452N>T | p.Pro151Leu | p.P151L | P58340 | protein_coding | deleterious(0.01) | probably_damaging(1) | TCGA-AP-A051-01 | Endometrium | uterine corpus endometrioid carcinoma | Female | >=65 | I/II | Unknown | Unknown | SD |
| Page: 1 2 3 |
Top |
Related drugs of malignant transformation related genes |
| Identification of chemicals and drugs interact with genes involved in malignant transfromation |
| (DGIdb 4.0) |
| Entrez ID | Symbol | Category | Interaction Types | Drug Claim Name | Drug Name | PMIDs |
| Page: 1 |

Copyright 2023-Present -The University of Texas Health Science Center at Houston |