
|
|||||
|
 | |
| |
| |
| |
| |
| |
|
Gene: MKNK1 |
Gene summary for MKNK1 |
| Gene information | Species | Human | Gene symbol | MKNK1 | Gene ID | 8569 |
| Gene name | MAPK interacting serine/threonine kinase 1 | |
| Gene Alias | MNK1 | |
| Cytomap | 1p33 | |
| Gene Type | protein-coding | GO ID | GO:0006412 | UniProtAcc | Q9BUB5 |
Top |
Malignant transformation analysis |
| Identification of the aberrant gene expression in precancerous and cancerous lesions by comparing the gene expression of stem-like cells in diseased tissues with normal stem cells |
| Entrez ID | Symbol | Replicates | Species | Organ | Tissue | Adj P-value | Log2FC | Malignancy |
| 8569 | MKNK1 | LZE2T | Human | Esophagus | ESCC | 4.60e-02 | 2.16e-01 | 0.082 |
| 8569 | MKNK1 | LZE4T | Human | Esophagus | ESCC | 2.77e-04 | 1.20e-01 | 0.0811 |
| 8569 | MKNK1 | LZE7T | Human | Esophagus | ESCC | 3.71e-08 | 3.23e-01 | 0.0667 |
| 8569 | MKNK1 | LZE8T | Human | Esophagus | ESCC | 3.00e-04 | 1.41e-01 | 0.067 |
| 8569 | MKNK1 | LZE20T | Human | Esophagus | ESCC | 7.02e-08 | 1.69e-01 | 0.0662 |
| 8569 | MKNK1 | LZE24T | Human | Esophagus | ESCC | 4.48e-07 | 1.60e-01 | 0.0596 |
| 8569 | MKNK1 | LZE6T | Human | Esophagus | ESCC | 8.68e-06 | 2.04e-01 | 0.0845 |
| 8569 | MKNK1 | P1T-E | Human | Esophagus | ESCC | 3.91e-02 | 2.38e-01 | 0.0875 |
| 8569 | MKNK1 | P2T-E | Human | Esophagus | ESCC | 5.27e-17 | 2.15e-01 | 0.1177 |
| 8569 | MKNK1 | P4T-E | Human | Esophagus | ESCC | 7.02e-14 | 2.48e-01 | 0.1323 |
| 8569 | MKNK1 | P5T-E | Human | Esophagus | ESCC | 6.39e-20 | 3.62e-01 | 0.1327 |
| 8569 | MKNK1 | P8T-E | Human | Esophagus | ESCC | 3.00e-14 | 9.56e-02 | 0.0889 |
| 8569 | MKNK1 | P9T-E | Human | Esophagus | ESCC | 1.86e-10 | 1.36e-01 | 0.1131 |
| 8569 | MKNK1 | P10T-E | Human | Esophagus | ESCC | 1.78e-21 | 3.14e-01 | 0.116 |
| 8569 | MKNK1 | P11T-E | Human | Esophagus | ESCC | 1.49e-14 | 2.16e-01 | 0.1426 |
| 8569 | MKNK1 | P12T-E | Human | Esophagus | ESCC | 1.31e-13 | 1.77e-01 | 0.1122 |
| 8569 | MKNK1 | P15T-E | Human | Esophagus | ESCC | 2.14e-15 | 3.47e-01 | 0.1149 |
| 8569 | MKNK1 | P16T-E | Human | Esophagus | ESCC | 1.81e-05 | -5.36e-03 | 0.1153 |
| 8569 | MKNK1 | P17T-E | Human | Esophagus | ESCC | 6.56e-12 | 2.37e-01 | 0.1278 |
| 8569 | MKNK1 | P19T-E | Human | Esophagus | ESCC | 1.06e-03 | 1.58e-01 | 0.1662 |
| Page: 1 2 3 4 5 |
| Tissue | Expression Dynamics | Abbreviation |
| Esophagus |  | ESCC: Esophageal squamous cell carcinoma |
| HGIN: High-grade intraepithelial neoplasias | ||
| LGIN: Low-grade intraepithelial neoplasias | ||
| Liver |  | HCC: Hepatocellular carcinoma |
| NAFLD: Non-alcoholic fatty liver disease | ||
| Oral Cavity | 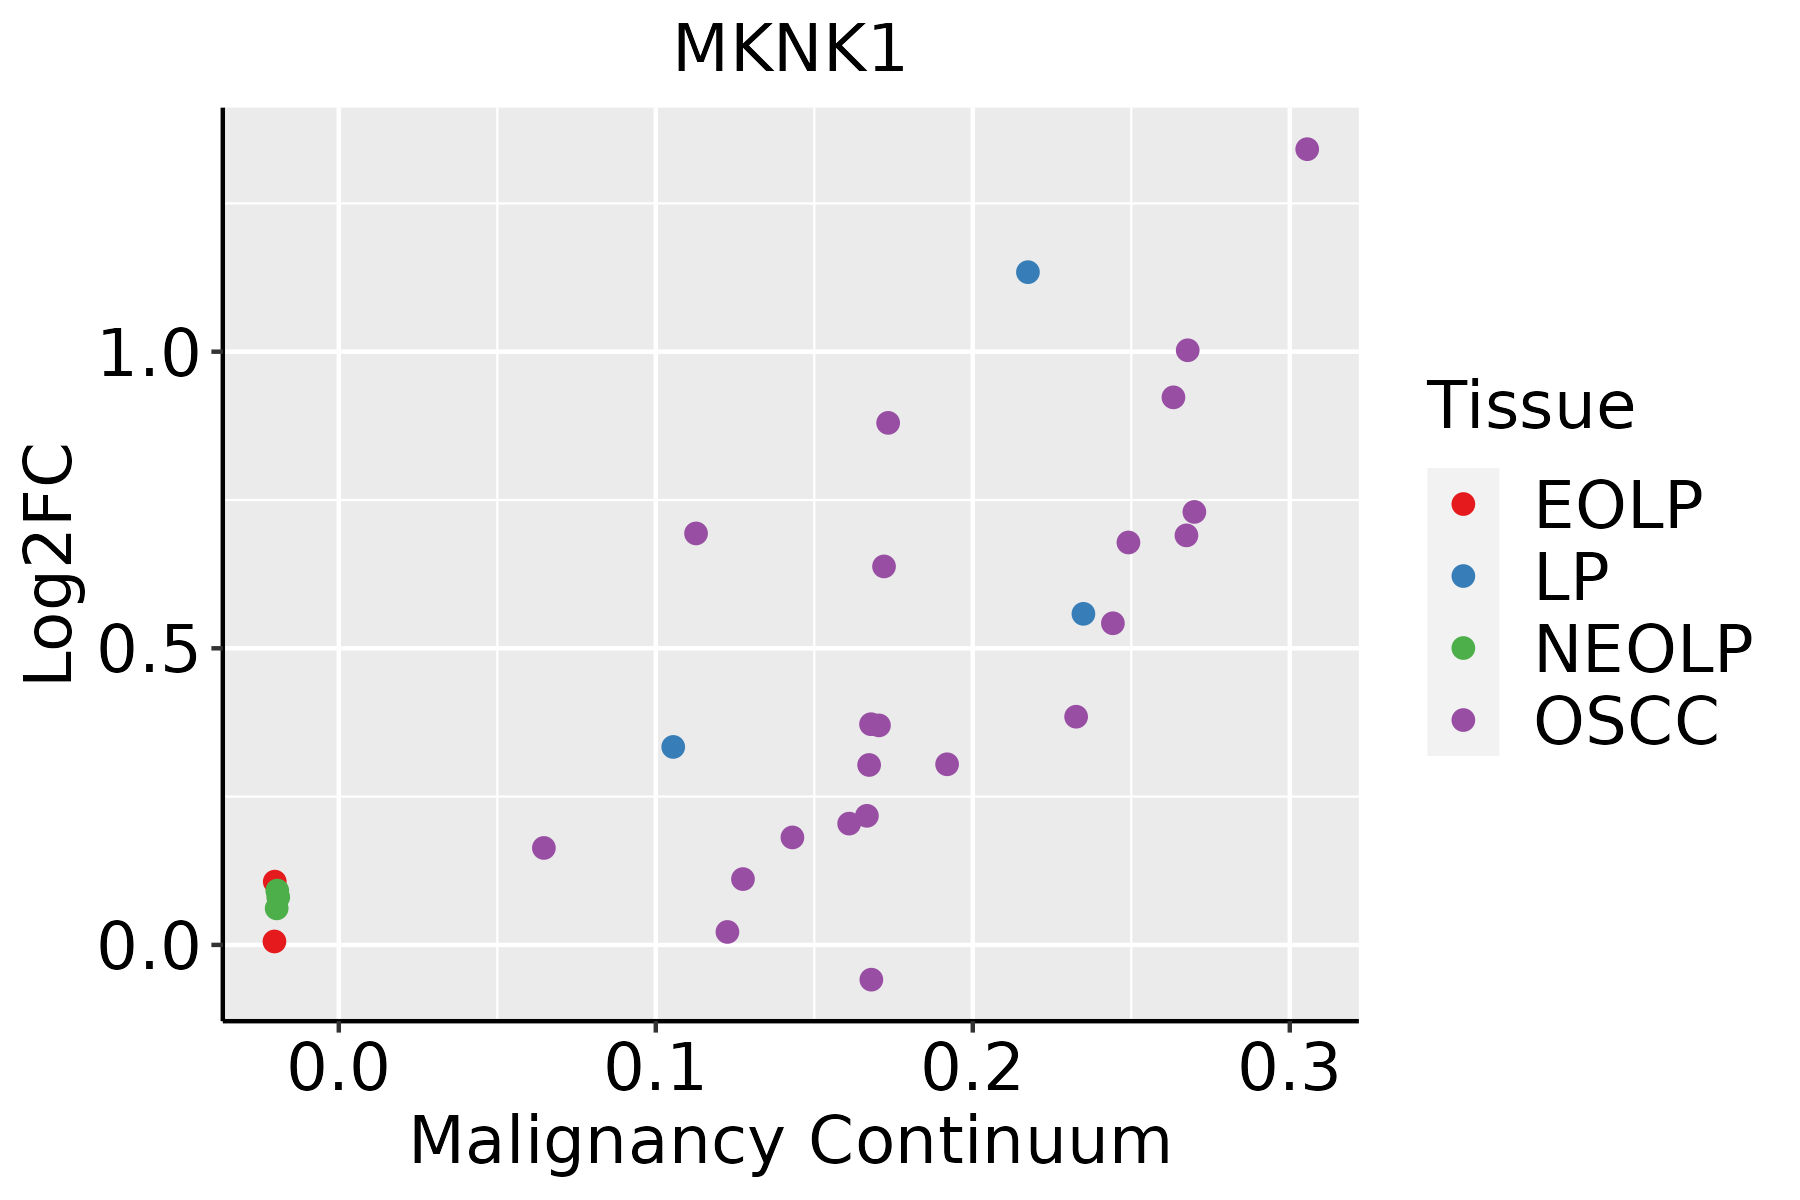 | EOLP: Erosive Oral lichen planus |
| LP: leukoplakia | ||
| NEOLP: Non-erosive oral lichen planus | ||
| OSCC: Oral squamous cell carcinoma | ||
| Skin | 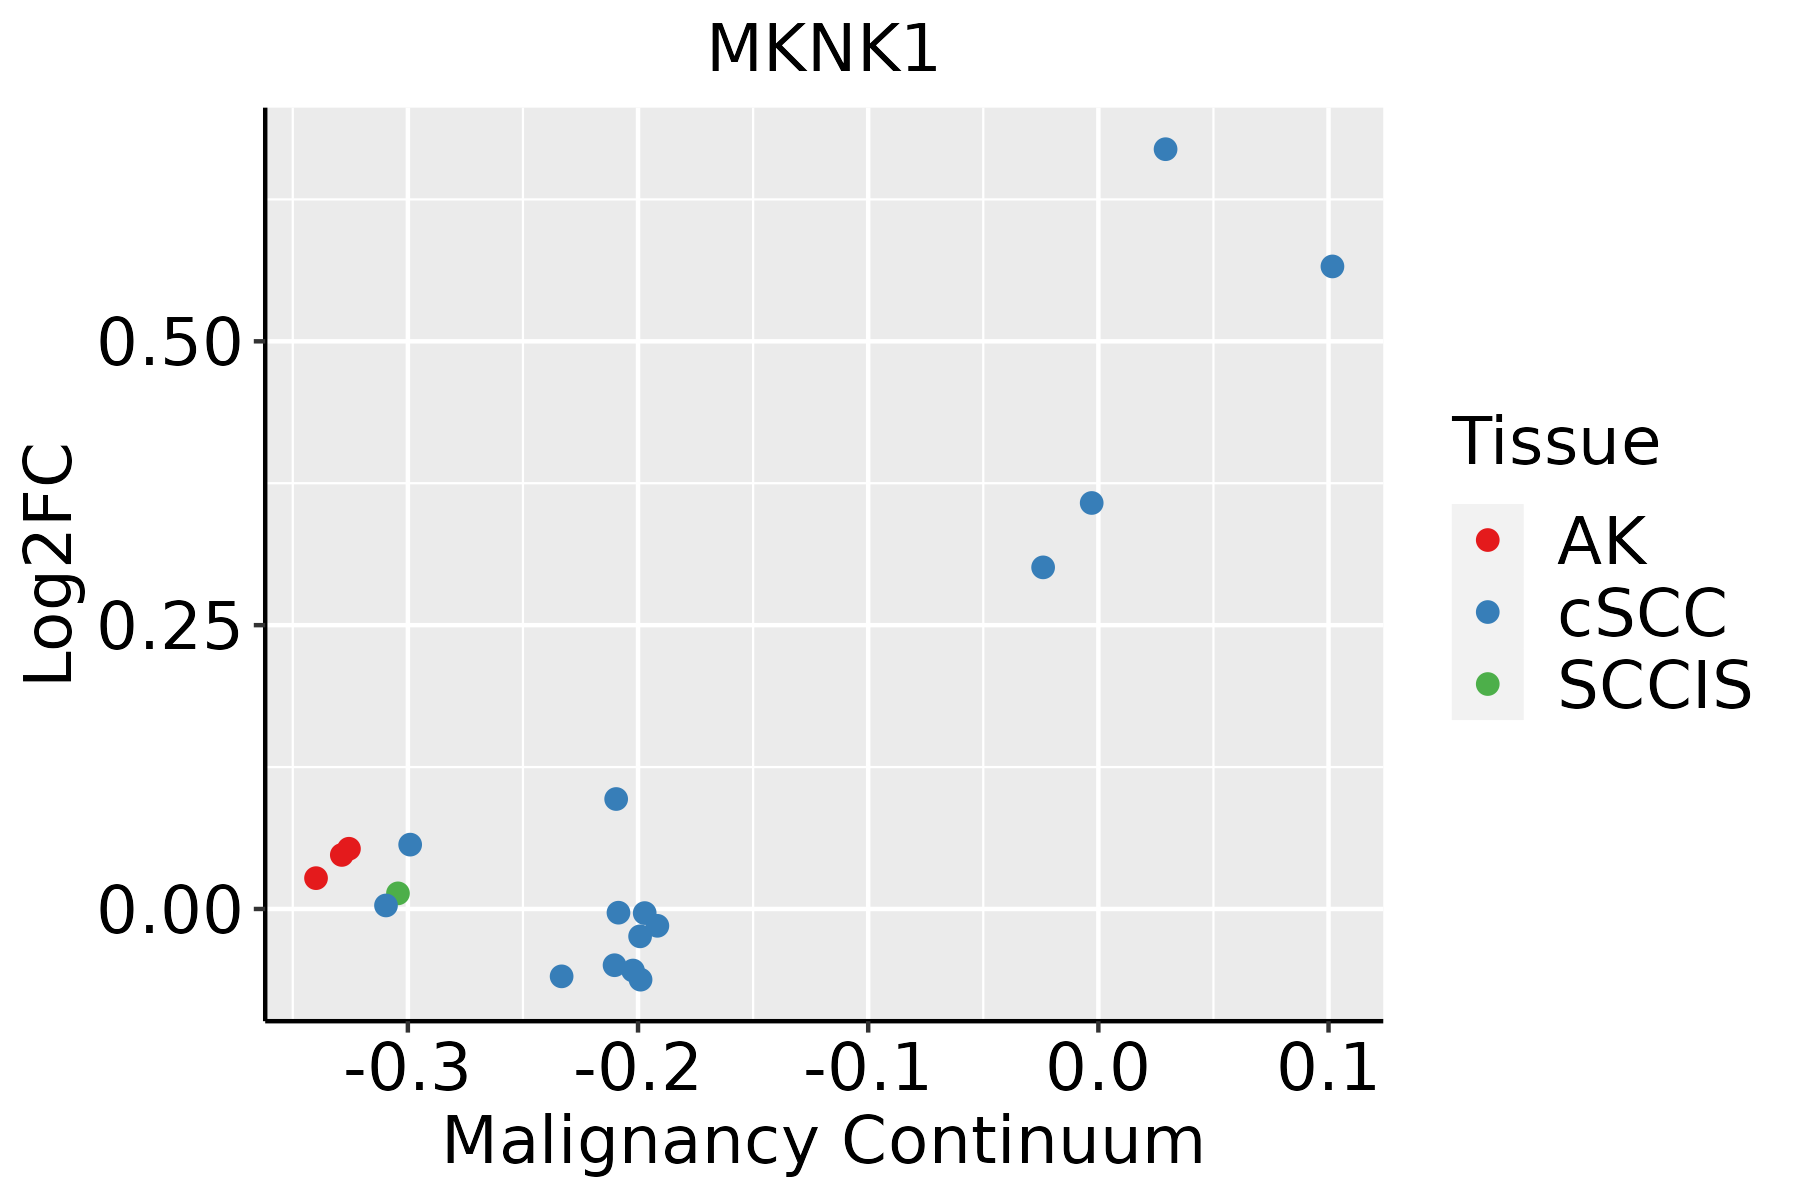 | AK: Actinic keratosis |
| cSCC: Cutaneous squamous cell carcinoma | ||
| SCCIS:squamous cell carcinoma in situ |
| ∗log2FC in expression of this searched gene in stem-like cells from each diseased tissue sample relative to stem-like cells in normal samples in each tissue plotted against the malignancy continuum. Samples are colored based on if they are from different disease stage. |
Top |
Malignant transformation related pathway analysis |
| Find out the enriched GO biological processes and KEGG pathways involved in transition from healthy to precancer to cancer |
| Tissue | Disease Stage | Enriched GO biological Processes |
| Colorectum | AD |  |
| Colorectum | SER |  |
| Colorectum | MSS |  |
| Colorectum | MSI-H |  |
| Colorectum | FAP |  |
| ∗Top 15 enriched GO BP terms are showed in the bar plot of each disease state in each tissue. Each row represents a significant GO biological process which is colored according to the -log10(p.adjust). |
| Page: 1 2 3 4 5 6 7 8 9 |
| GO ID | Tissue | Disease Stage | Description | Gene Ratio | Bg Ratio | pvalue | p.adjust | Count |
| GO:0006417111 | Esophagus | ESCC | regulation of translation | 304/8552 | 468/18723 | 1.53e-17 | 1.33e-15 | 304 |
| GO:004677710 | Esophagus | ESCC | protein autophosphorylation | 138/8552 | 227/18723 | 2.98e-06 | 3.38e-05 | 138 |
| GO:00182099 | Esophagus | ESCC | peptidyl-serine modification | 196/8552 | 338/18723 | 3.07e-06 | 3.47e-05 | 196 |
| GO:001810515 | Esophagus | ESCC | peptidyl-serine phosphorylation | 184/8552 | 315/18723 | 3.22e-06 | 3.61e-05 | 184 |
| GO:000641722 | Liver | HCC | regulation of translation | 287/7958 | 468/18723 | 8.79e-17 | 8.08e-15 | 287 |
| GO:001810511 | Liver | HCC | peptidyl-serine phosphorylation | 169/7958 | 315/18723 | 3.86e-05 | 3.81e-04 | 169 |
| GO:001820911 | Liver | HCC | peptidyl-serine modification | 177/7958 | 338/18723 | 1.45e-04 | 1.17e-03 | 177 |
| GO:00467775 | Liver | HCC | protein autophosphorylation | 123/7958 | 227/18723 | 2.40e-04 | 1.80e-03 | 123 |
| GO:000641720 | Oral cavity | OSCC | regulation of translation | 274/7305 | 468/18723 | 4.39e-18 | 4.63e-16 | 274 |
| GO:00182098 | Oral cavity | OSCC | peptidyl-serine modification | 175/7305 | 338/18723 | 1.09e-06 | 1.46e-05 | 175 |
| GO:001810510 | Oral cavity | OSCC | peptidyl-serine phosphorylation | 164/7305 | 315/18723 | 1.51e-06 | 1.99e-05 | 164 |
| GO:00467779 | Oral cavity | OSCC | protein autophosphorylation | 123/7305 | 227/18723 | 2.31e-06 | 2.93e-05 | 123 |
| GO:0006417110 | Oral cavity | LP | regulation of translation | 175/4623 | 468/18723 | 4.49e-10 | 2.22e-08 | 175 |
| GO:000641729 | Skin | cSCC | regulation of translation | 226/4864 | 468/18723 | 8.78e-26 | 2.62e-23 | 226 |
| GO:004677715 | Skin | cSCC | protein autophosphorylation | 84/4864 | 227/18723 | 1.53e-04 | 1.35e-03 | 84 |
| GO:001820923 | Skin | cSCC | peptidyl-serine modification | 108/4864 | 338/18723 | 7.73e-03 | 3.60e-02 | 108 |
| Page: 1 |
| Pathway ID | Tissue | Disease Stage | Description | Gene Ratio | Bg Ratio | pvalue | p.adjust | qvalue | Count |
| hsa0406629 | Esophagus | ESCC | HIF-1 signaling pathway | 75/4205 | 109/8465 | 3.66e-05 | 1.68e-04 | 8.60e-05 | 75 |
| hsa049109 | Esophagus | ESCC | Insulin signaling pathway | 89/4205 | 137/8465 | 1.97e-04 | 7.32e-04 | 3.75e-04 | 89 |
| hsa04066113 | Esophagus | ESCC | HIF-1 signaling pathway | 75/4205 | 109/8465 | 3.66e-05 | 1.68e-04 | 8.60e-05 | 75 |
| hsa0491014 | Esophagus | ESCC | Insulin signaling pathway | 89/4205 | 137/8465 | 1.97e-04 | 7.32e-04 | 3.75e-04 | 89 |
| hsa0491041 | Liver | HCC | Insulin signaling pathway | 95/4020 | 137/8465 | 1.53e-07 | 1.97e-06 | 1.10e-06 | 95 |
| hsa0406622 | Liver | HCC | HIF-1 signaling pathway | 70/4020 | 109/8465 | 2.96e-04 | 1.36e-03 | 7.57e-04 | 70 |
| hsa0491051 | Liver | HCC | Insulin signaling pathway | 95/4020 | 137/8465 | 1.53e-07 | 1.97e-06 | 1.10e-06 | 95 |
| hsa0406632 | Liver | HCC | HIF-1 signaling pathway | 70/4020 | 109/8465 | 2.96e-04 | 1.36e-03 | 7.57e-04 | 70 |
| hsa049108 | Oral cavity | OSCC | Insulin signaling pathway | 83/3704 | 137/8465 | 4.83e-05 | 2.00e-04 | 1.02e-04 | 83 |
| hsa0406627 | Oral cavity | OSCC | HIF-1 signaling pathway | 68/3704 | 109/8465 | 6.30e-05 | 2.48e-04 | 1.26e-04 | 68 |
| hsa0401014 | Oral cavity | OSCC | MAPK signaling pathway | 165/3704 | 302/8465 | 7.11e-05 | 2.74e-04 | 1.40e-04 | 165 |
| hsa0491013 | Oral cavity | OSCC | Insulin signaling pathway | 83/3704 | 137/8465 | 4.83e-05 | 2.00e-04 | 1.02e-04 | 83 |
| hsa04066112 | Oral cavity | OSCC | HIF-1 signaling pathway | 68/3704 | 109/8465 | 6.30e-05 | 2.48e-04 | 1.26e-04 | 68 |
| hsa0401015 | Oral cavity | OSCC | MAPK signaling pathway | 165/3704 | 302/8465 | 7.11e-05 | 2.74e-04 | 1.40e-04 | 165 |
| hsa0406628 | Oral cavity | LP | HIF-1 signaling pathway | 42/2418 | 109/8465 | 1.52e-02 | 4.75e-02 | 3.06e-02 | 42 |
| hsa0406636 | Oral cavity | LP | HIF-1 signaling pathway | 42/2418 | 109/8465 | 1.52e-02 | 4.75e-02 | 3.06e-02 | 42 |
| Page: 1 |
Top |
Cell-cell communication analysis |
| Identification of potential cell-cell interactions between two cell types and their ligand-receptor pairs for different disease states |
| Ligand | Receptor | LRpair | Pathway | Tissue | Disease Stage |
| Page: 1 |
Top |
Single-cell gene regulatory network inference analysis |
| Find out the significant the regulons (TFs) and the target genes of each regulon across cell types for different disease states |
| TF | Cell Type | Tissue | Disease Stage | Target Gene | RSS | Regulon Activity |
| ∗The dot plots of a searched regulon are shown for all cell subpopulations in each disease state of each tissue based on the regulon specific score inferred using pySCENIC and by calculating the average expression. |
| Page: 1 |
Top |
Somatic mutation of malignant transformation related genes |
| Annotation of somatic variants for genes involved in malignant transformation |
| Hugo Symbol | Variant Class | Variant Classification | dbSNP RS | HGVSc | HGVSp | HGVSp Short | SWISSPROT | BIOTYPE | SIFT | PolyPhen | Tumor Sample Barcode | Tissue | Histology | Sex | Age | Stage | Therapy Types | Drugs | Outcome |
| MKNK1 | SNV | Missense_Mutation | novel | c.139N>G | p.Met47Val | p.M47V | Q9BUB5 | protein_coding | tolerated(1) | benign(0) | TCGA-A8-A09Z-01 | Breast | breast invasive carcinoma | Female | >=65 | I/II | Unknown | Unknown | SD |
| MKNK1 | SNV | Missense_Mutation | novel | c.94N>T | p.Arg32Trp | p.R32W | Q9BUB5 | protein_coding | deleterious(0) | probably_damaging(0.945) | TCGA-BH-A1FU-01 | Breast | breast invasive carcinoma | Female | <65 | I/II | Unknown | Unknown | PD |
| MKNK1 | SNV | Missense_Mutation | novel | c.13N>G | p.Gln5Glu | p.Q5E | Q9BUB5 | protein_coding | tolerated_low_confidence(0.12) | benign(0.011) | TCGA-DR-A0ZM-01 | Cervix | cervical & endocervical cancer | Female | <65 | III/IV | Unspecific | Cisplatin | SD |
| MKNK1 | SNV | Missense_Mutation | novel | c.224N>G | p.Tyr75Cys | p.Y75C | Q9BUB5 | protein_coding | deleterious(0.03) | probably_damaging(0.994) | TCGA-A6-2672-01 | Colorectum | colon adenocarcinoma | Female | >=65 | III/IV | Unknown | Unknown | SD |
| MKNK1 | SNV | Missense_Mutation | novel | c.1201N>C | p.Phe401Leu | p.F401L | Q9BUB5 | protein_coding | tolerated(0.06) | probably_damaging(0.998) | TCGA-CM-6171-01 | Colorectum | colon adenocarcinoma | Female | >=65 | I/II | Unknown | Unknown | SD |
| MKNK1 | SNV | Missense_Mutation | novel | c.1229G>A | p.Arg410His | p.R410H | Q9BUB5 | protein_coding | deleterious(0) | probably_damaging(0.999) | TCGA-WS-AB45-01 | Colorectum | colon adenocarcinoma | Female | <65 | I/II | Unknown | Unknown | SD |
| MKNK1 | SNV | Missense_Mutation | novel | c.227C>A | p.Ala76Asp | p.A76D | Q9BUB5 | protein_coding | deleterious(0) | probably_damaging(0.999) | TCGA-EI-6507-01 | Colorectum | rectum adenocarcinoma | Male | <65 | I/II | Unknown | Unknown | SD |
| MKNK1 | SNV | Missense_Mutation | rs200209678 | c.1327N>T | p.Arg443Cys | p.R443C | Q9BUB5 | protein_coding | deleterious(0) | possibly_damaging(0.732) | TCGA-A5-A0G1-01 | Endometrium | uterine corpus endometrioid carcinoma | Female | >=65 | I/II | Unknown | Unknown | SD |
| MKNK1 | SNV | Missense_Mutation | novel | c.464N>T | p.Ala155Val | p.A155V | Q9BUB5 | protein_coding | deleterious(0.01) | probably_damaging(0.967) | TCGA-A5-A0G1-01 | Endometrium | uterine corpus endometrioid carcinoma | Female | >=65 | I/II | Unknown | Unknown | SD |
| MKNK1 | SNV | Missense_Mutation | novel | c.1014N>T | p.Lys338Asn | p.K338N | Q9BUB5 | protein_coding | deleterious(0.04) | possibly_damaging(0.826) | TCGA-A5-A7WJ-01 | Endometrium | uterine corpus endometrioid carcinoma | Female | <65 | I/II | Unknown | Unknown | SD |
| Page: 1 2 3 4 |
Top |
Related drugs of malignant transformation related genes |
| Identification of chemicals and drugs interact with genes involved in malignant transfromation |
| (DGIdb 4.0) |
| Entrez ID | Symbol | Category | Interaction Types | Drug Claim Name | Drug Name | PMIDs |
| 8569 | MKNK1 | SERINE THREONINE KINASE, CLINICALLY ACTIONABLE, DRUGGABLE GENOME, KINASE, ENZYME | CGP-57380 | CHEMBL1240885 | 25800647 | |
| 8569 | MKNK1 | SERINE THREONINE KINASE, CLINICALLY ACTIONABLE, DRUGGABLE GENOME, KINASE, ENZYME | EFT508 | TOMIVOSERTIB | ||
| 8569 | MKNK1 | SERINE THREONINE KINASE, CLINICALLY ACTIONABLE, DRUGGABLE GENOME, KINASE, ENZYME | inhibitor | 178101606 | DORSOMORPHIN | |
| 8569 | MKNK1 | SERINE THREONINE KINASE, CLINICALLY ACTIONABLE, DRUGGABLE GENOME, KINASE, ENZYME | inhibitor | 178102632 | ||
| 8569 | MKNK1 | SERINE THREONINE KINASE, CLINICALLY ACTIONABLE, DRUGGABLE GENOME, KINASE, ENZYME | inhibitor | 381118877 | TOMIVOSERTIB |
| Page: 1 |

Copyright 2023-Present -The University of Texas Health Science Center at Houston |