
|
|||||
|
 | |
| |
| |
| |
| |
| |
|
Gene: MKLN1 |
Gene summary for MKLN1 |
| Gene information | Species | Human | Gene symbol | MKLN1 | Gene ID | 4289 |
| Gene name | muskelin 1 | |
| Gene Alias | TWA2 | |
| Cytomap | 7q32.3 | |
| Gene Type | protein-coding | GO ID | GO:0000902 | UniProtAcc | B4DG30 |
Top |
Malignant transformation analysis |
| Identification of the aberrant gene expression in precancerous and cancerous lesions by comparing the gene expression of stem-like cells in diseased tissues with normal stem cells |
| Entrez ID | Symbol | Replicates | Species | Organ | Tissue | Adj P-value | Log2FC | Malignancy |
| 4289 | MKLN1 | CCI_2 | Human | Cervix | CC | 2.57e-07 | 9.14e-01 | 0.5249 |
| 4289 | MKLN1 | CCI_3 | Human | Cervix | CC | 3.84e-03 | 6.04e-01 | 0.516 |
| 4289 | MKLN1 | HTA11_3410_2000001011 | Human | Colorectum | AD | 5.07e-08 | -3.89e-01 | 0.0155 |
| 4289 | MKLN1 | HTA11_99999965104_69814 | Human | Colorectum | MSS | 3.35e-10 | 8.02e-01 | 0.281 |
| 4289 | MKLN1 | A001-C-207 | Human | Colorectum | FAP | 7.40e-04 | -3.34e-01 | 0.1278 |
| 4289 | MKLN1 | A015-C-203 | Human | Colorectum | FAP | 1.05e-39 | -6.94e-01 | -0.1294 |
| 4289 | MKLN1 | A015-C-204 | Human | Colorectum | FAP | 5.52e-11 | -4.87e-01 | -0.0228 |
| 4289 | MKLN1 | A014-C-040 | Human | Colorectum | FAP | 1.24e-07 | -6.76e-01 | -0.1184 |
| 4289 | MKLN1 | A002-C-201 | Human | Colorectum | FAP | 8.47e-17 | -4.83e-01 | 0.0324 |
| 4289 | MKLN1 | A002-C-203 | Human | Colorectum | FAP | 6.76e-03 | -3.58e-02 | 0.2786 |
| 4289 | MKLN1 | A001-C-119 | Human | Colorectum | FAP | 1.92e-13 | -6.22e-01 | -0.1557 |
| 4289 | MKLN1 | A001-C-108 | Human | Colorectum | FAP | 1.76e-24 | -4.79e-01 | -0.0272 |
| 4289 | MKLN1 | A002-C-205 | Human | Colorectum | FAP | 7.47e-29 | -5.97e-01 | -0.1236 |
| 4289 | MKLN1 | A001-C-104 | Human | Colorectum | FAP | 7.78e-12 | -4.48e-01 | 0.0184 |
| 4289 | MKLN1 | A015-C-005 | Human | Colorectum | FAP | 1.14e-06 | -4.47e-01 | -0.0336 |
| 4289 | MKLN1 | A015-C-006 | Human | Colorectum | FAP | 3.36e-24 | -7.69e-01 | -0.0994 |
| 4289 | MKLN1 | A015-C-106 | Human | Colorectum | FAP | 4.62e-16 | -4.10e-01 | -0.0511 |
| 4289 | MKLN1 | A002-C-114 | Human | Colorectum | FAP | 1.28e-27 | -6.50e-01 | -0.1561 |
| 4289 | MKLN1 | A015-C-104 | Human | Colorectum | FAP | 2.29e-41 | -7.23e-01 | -0.1899 |
| 4289 | MKLN1 | A001-C-014 | Human | Colorectum | FAP | 2.74e-25 | -5.01e-01 | 0.0135 |
| Page: 1 2 3 4 5 6 7 8 9 10 11 12 |
| Tissue | Expression Dynamics | Abbreviation |
| Cervix |  | CC: Cervix cancer |
| HSIL_HPV: HPV-infected high-grade squamous intraepithelial lesions | ||
| N_HPV: HPV-infected normal cervix | ||
| Colorectum (GSE201348) |  | FAP: Familial adenomatous polyposis |
| CRC: Colorectal cancer | ||
| Colorectum (HTA11) | 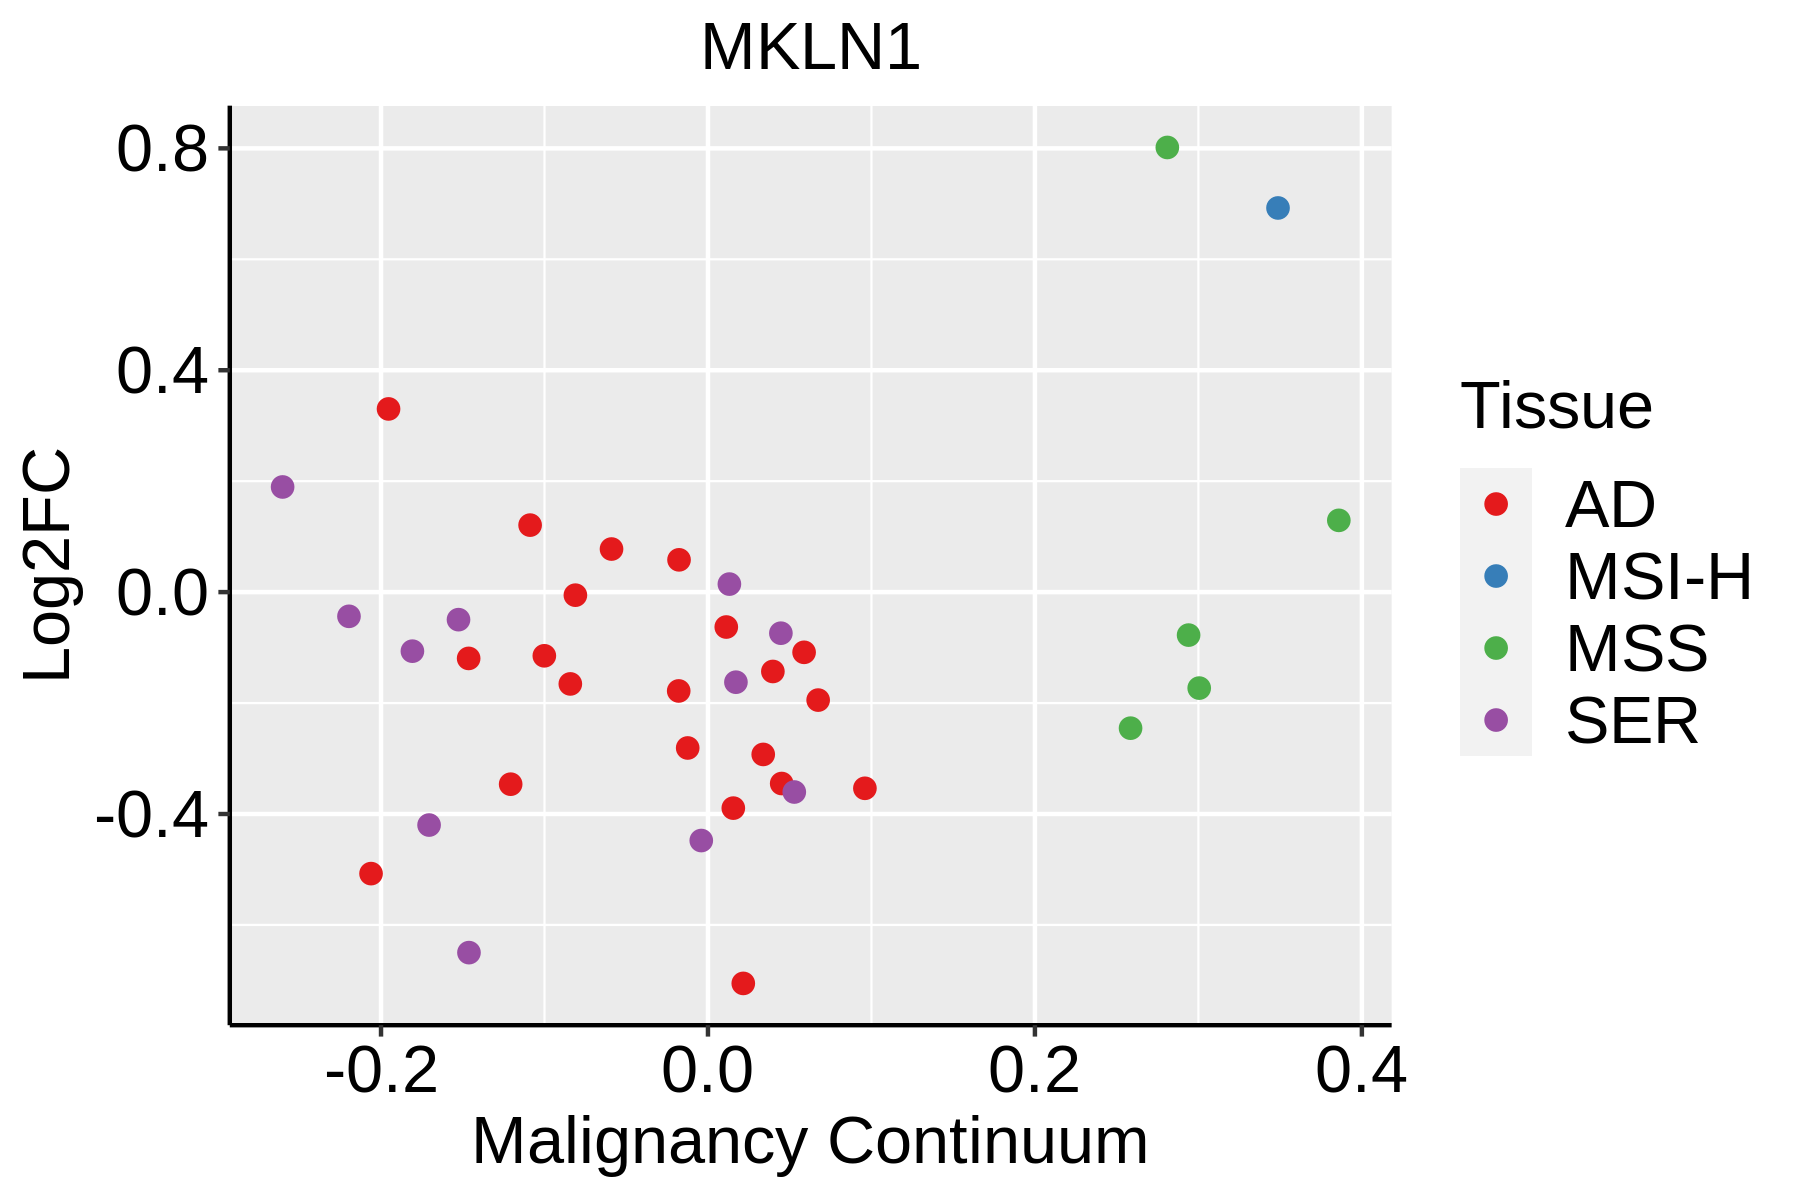 | AD: Adenomas |
| SER: Sessile serrated lesions | ||
| MSI-H: Microsatellite-high colorectal cancer | ||
| MSS: Microsatellite stable colorectal cancer | ||
| Endometrium | 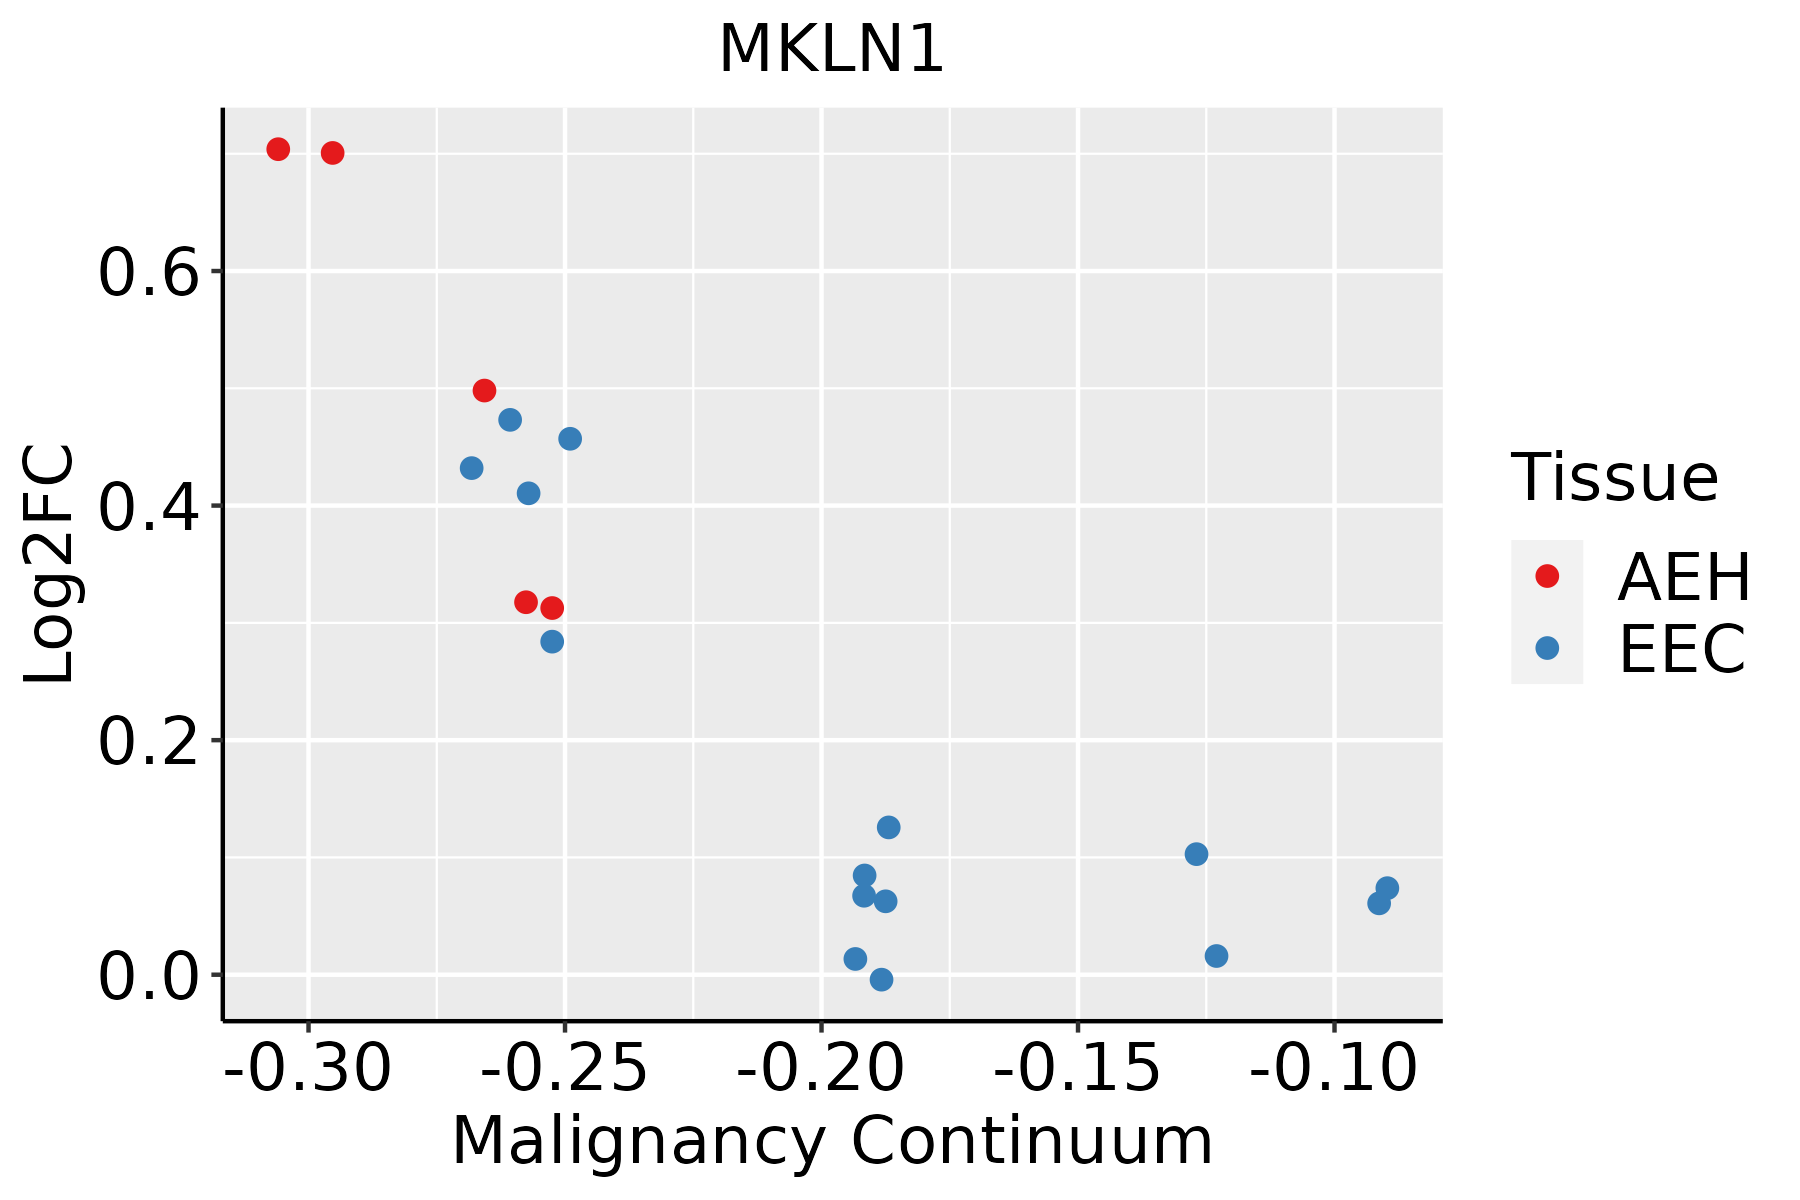 | AEH: Atypical endometrial hyperplasia |
| EEC: Endometrioid Cancer | ||
| Esophagus |  | ESCC: Esophageal squamous cell carcinoma |
| HGIN: High-grade intraepithelial neoplasias | ||
| LGIN: Low-grade intraepithelial neoplasias | ||
| GC | 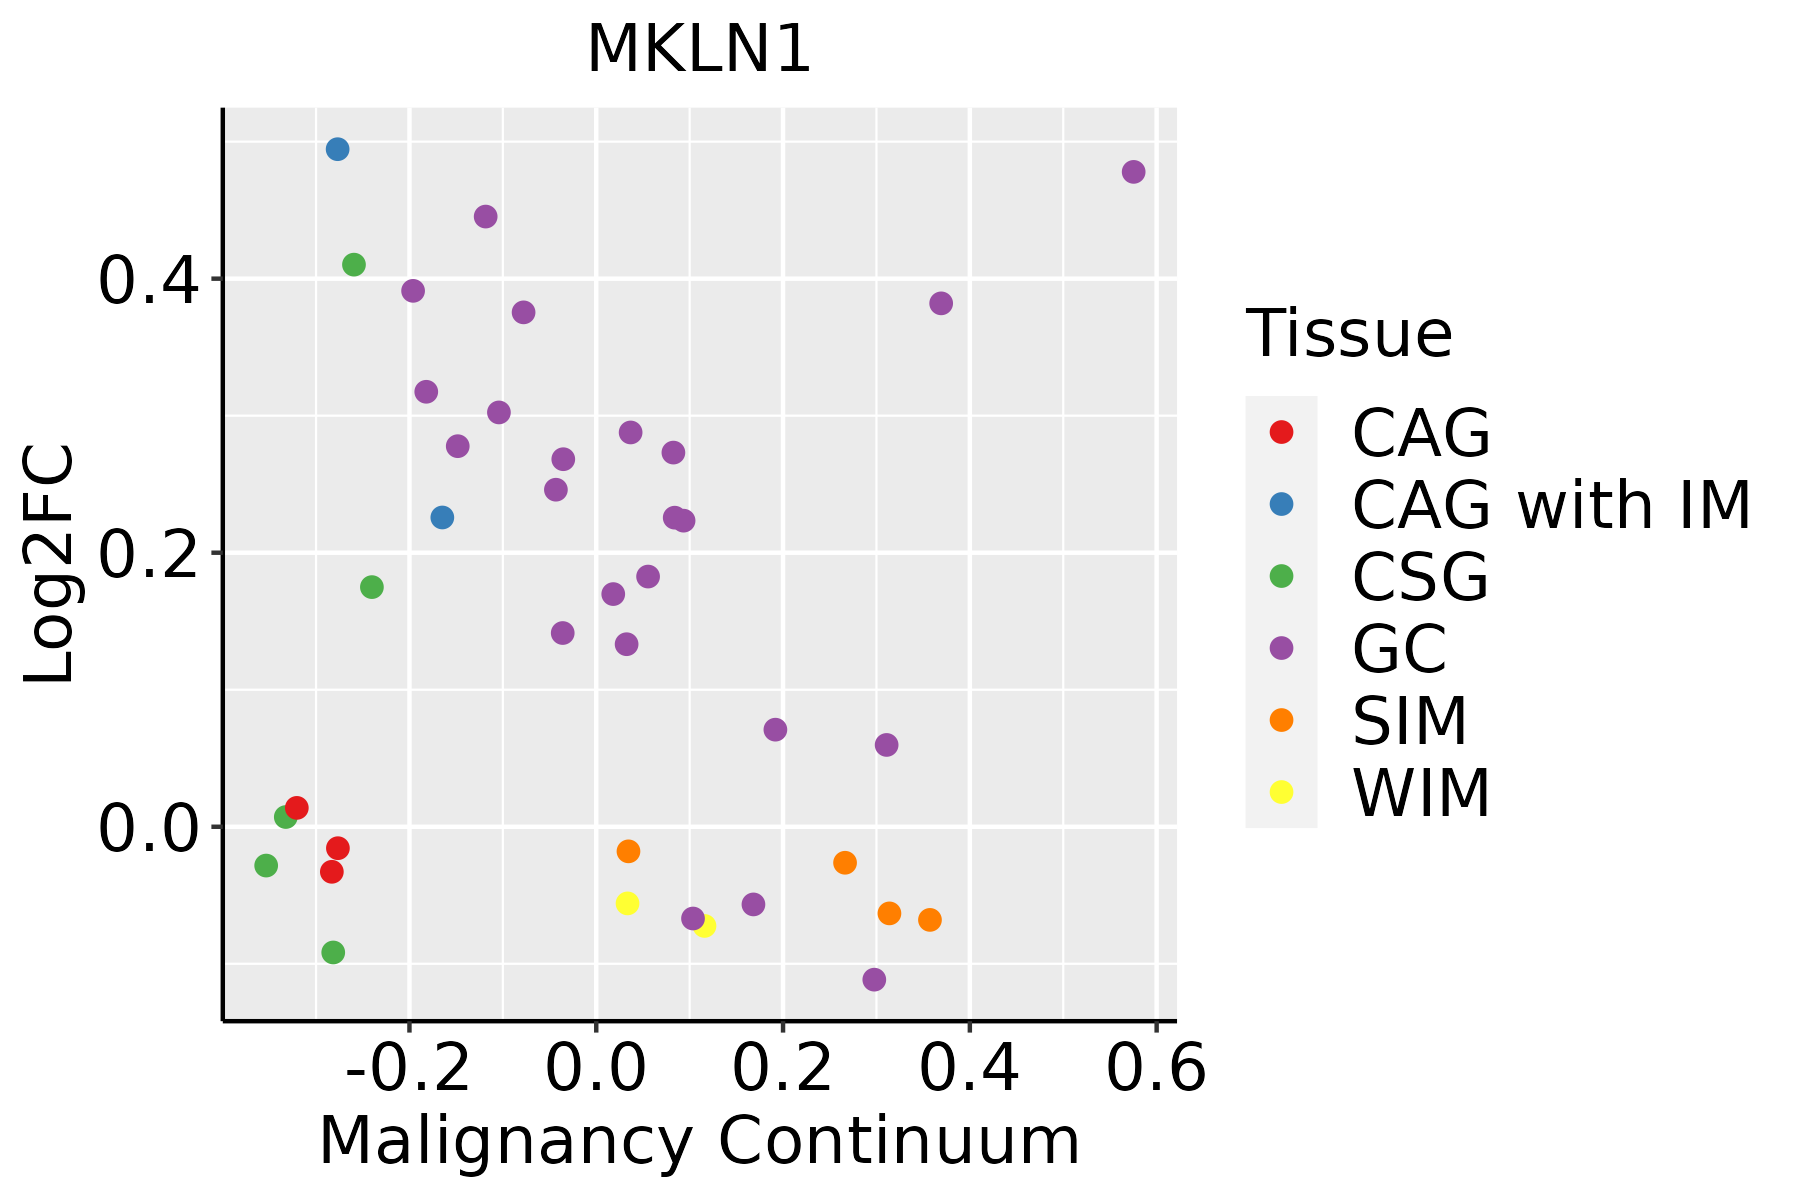 | CAG: Chronic atrophic gastritis |
| CAG with IM: Chronic atrophic gastritis with intestinal metaplasia | ||
| CSG: Chronic superficial gastritis | ||
| GC: Gastric cancer | ||
| SIM: Severe intestinal metaplasia | ||
| WIM: Wild intestinal metaplasia | ||
| Liver | 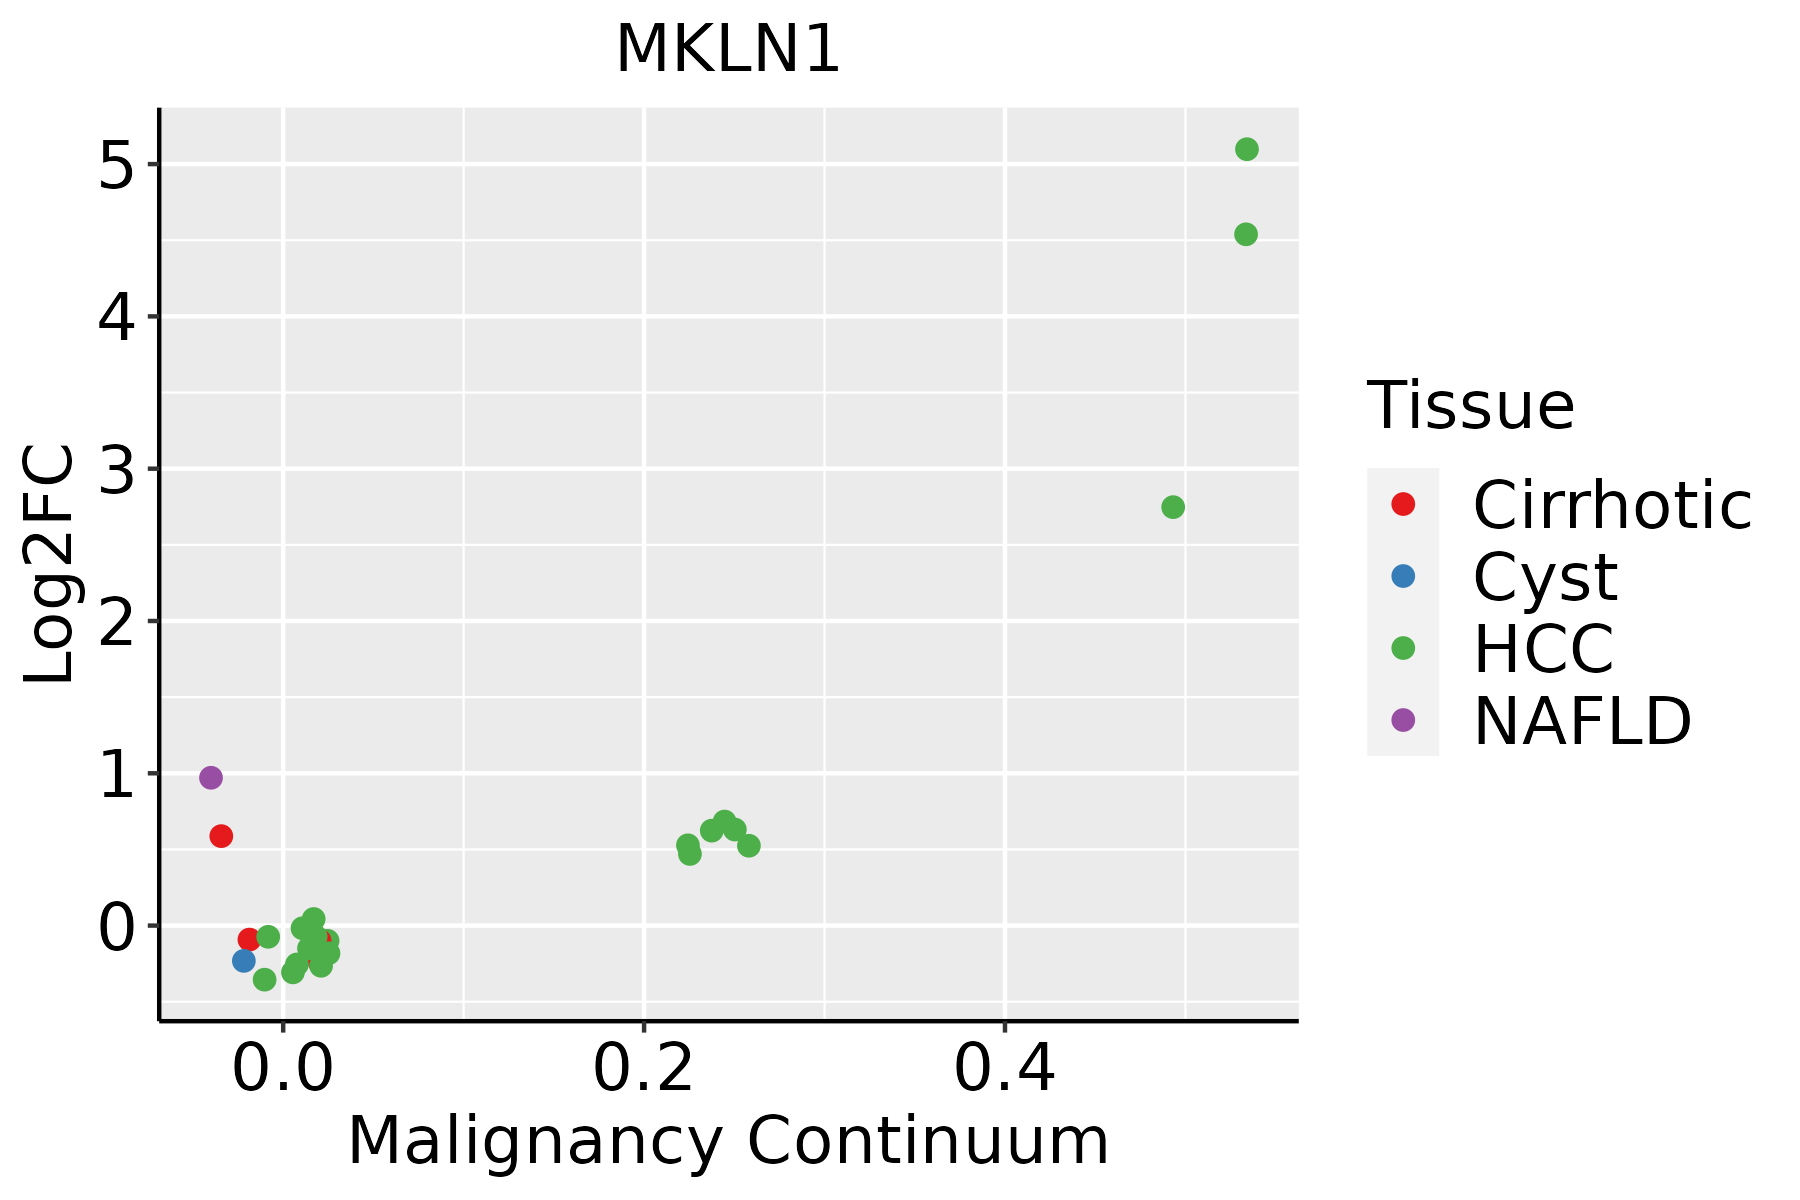 | HCC: Hepatocellular carcinoma |
| NAFLD: Non-alcoholic fatty liver disease | ||
| Lung | 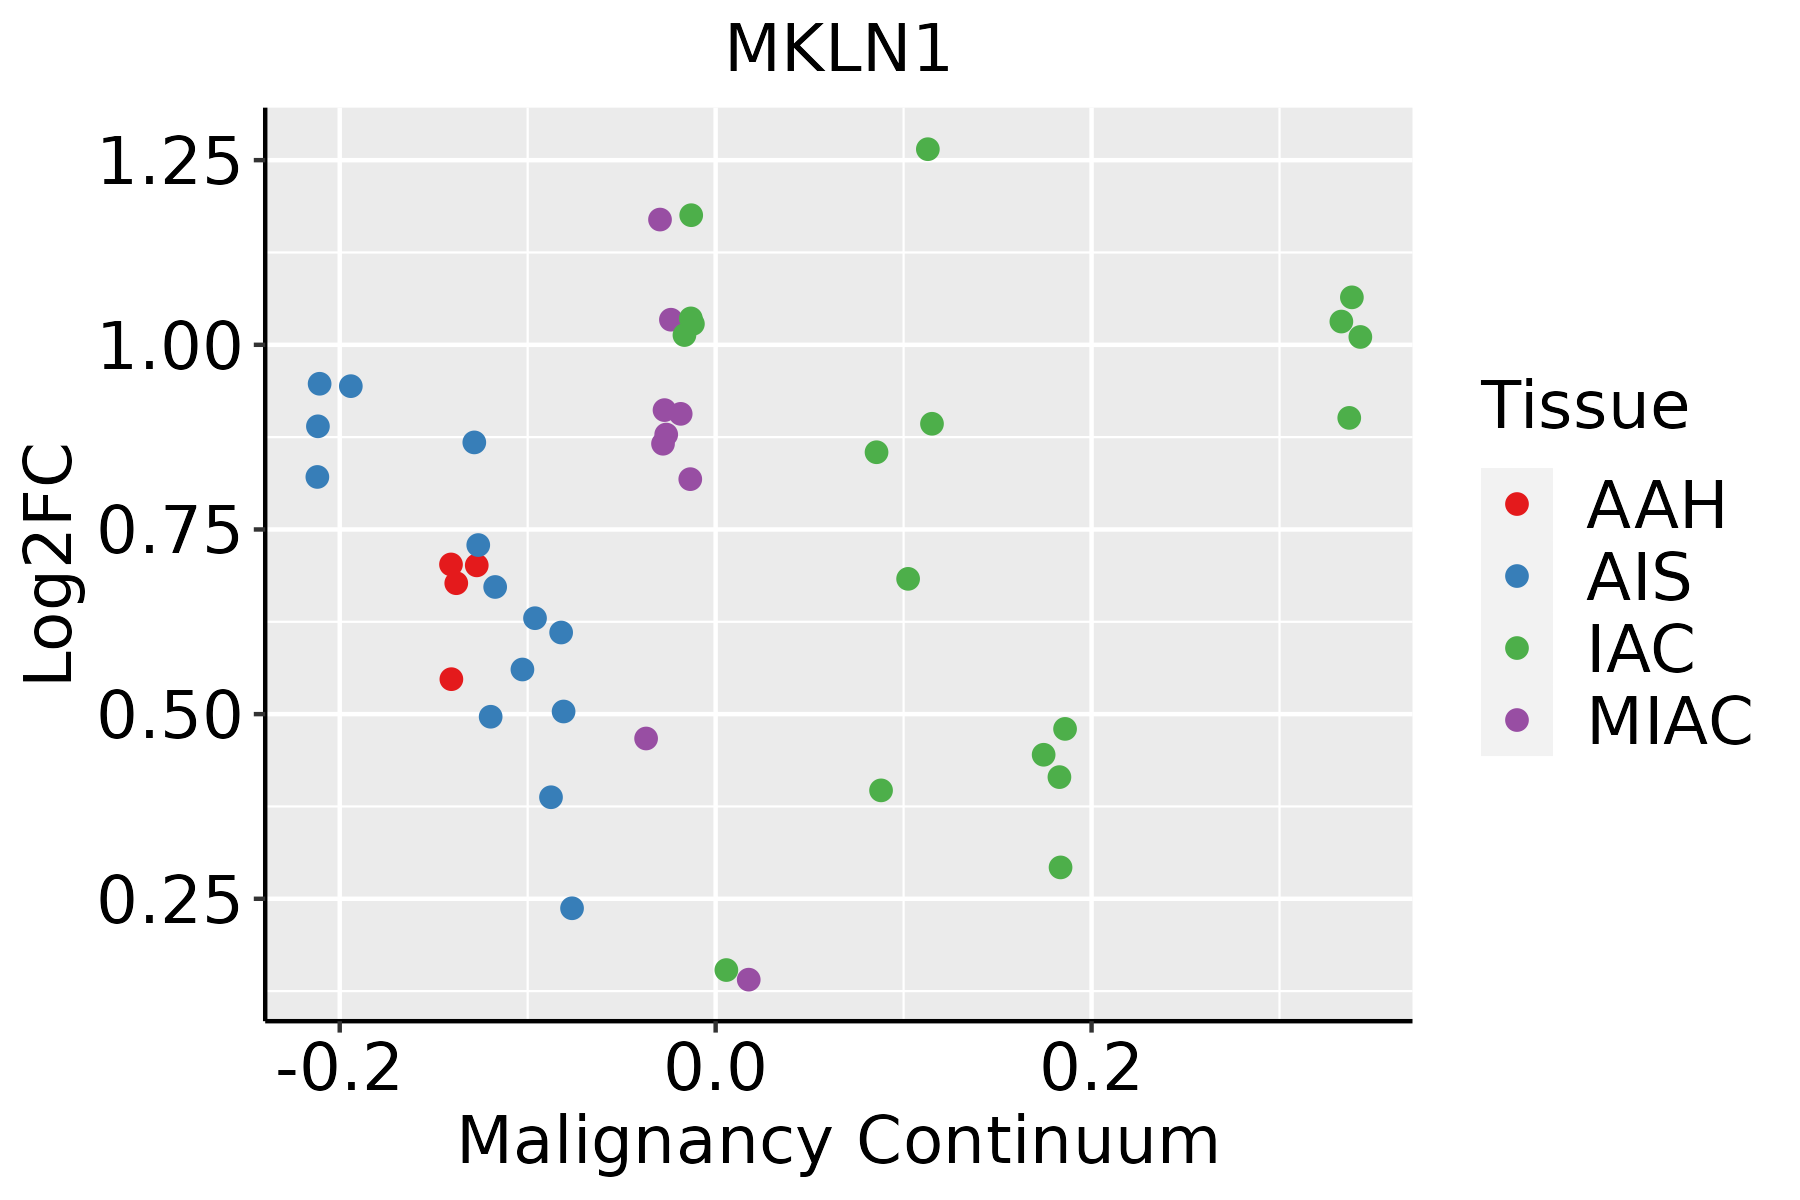 | AAH: Atypical adenomatous hyperplasia |
| AIS: Adenocarcinoma in situ | ||
| IAC: Invasive lung adenocarcinoma | ||
| MIA: Minimally invasive adenocarcinoma | ||
| Oral Cavity | 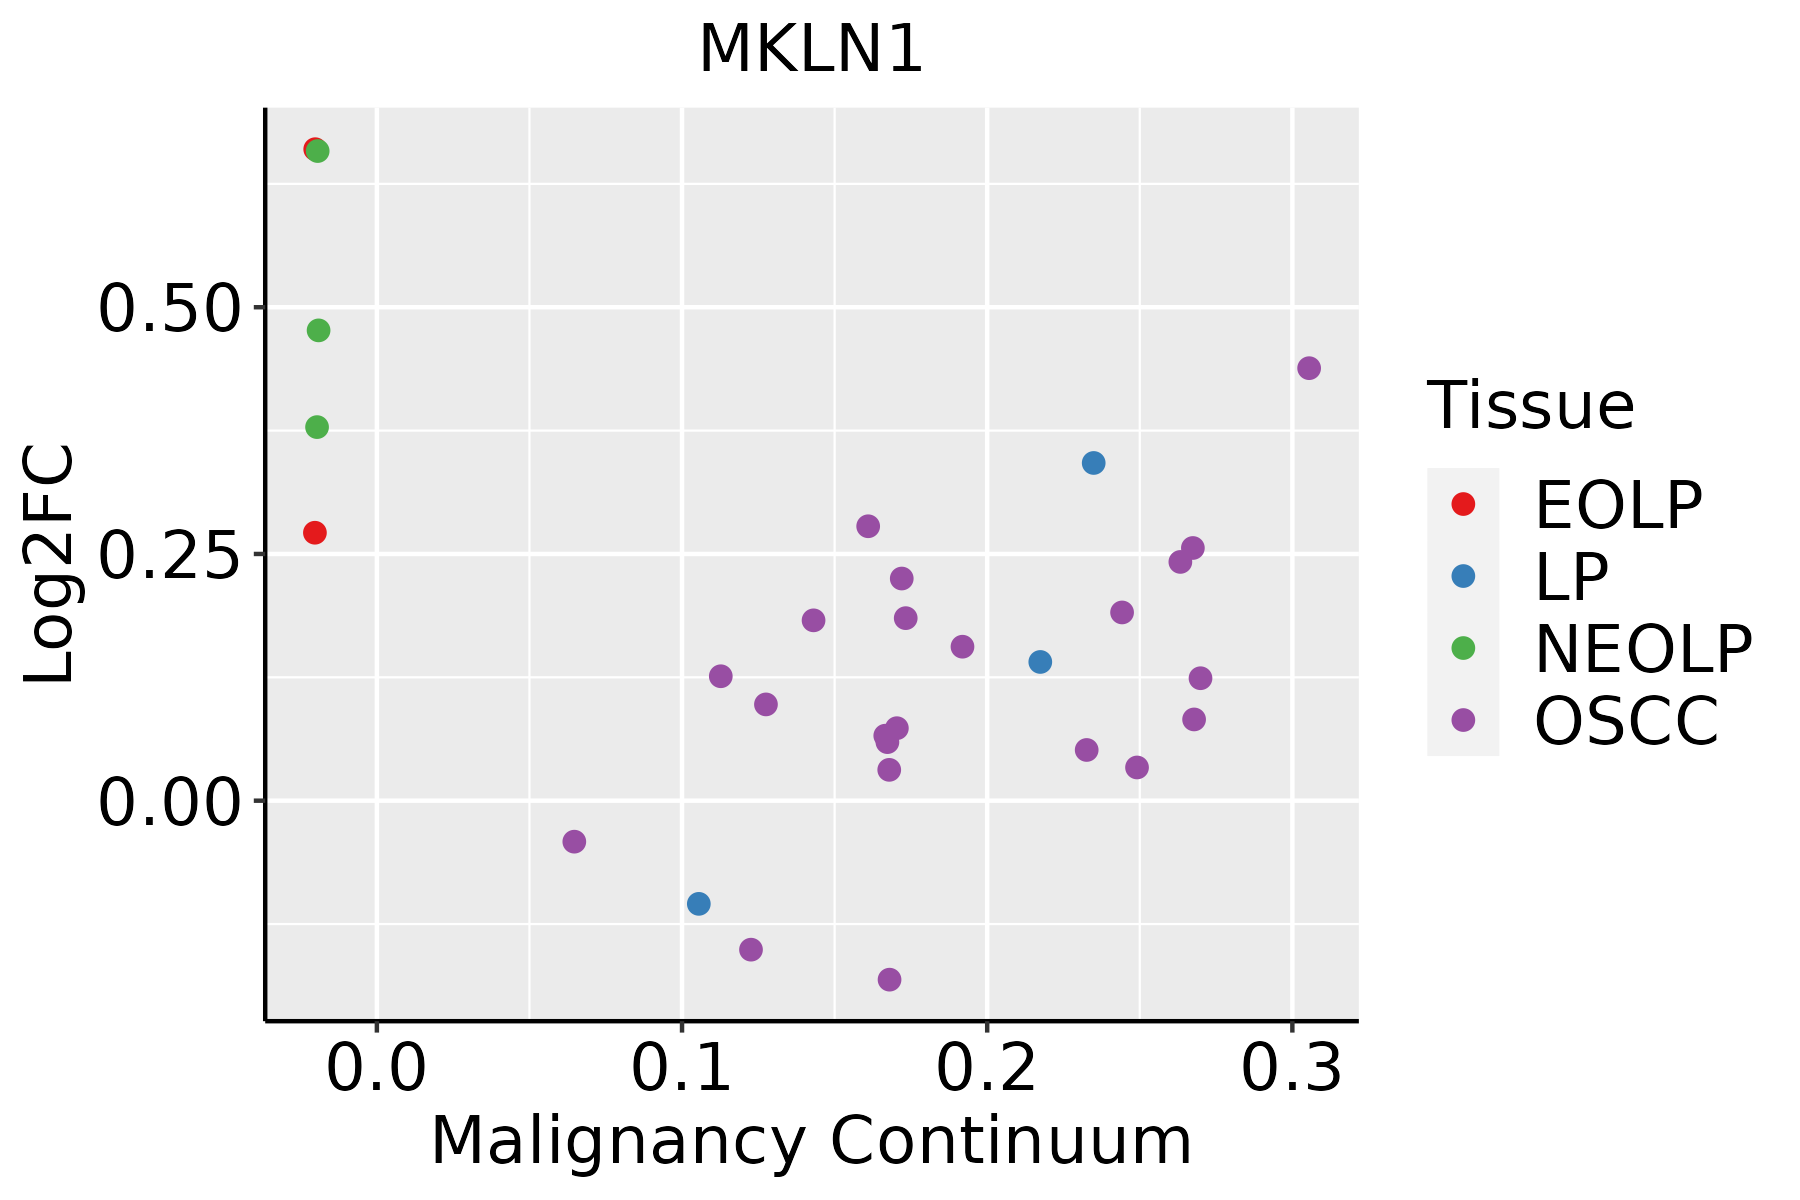 | EOLP: Erosive Oral lichen planus |
| LP: leukoplakia | ||
| NEOLP: Non-erosive oral lichen planus | ||
| OSCC: Oral squamous cell carcinoma | ||
| Prostate | 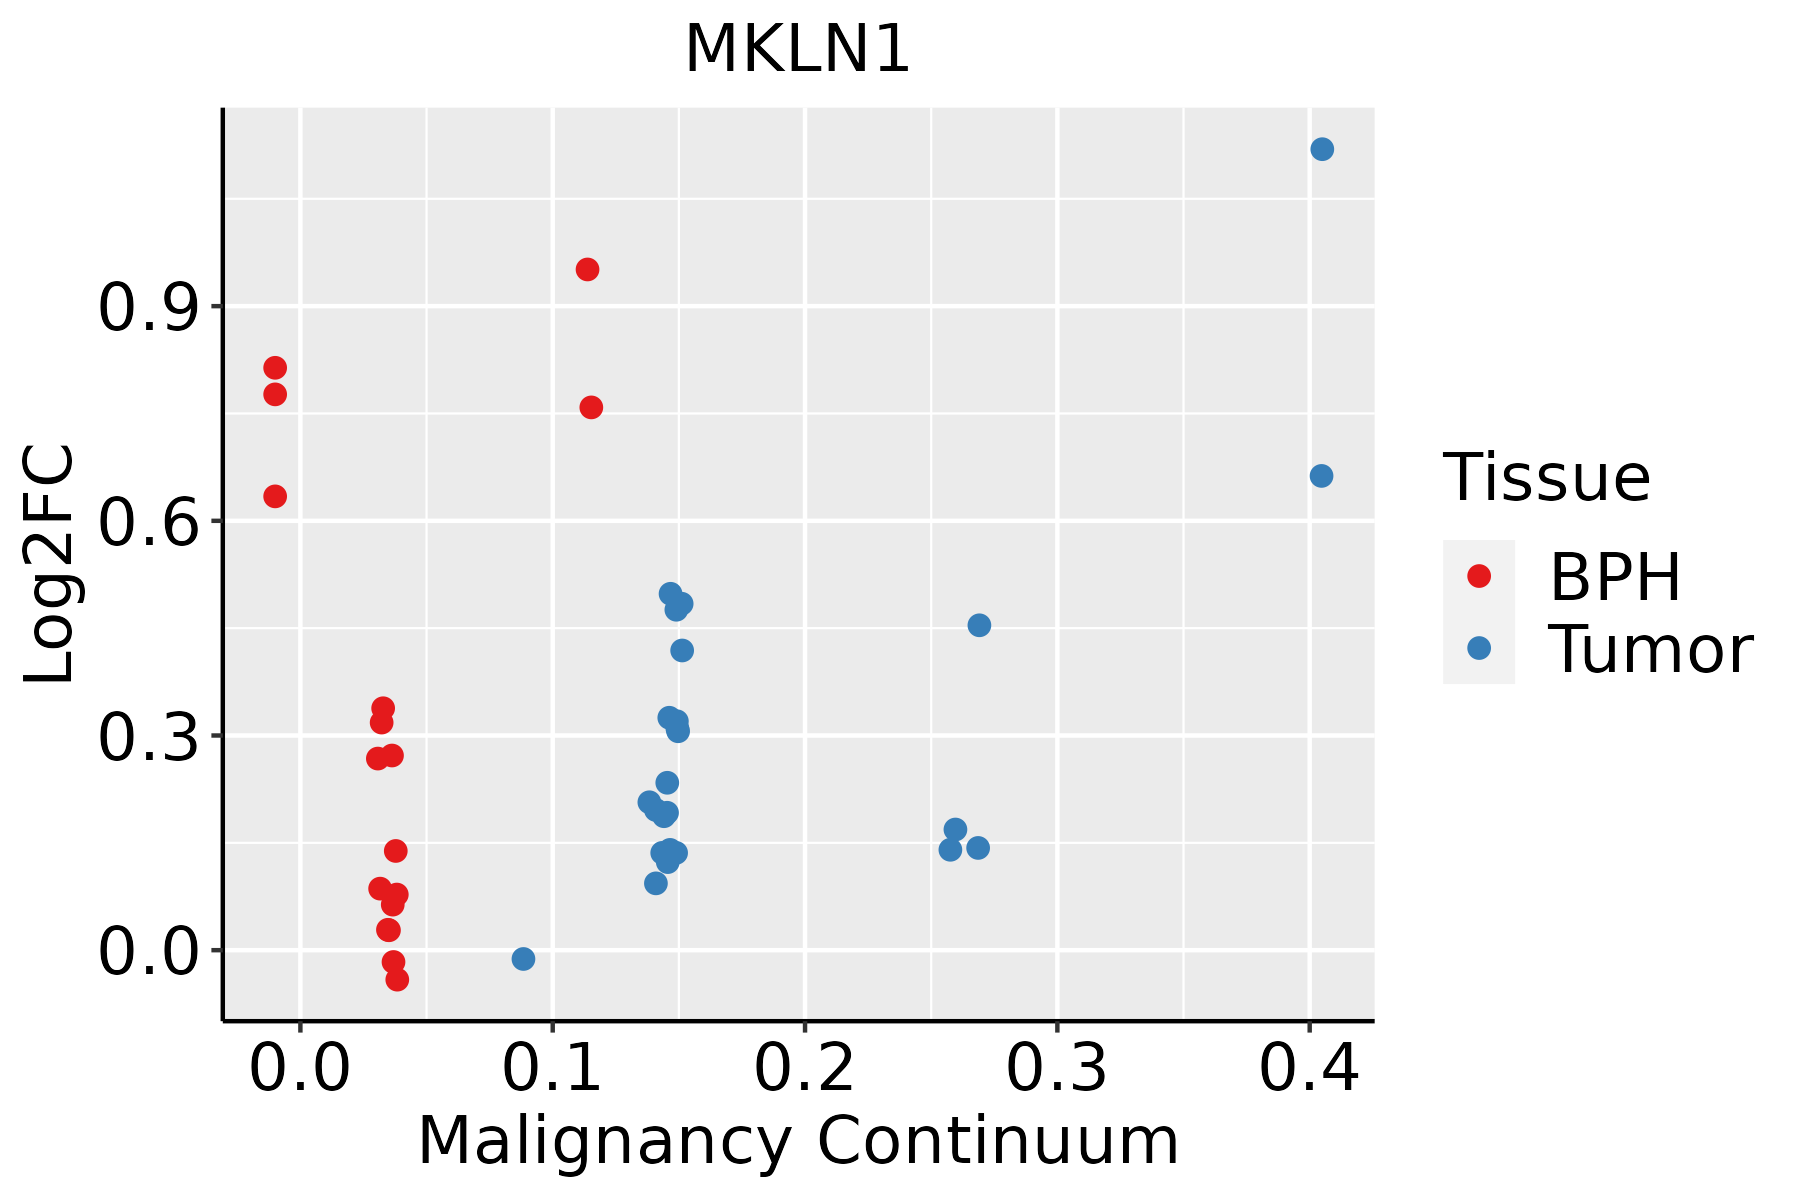 | BPH: Benign Prostatic Hyperplasia |
| Skin | 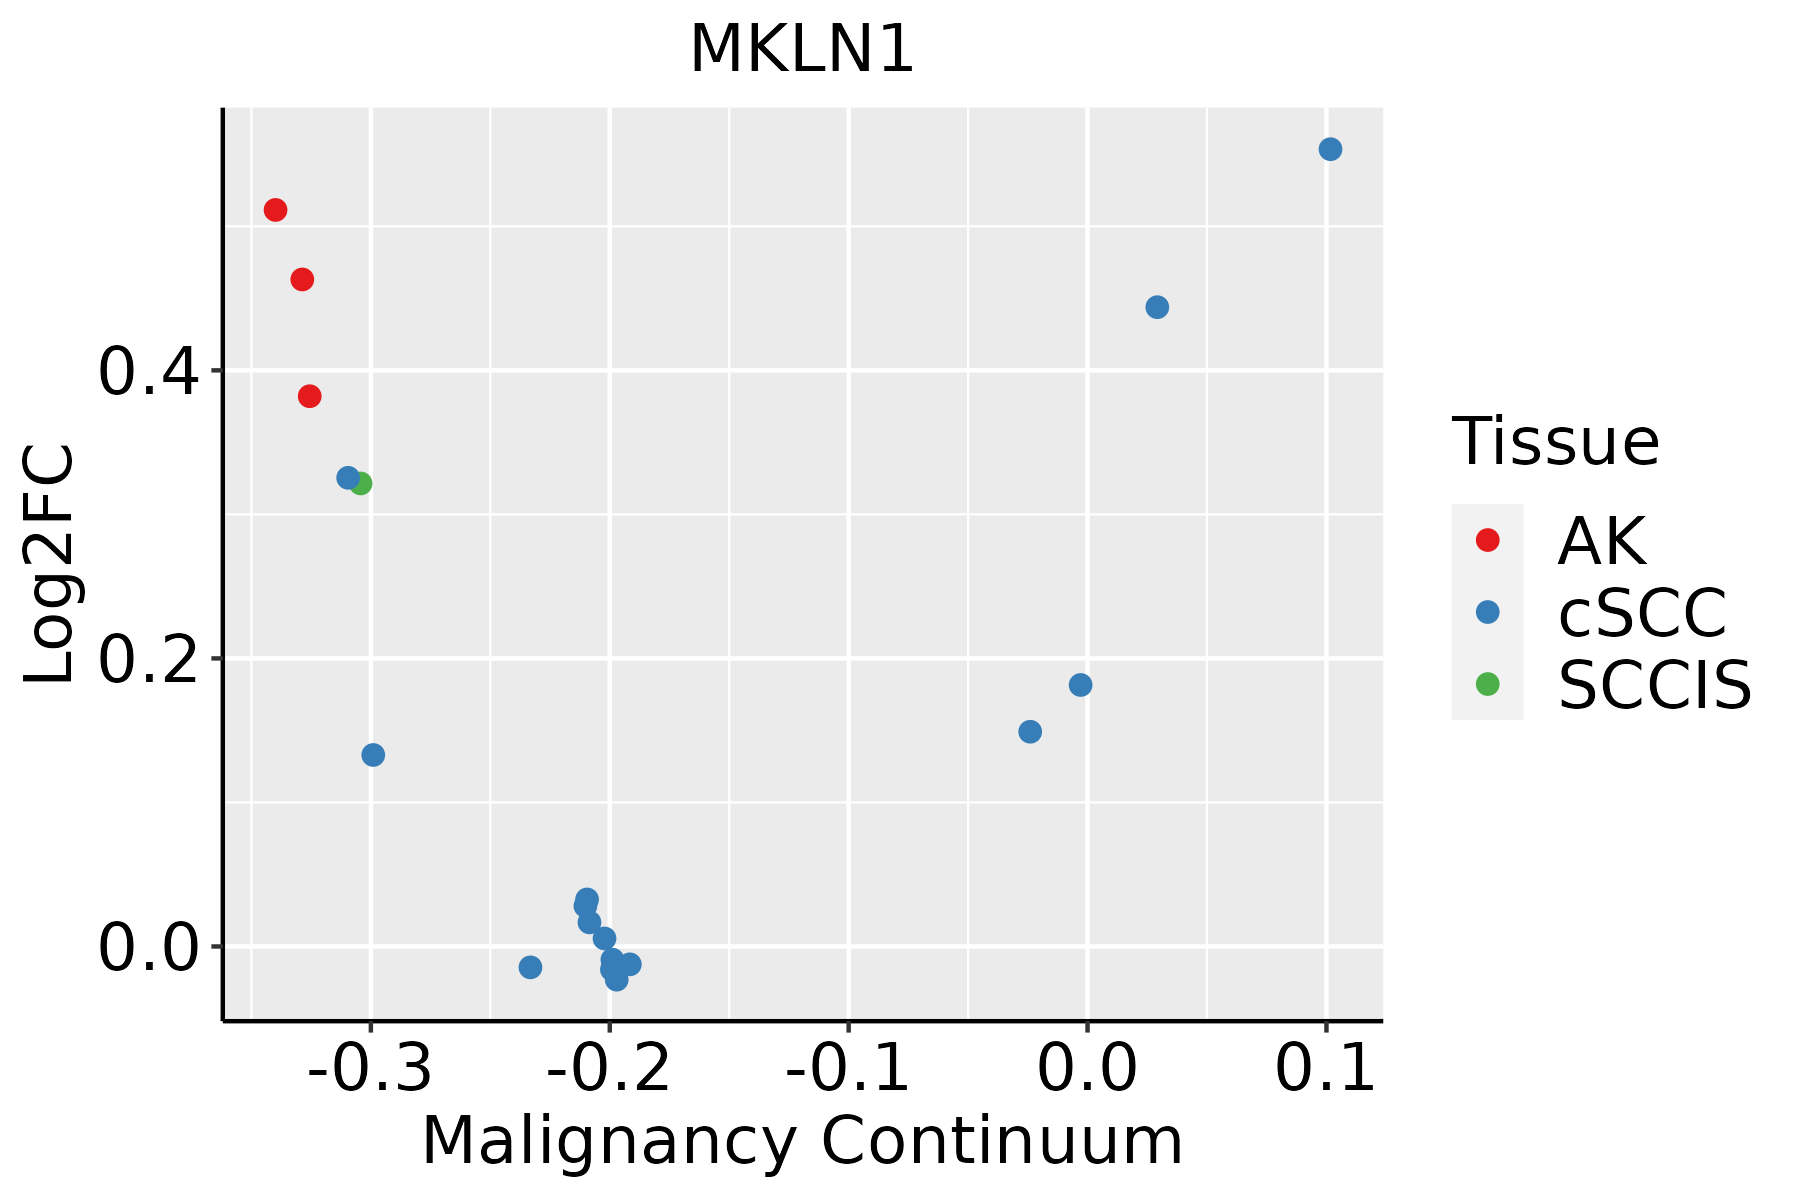 | AK: Actinic keratosis |
| cSCC: Cutaneous squamous cell carcinoma | ||
| SCCIS:squamous cell carcinoma in situ | ||
| Thyroid | 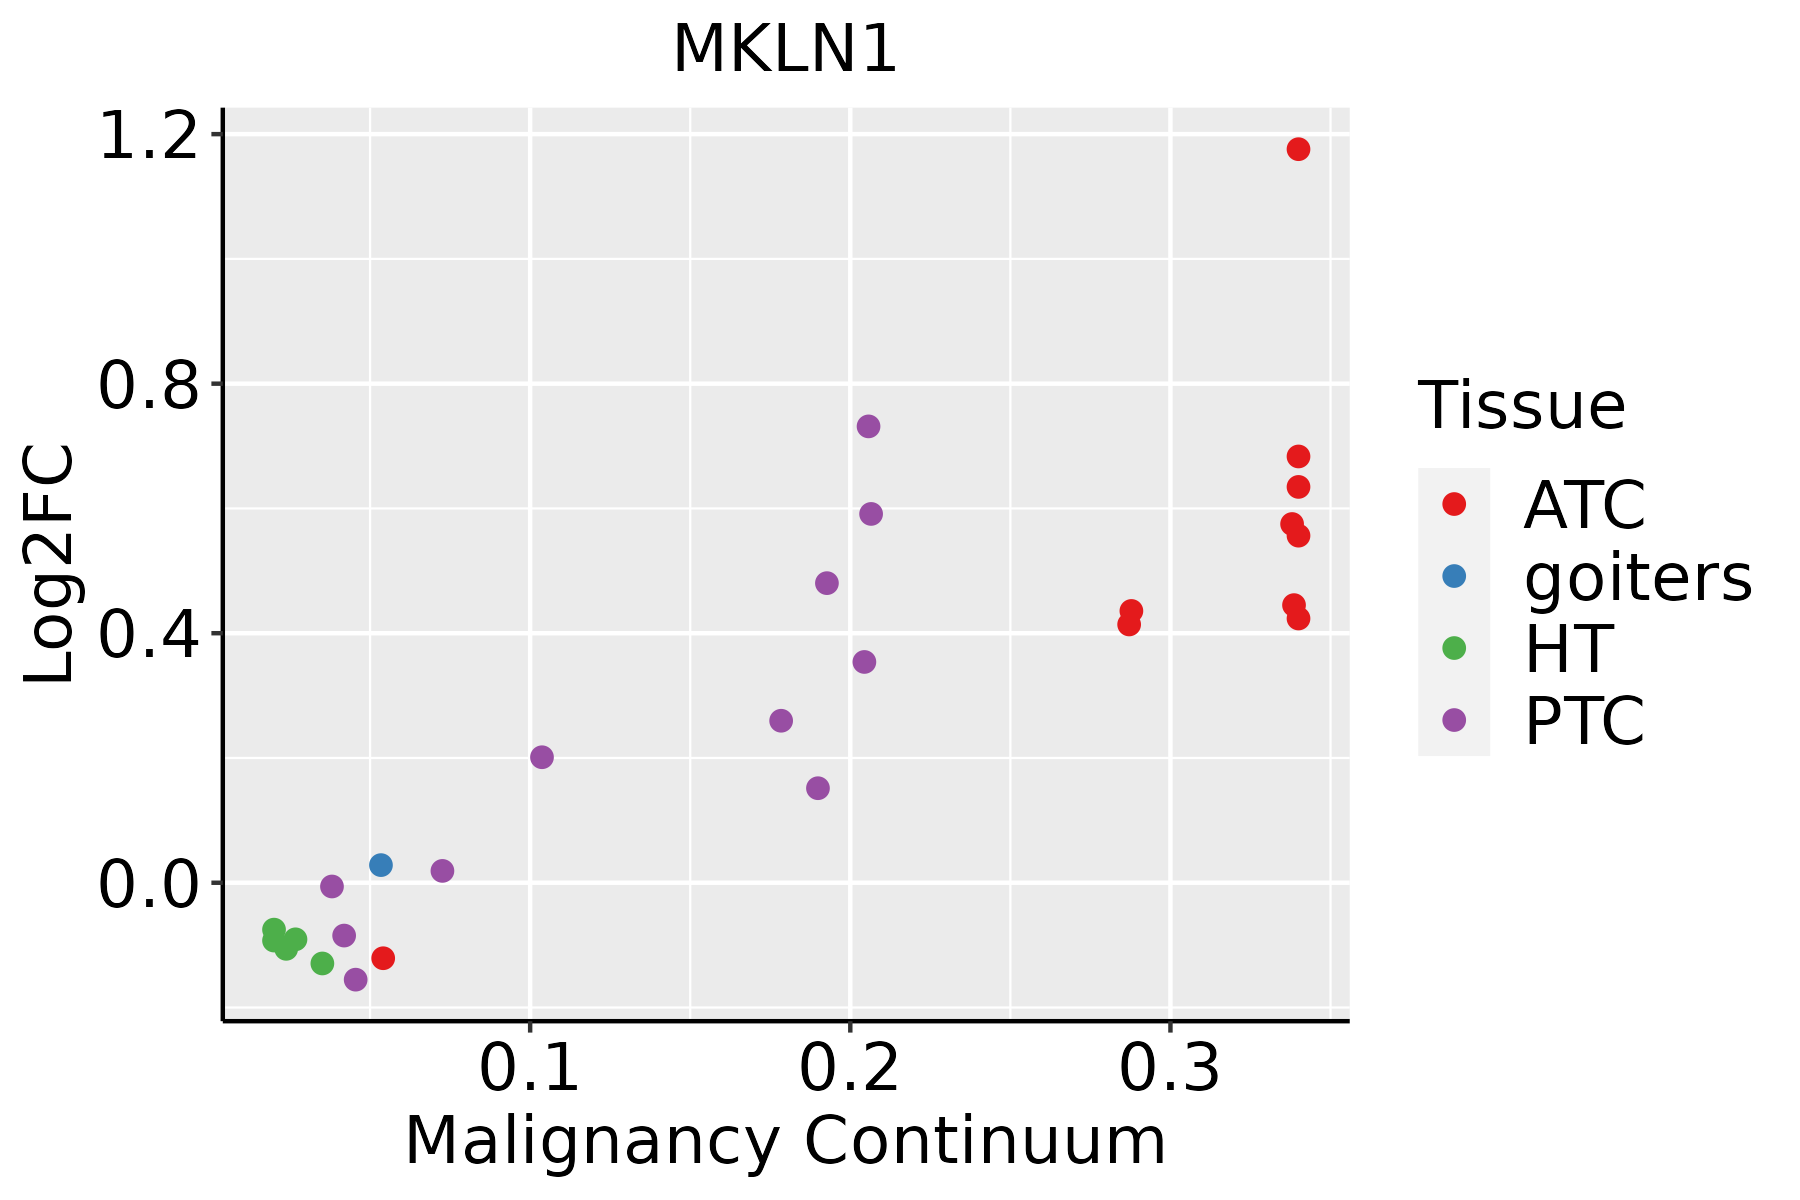 | ATC: Anaplastic thyroid cancer |
| HT: Hashimoto's thyroiditis | ||
| PTC: Papillary thyroid cancer |
| ∗log2FC in expression of this searched gene in stem-like cells from each diseased tissue sample relative to stem-like cells in normal samples in each tissue plotted against the malignancy continuum. Samples are colored based on if they are from different disease stage. |
Top |
Malignant transformation related pathway analysis |
| Find out the enriched GO biological processes and KEGG pathways involved in transition from healthy to precancer to cancer |
| Tissue | Disease Stage | Enriched GO biological Processes |
| Colorectum | AD |  |
| Colorectum | SER |  |
| Colorectum | MSS |  |
| Colorectum | MSI-H |  |
| Colorectum | FAP |  |
| ∗Top 15 enriched GO BP terms are showed in the bar plot of each disease state in each tissue. Each row represents a significant GO biological process which is colored according to the -log10(p.adjust). |
| Page: 1 2 3 4 5 6 7 8 9 |
| GO ID | Tissue | Disease Stage | Description | Gene Ratio | Bg Ratio | pvalue | p.adjust | Count |
| GO:00315898 | Cervix | CC | cell-substrate adhesion | 96/2311 | 363/18723 | 1.48e-13 | 8.85e-11 | 96 |
| GO:002260410 | Cervix | CC | regulation of cell morphogenesis | 84/2311 | 309/18723 | 1.00e-12 | 4.29e-10 | 84 |
| GO:00071608 | Cervix | CC | cell-matrix adhesion | 60/2311 | 233/18723 | 1.58e-08 | 1.23e-06 | 60 |
| GO:00315328 | Cervix | CC | actin cytoskeleton reorganization | 31/2311 | 107/18723 | 3.34e-06 | 8.99e-05 | 31 |
| GO:00083608 | Cervix | CC | regulation of cell shape | 38/2311 | 154/18723 | 1.86e-05 | 3.46e-04 | 38 |
| GO:00068987 | Cervix | CC | receptor-mediated endocytosis | 53/2311 | 244/18723 | 2.52e-05 | 4.29e-04 | 53 |
| GO:00301008 | Cervix | CC | regulation of endocytosis | 47/2311 | 211/18723 | 3.65e-05 | 5.82e-04 | 47 |
| GO:00431127 | Cervix | CC | receptor metabolic process | 37/2311 | 166/18723 | 2.31e-04 | 2.58e-03 | 37 |
| GO:00482597 | Cervix | CC | regulation of receptor-mediated endocytosis | 24/2311 | 110/18723 | 3.62e-03 | 2.31e-02 | 24 |
| GO:00316236 | Cervix | CC | receptor internalization | 24/2311 | 113/18723 | 5.18e-03 | 3.05e-02 | 24 |
| GO:0022604 | Colorectum | AD | regulation of cell morphogenesis | 109/3918 | 309/18723 | 3.08e-09 | 2.07e-07 | 109 |
| GO:0031589 | Colorectum | AD | cell-substrate adhesion | 116/3918 | 363/18723 | 4.68e-07 | 1.76e-05 | 116 |
| GO:0043112 | Colorectum | AD | receptor metabolic process | 62/3918 | 166/18723 | 8.18e-07 | 2.85e-05 | 62 |
| GO:0008360 | Colorectum | AD | regulation of cell shape | 56/3918 | 154/18723 | 7.01e-06 | 1.73e-04 | 56 |
| GO:0031532 | Colorectum | AD | actin cytoskeleton reorganization | 41/3918 | 107/18723 | 2.81e-05 | 5.28e-04 | 41 |
| GO:0007160 | Colorectum | AD | cell-matrix adhesion | 75/3918 | 233/18723 | 3.56e-05 | 6.45e-04 | 75 |
| GO:0006898 | Colorectum | AD | receptor-mediated endocytosis | 76/3918 | 244/18723 | 1.07e-04 | 1.59e-03 | 76 |
| GO:0030100 | Colorectum | AD | regulation of endocytosis | 67/3918 | 211/18723 | 1.42e-04 | 2.01e-03 | 67 |
| GO:0048259 | Colorectum | AD | regulation of receptor-mediated endocytosis | 35/3918 | 110/18723 | 4.85e-03 | 3.27e-02 | 35 |
| GO:0031623 | Colorectum | AD | receptor internalization | 35/3918 | 113/18723 | 7.72e-03 | 4.66e-02 | 35 |
| Page: 1 2 3 4 5 6 7 8 9 10 11 12 13 |
| Pathway ID | Tissue | Disease Stage | Description | Gene Ratio | Bg Ratio | pvalue | p.adjust | qvalue | Count |
| Page: 1 |
Top |
Cell-cell communication analysis |
| Identification of potential cell-cell interactions between two cell types and their ligand-receptor pairs for different disease states |
| Ligand | Receptor | LRpair | Pathway | Tissue | Disease Stage |
| Page: 1 |
Top |
Single-cell gene regulatory network inference analysis |
| Find out the significant the regulons (TFs) and the target genes of each regulon across cell types for different disease states |
| TF | Cell Type | Tissue | Disease Stage | Target Gene | RSS | Regulon Activity |
| ∗The dot plots of a searched regulon are shown for all cell subpopulations in each disease state of each tissue based on the regulon specific score inferred using pySCENIC and by calculating the average expression. |
| Page: 1 |
Top |
Somatic mutation of malignant transformation related genes |
| Annotation of somatic variants for genes involved in malignant transformation |
| Hugo Symbol | Variant Class | Variant Classification | dbSNP RS | HGVSc | HGVSp | HGVSp Short | SWISSPROT | BIOTYPE | SIFT | PolyPhen | Tumor Sample Barcode | Tissue | Histology | Sex | Age | Stage | Therapy Types | Drugs | Outcome |
| MKLN1 | SNV | Missense_Mutation | novel | c.2102N>G | p.Asp701Gly | p.D701G | Q9UL63 | protein_coding | tolerated(0.36) | benign(0.078) | TCGA-AC-A3EH-01 | Breast | breast invasive carcinoma | Female | >=65 | III/IV | Unknown | Unknown | SD |
| MKLN1 | SNV | Missense_Mutation | novel | c.533G>A | p.Arg178His | p.R178H | Q9UL63 | protein_coding | deleterious(0) | possibly_damaging(0.833) | TCGA-AN-A046-01 | Breast | breast invasive carcinoma | Female | >=65 | I/II | Unknown | Unknown | SD |
| MKLN1 | insertion | Nonsense_Mutation | novel | c.1319_1320insCCTAAAGATTTTCAGCATAGTTCCCAGATATTTGGAGTGATTGAG | p.Leu441_Arg442insLysIlePheSerIleValProArgTyrLeuGluTerLeuSerLeu | p.L441_R442insKIFSIVPRYLE*LSL | Q9UL63 | protein_coding | TCGA-AN-A03X-01 | Breast | breast invasive carcinoma | Female | >=65 | I/II | Unknown | Unknown | SD | ||
| MKLN1 | deletion | Frame_Shift_Del | novel | c.862delN | p.Phe288LeufsTer18 | p.F288Lfs*18 | Q9UL63 | protein_coding | TCGA-EW-A2FV-01 | Breast | breast invasive carcinoma | Female | <65 | III/IV | Chemotherapy | docetaxel | SD | ||
| MKLN1 | SNV | Missense_Mutation | c.1740N>C | p.Glu580Asp | p.E580D | Q9UL63 | protein_coding | deleterious(0) | possibly_damaging(0.835) | TCGA-AA-3510-01 | Colorectum | colon adenocarcinoma | Male | >=65 | I/II | Unknown | Unknown | SD | |
| MKLN1 | SNV | Missense_Mutation | c.739N>C | p.Tyr247His | p.Y247H | Q9UL63 | protein_coding | deleterious(0) | probably_damaging(0.969) | TCGA-AA-3864-01 | Colorectum | colon adenocarcinoma | Male | >=65 | I/II | Unknown | Unknown | SD | |
| MKLN1 | SNV | Missense_Mutation | c.425G>A | p.Ser142Asn | p.S142N | Q9UL63 | protein_coding | tolerated(0.24) | benign(0.081) | TCGA-AA-3977-01 | Colorectum | colon adenocarcinoma | Male | >=65 | I/II | Unknown | Unknown | SD | |
| MKLN1 | SNV | Missense_Mutation | c.1893N>T | p.Leu631Phe | p.L631F | Q9UL63 | protein_coding | deleterious(0.01) | benign(0.036) | TCGA-AA-A02F-01 | Colorectum | colon adenocarcinoma | Female | >=65 | III/IV | Chemotherapy | folinic | PR | |
| MKLN1 | SNV | Missense_Mutation | novel | c.676N>A | p.Glu226Lys | p.E226K | Q9UL63 | protein_coding | deleterious(0) | possibly_damaging(0.88) | TCGA-AZ-4315-01 | Colorectum | colon adenocarcinoma | Male | <65 | I/II | Unknown | Unknown | SD |
| MKLN1 | SNV | Missense_Mutation | novel | c.948C>G | p.Asp316Glu | p.D316E | Q9UL63 | protein_coding | deleterious(0.05) | possibly_damaging(0.803) | TCGA-CA-6717-01 | Colorectum | colon adenocarcinoma | Male | <65 | I/II | Chemotherapy | oxaliplatin | CR |
| Page: 1 2 3 4 5 6 7 8 |
Top |
Related drugs of malignant transformation related genes |
| Identification of chemicals and drugs interact with genes involved in malignant transfromation |
| (DGIdb 4.0) |
| Entrez ID | Symbol | Category | Interaction Types | Drug Claim Name | Drug Name | PMIDs |
| Page: 1 |

Copyright 2023-Present -The University of Texas Health Science Center at Houston |