
|
|||||
|
 | |
| |
| |
| |
| |
| |
|
Gene: MKL1 |
Gene summary for MKL1 |
| Gene information | Species | Human | Gene symbol | MKL1 | Gene ID | 57591 |
| Gene name | myocardin related transcription factor A | |
| Gene Alias | BSAC | |
| Cytomap | 22q13.1-q13.2 | |
| Gene Type | protein-coding | GO ID | GO:0002009 | UniProtAcc | A4FUJ8 |
Top |
Malignant transformation analysis |
| Identification of the aberrant gene expression in precancerous and cancerous lesions by comparing the gene expression of stem-like cells in diseased tissues with normal stem cells |
| Entrez ID | Symbol | Replicates | Species | Organ | Tissue | Adj P-value | Log2FC | Malignancy |
| 57591 | MKL1 | HTA11_3410_2000001011 | Human | Colorectum | AD | 5.26e-35 | -7.87e-01 | 0.0155 |
| 57591 | MKL1 | HTA11_2487_2000001011 | Human | Colorectum | SER | 2.63e-21 | -7.87e-01 | -0.1808 |
| 57591 | MKL1 | HTA11_2951_2000001011 | Human | Colorectum | AD | 3.56e-05 | -7.87e-01 | 0.0216 |
| 57591 | MKL1 | HTA11_1938_2000001011 | Human | Colorectum | AD | 1.96e-16 | -7.87e-01 | -0.0811 |
| 57591 | MKL1 | HTA11_78_2000001011 | Human | Colorectum | AD | 7.21e-25 | -7.87e-01 | -0.1088 |
| 57591 | MKL1 | HTA11_347_2000001011 | Human | Colorectum | AD | 1.87e-37 | -7.87e-01 | -0.1954 |
| 57591 | MKL1 | HTA11_411_2000001011 | Human | Colorectum | SER | 4.78e-03 | -7.87e-01 | -0.2602 |
| 57591 | MKL1 | HTA11_2112_2000001011 | Human | Colorectum | SER | 2.06e-04 | -7.87e-01 | -0.2196 |
| 57591 | MKL1 | HTA11_3361_2000001011 | Human | Colorectum | AD | 4.94e-17 | -7.87e-01 | -0.1207 |
| 57591 | MKL1 | HTA11_83_2000001011 | Human | Colorectum | SER | 8.24e-14 | -7.87e-01 | -0.1526 |
| 57591 | MKL1 | HTA11_696_2000001011 | Human | Colorectum | AD | 1.49e-43 | -7.87e-01 | -0.1464 |
| 57591 | MKL1 | HTA11_866_2000001011 | Human | Colorectum | AD | 8.59e-39 | -7.87e-01 | -0.1001 |
| 57591 | MKL1 | HTA11_1391_2000001011 | Human | Colorectum | AD | 1.13e-28 | -7.87e-01 | -0.059 |
| 57591 | MKL1 | HTA11_2992_2000001011 | Human | Colorectum | SER | 1.15e-06 | -7.87e-01 | -0.1706 |
| 57591 | MKL1 | HTA11_5212_2000001011 | Human | Colorectum | AD | 9.45e-08 | -7.87e-01 | -0.2061 |
| 57591 | MKL1 | HTA11_5216_2000001011 | Human | Colorectum | SER | 3.56e-05 | -7.87e-01 | -0.1462 |
| 57591 | MKL1 | HTA11_546_2000001011 | Human | Colorectum | AD | 4.90e-12 | -7.87e-01 | -0.0842 |
| 57591 | MKL1 | HTA11_9341_2000001011 | Human | Colorectum | SER | 4.78e-03 | -7.87e-01 | -0.00410000000000005 |
| 57591 | MKL1 | HTA11_7862_2000001011 | Human | Colorectum | AD | 7.45e-10 | -7.87e-01 | -0.0179 |
| 57591 | MKL1 | HTA11_866_3004761011 | Human | Colorectum | AD | 4.25e-31 | -7.87e-01 | 0.096 |
| Page: 1 2 3 4 5 6 |
| Tissue | Expression Dynamics | Abbreviation |
| Colorectum (GSE201348) |  | FAP: Familial adenomatous polyposis |
| CRC: Colorectal cancer | ||
| Colorectum (HTA11) |  | AD: Adenomas |
| SER: Sessile serrated lesions | ||
| MSI-H: Microsatellite-high colorectal cancer | ||
| MSS: Microsatellite stable colorectal cancer | ||
| Endometrium | 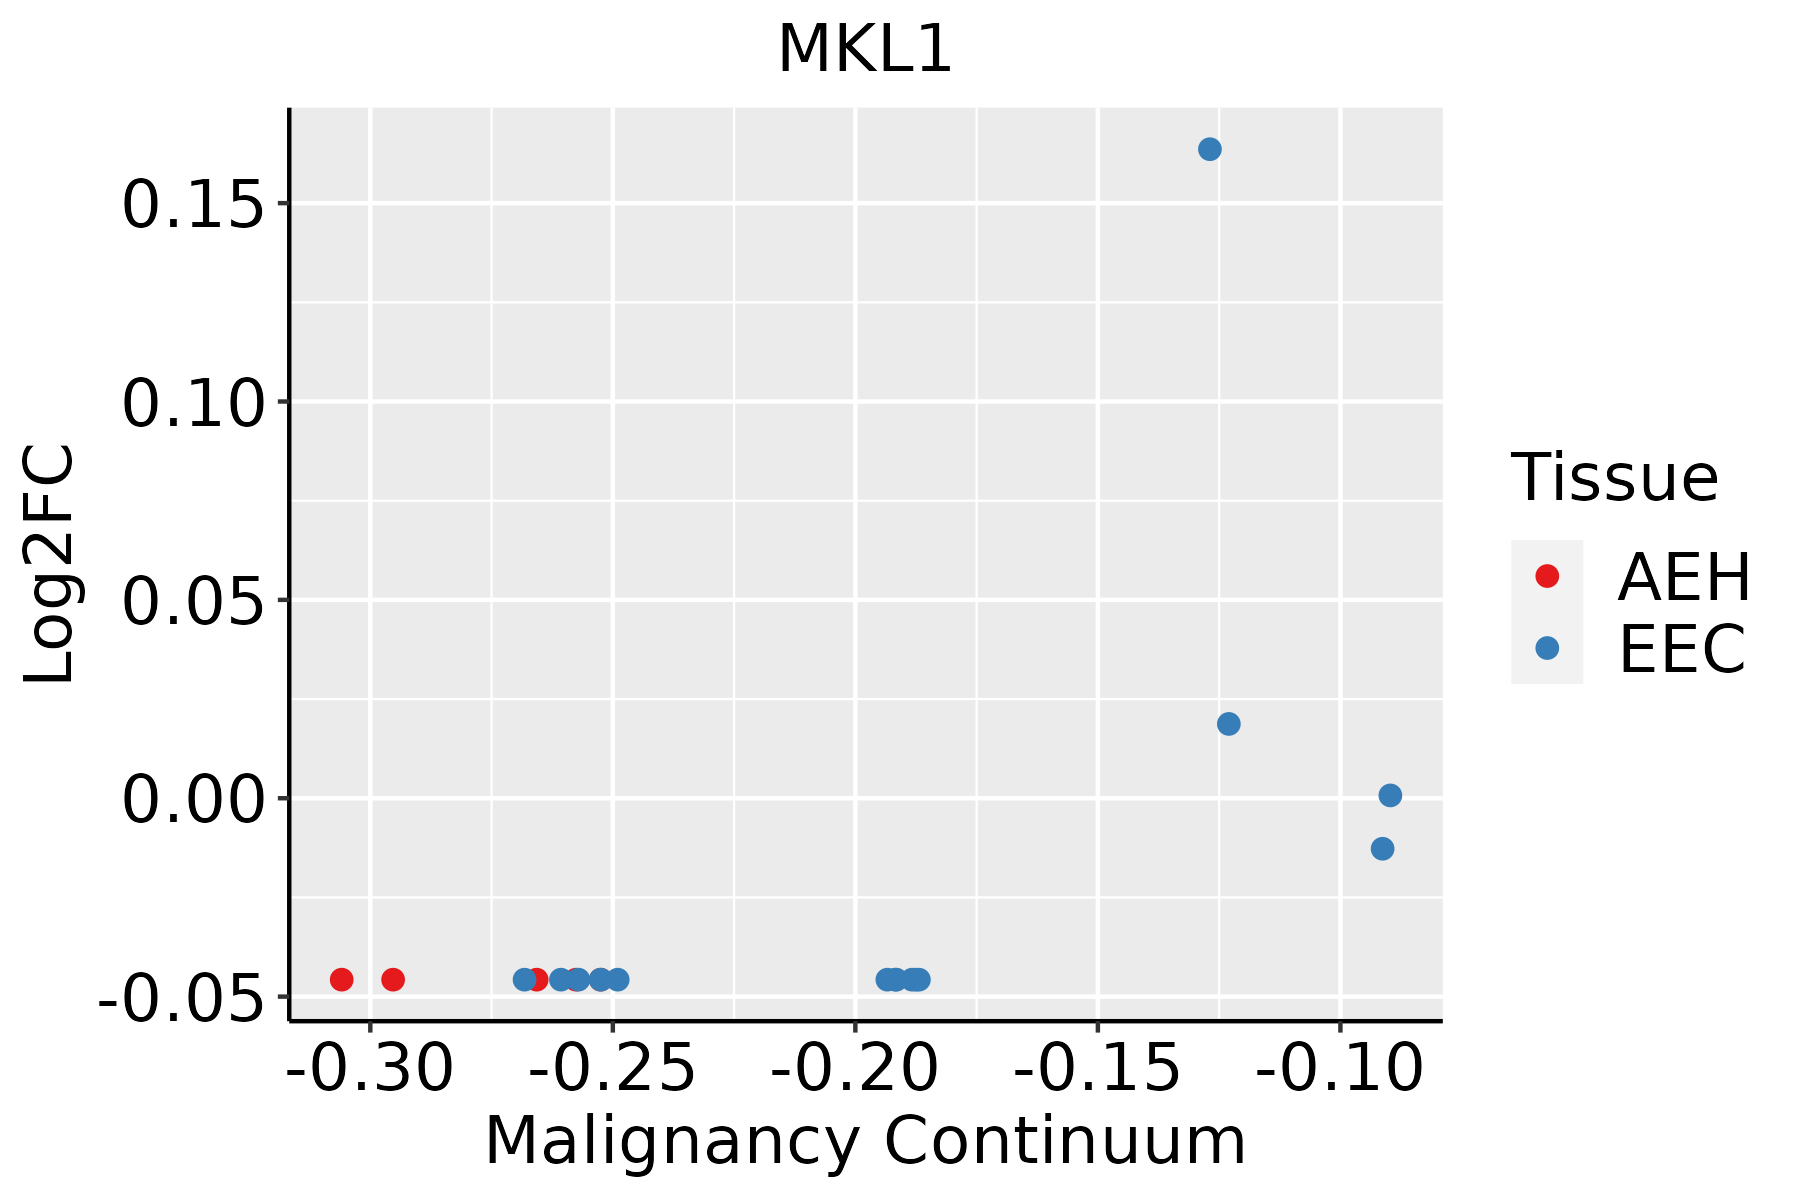 | AEH: Atypical endometrial hyperplasia |
| EEC: Endometrioid Cancer | ||
| Esophagus |  | ESCC: Esophageal squamous cell carcinoma |
| HGIN: High-grade intraepithelial neoplasias | ||
| LGIN: Low-grade intraepithelial neoplasias |
| ∗log2FC in expression of this searched gene in stem-like cells from each diseased tissue sample relative to stem-like cells in normal samples in each tissue plotted against the malignancy continuum. Samples are colored based on if they are from different disease stage. |
Top |
Malignant transformation related pathway analysis |
| Find out the enriched GO biological processes and KEGG pathways involved in transition from healthy to precancer to cancer |
| Tissue | Disease Stage | Enriched GO biological Processes |
| Colorectum | AD |  |
| Colorectum | SER |  |
| Colorectum | MSS |  |
| Colorectum | MSI-H |  |
| Colorectum | FAP |  |
| ∗Top 15 enriched GO BP terms are showed in the bar plot of each disease state in each tissue. Each row represents a significant GO biological process which is colored according to the -log10(p.adjust). |
| Page: 1 2 3 4 5 6 7 8 9 |
| GO ID | Tissue | Disease Stage | Description | Gene Ratio | Bg Ratio | pvalue | p.adjust | Count |
| Page: 1 |
| Pathway ID | Tissue | Disease Stage | Description | Gene Ratio | Bg Ratio | pvalue | p.adjust | qvalue | Count |
| Page: 1 |
Top |
Cell-cell communication analysis |
| Identification of potential cell-cell interactions between two cell types and their ligand-receptor pairs for different disease states |
| Ligand | Receptor | LRpair | Pathway | Tissue | Disease Stage |
| Page: 1 |
Top |
Single-cell gene regulatory network inference analysis |
| Find out the significant the regulons (TFs) and the target genes of each regulon across cell types for different disease states |
| TF | Cell Type | Tissue | Disease Stage | Target Gene | RSS | Regulon Activity |
| ∗The dot plots of a searched regulon are shown for all cell subpopulations in each disease state of each tissue based on the regulon specific score inferred using pySCENIC and by calculating the average expression. |
| Page: 1 |
Top |
Somatic mutation of malignant transformation related genes |
| Annotation of somatic variants for genes involved in malignant transformation |
| Hugo Symbol | Variant Class | Variant Classification | dbSNP RS | HGVSc | HGVSp | HGVSp Short | SWISSPROT | BIOTYPE | SIFT | PolyPhen | Tumor Sample Barcode | Tissue | Histology | Sex | Age | Stage | Therapy Types | Drugs | Outcome |
| MKL1 | SNV | Missense_Mutation | novel | c.70N>T | p.Arg24Cys | p.R24C | protein_coding | deleterious(0) | probably_damaging(0.952) | TCGA-A8-A0A9-01 | Breast | breast invasive carcinoma | Female | >=65 | I/II | Hormone Therapy | anastrozole | SD | |
| MKL1 | SNV | Missense_Mutation | c.307G>A | p.Asp103Asn | p.D103N | protein_coding | deleterious(0) | possibly_damaging(0.901) | TCGA-C8-A26Y-01 | Breast | breast invasive carcinoma | Female | >=65 | I/II | Unknown | Unknown | SD | ||
| MKL1 | deletion | Frame_Shift_Del | novel | c.961delC | p.Gln321ArgfsTer51 | p.Q321Rfs*51 | protein_coding | TCGA-EW-A2FV-01 | Breast | breast invasive carcinoma | Female | <65 | III/IV | Chemotherapy | docetaxel | SD | |||
| MKL1 | SNV | Missense_Mutation | novel | c.1100N>G | p.Asn367Ser | p.N367S | protein_coding | tolerated(0.26) | benign(0.052) | TCGA-2W-A8YY-01 | Cervix | cervical & endocervical cancer | Female | <65 | I/II | Chemotherapy | cisplatin | CR | |
| MKL1 | SNV | Missense_Mutation | rs149542196 | c.466N>A | p.Asp156Asn | p.D156N | protein_coding | deleterious(0) | probably_damaging(0.999) | TCGA-2W-A8YY-01 | Cervix | cervical & endocervical cancer | Female | <65 | I/II | Chemotherapy | cisplatin | CR | |
| MKL1 | SNV | Missense_Mutation | novel | c.2749G>A | p.Asp917Asn | p.D917N | protein_coding | deleterious(0) | possibly_damaging(0.76) | TCGA-C5-A8XJ-01 | Cervix | cervical & endocervical cancer | Female | >=65 | I/II | Chemotherapy | cisplatin | SD | |
| MKL1 | SNV | Missense_Mutation | rs138116355 | c.481N>A | p.Glu161Lys | p.E161K | protein_coding | deleterious(0.01) | probably_damaging(0.999) | TCGA-EA-A3HS-01 | Cervix | cervical & endocervical cancer | Female | <65 | I/II | Unknown | Unknown | SD | |
| MKL1 | SNV | Missense_Mutation | c.1155N>A | p.Met385Ile | p.M385I | protein_coding | deleterious(0.02) | benign(0.155) | TCGA-EK-A2R7-01 | Cervix | cervical & endocervical cancer | Female | <65 | I/II | Unknown | Unknown | SD | ||
| MKL1 | deletion | Frame_Shift_Del | novel | c.867delN | p.Met290TrpfsTer82 | p.M290Wfs*82 | protein_coding | TCGA-EA-A3HU-01 | Cervix | cervical & endocervical cancer | Female | <65 | I/II | Unknown | Unknown | SD | |||
| MKL1 | insertion | Frame_Shift_Ins | novel | c.836_837insC | p.Asp280GlyfsTer72 | p.D280Gfs*72 | protein_coding | TCGA-VS-A9UJ-01 | Cervix | cervical & endocervical cancer | Female | <65 | I/II | Unknown | Unknown | PD |
| Page: 1 2 3 4 5 6 7 8 9 10 |
Top |
Related drugs of malignant transformation related genes |
| Identification of chemicals and drugs interact with genes involved in malignant transfromation |
| (DGIdb 4.0) |
| Entrez ID | Symbol | Category | Interaction Types | Drug Claim Name | Drug Name | PMIDs |
| Page: 1 |

Copyright 2023-Present -The University of Texas Health Science Center at Houston |