
|
|||||
|
 | |
| |
| |
| |
| |
| |
|
Gene: MKI67 |
Gene summary for MKI67 |
| Gene information | Species | Human | Gene symbol | MKI67 | Gene ID | 4288 |
| Gene name | marker of proliferation Ki-67 | |
| Gene Alias | KIA | |
| Cytomap | 10q26.2 | |
| Gene Type | protein-coding | GO ID | GO:0000278 | UniProtAcc | P46013 |
Top |
Malignant transformation analysis |
| Identification of the aberrant gene expression in precancerous and cancerous lesions by comparing the gene expression of stem-like cells in diseased tissues with normal stem cells |
| Entrez ID | Symbol | Replicates | Species | Organ | Tissue | Adj P-value | Log2FC | Malignancy |
| 4288 | MKI67 | HSIL_HPV_2 | Human | Cervix | HSIL_HPV | 2.32e-07 | 3.43e-01 | 0.0208 |
| 4288 | MKI67 | N_HPV_2 | Human | Cervix | N_HPV | 3.84e-02 | 2.11e-01 | -0.0131 |
| 4288 | MKI67 | CCI_2 | Human | Cervix | CC | 1.05e-23 | 1.81e+00 | 0.5249 |
| 4288 | MKI67 | CCI_3 | Human | Cervix | CC | 8.85e-06 | 7.65e-01 | 0.516 |
| 4288 | MKI67 | sample1 | Human | Cervix | CC | 8.78e-04 | 4.80e-01 | 0.0959 |
| 4288 | MKI67 | sample3 | Human | Cervix | CC | 1.57e-05 | 2.51e-01 | 0.1387 |
| 4288 | MKI67 | T1 | Human | Cervix | CC | 2.74e-07 | 4.53e-01 | 0.0918 |
| 4288 | MKI67 | T3 | Human | Cervix | CC | 1.09e-06 | 2.64e-01 | 0.1389 |
| 4288 | MKI67 | HTA11_1938_2000001011 | Human | Colorectum | AD | 1.64e-03 | 3.51e-01 | -0.0811 |
| 4288 | MKI67 | HTA11_696_2000001011 | Human | Colorectum | AD | 6.55e-09 | 4.82e-01 | -0.1464 |
| 4288 | MKI67 | HTA11_1391_2000001011 | Human | Colorectum | AD | 1.24e-11 | 6.15e-01 | -0.059 |
| 4288 | MKI67 | HTA11_99999970781_79442 | Human | Colorectum | MSS | 3.10e-03 | 1.70e-01 | 0.294 |
| 4288 | MKI67 | HTA11_99999971662_82457 | Human | Colorectum | MSS | 3.61e-02 | 1.63e-01 | 0.3859 |
| 4288 | MKI67 | A002-C-021 | Human | Colorectum | FAP | 3.85e-03 | 9.68e-02 | 0.1171 |
| 4288 | MKI67 | LZE2T | Human | Esophagus | ESCC | 1.80e-11 | 1.41e+00 | 0.082 |
| 4288 | MKI67 | LZE4T | Human | Esophagus | ESCC | 2.37e-02 | 2.08e-01 | 0.0811 |
| 4288 | MKI67 | LZE20T | Human | Esophagus | ESCC | 4.98e-02 | 2.87e-01 | 0.0662 |
| 4288 | MKI67 | LZE22T | Human | Esophagus | ESCC | 1.57e-02 | 4.36e-01 | 0.068 |
| 4288 | MKI67 | LZE21T | Human | Esophagus | ESCC | 1.57e-07 | 5.04e-01 | 0.0655 |
| 4288 | MKI67 | LZE6T | Human | Esophagus | ESCC | 5.26e-07 | 7.36e-01 | 0.0845 |
| Page: 1 2 3 4 5 |
| Tissue | Expression Dynamics | Abbreviation |
| Cervix | 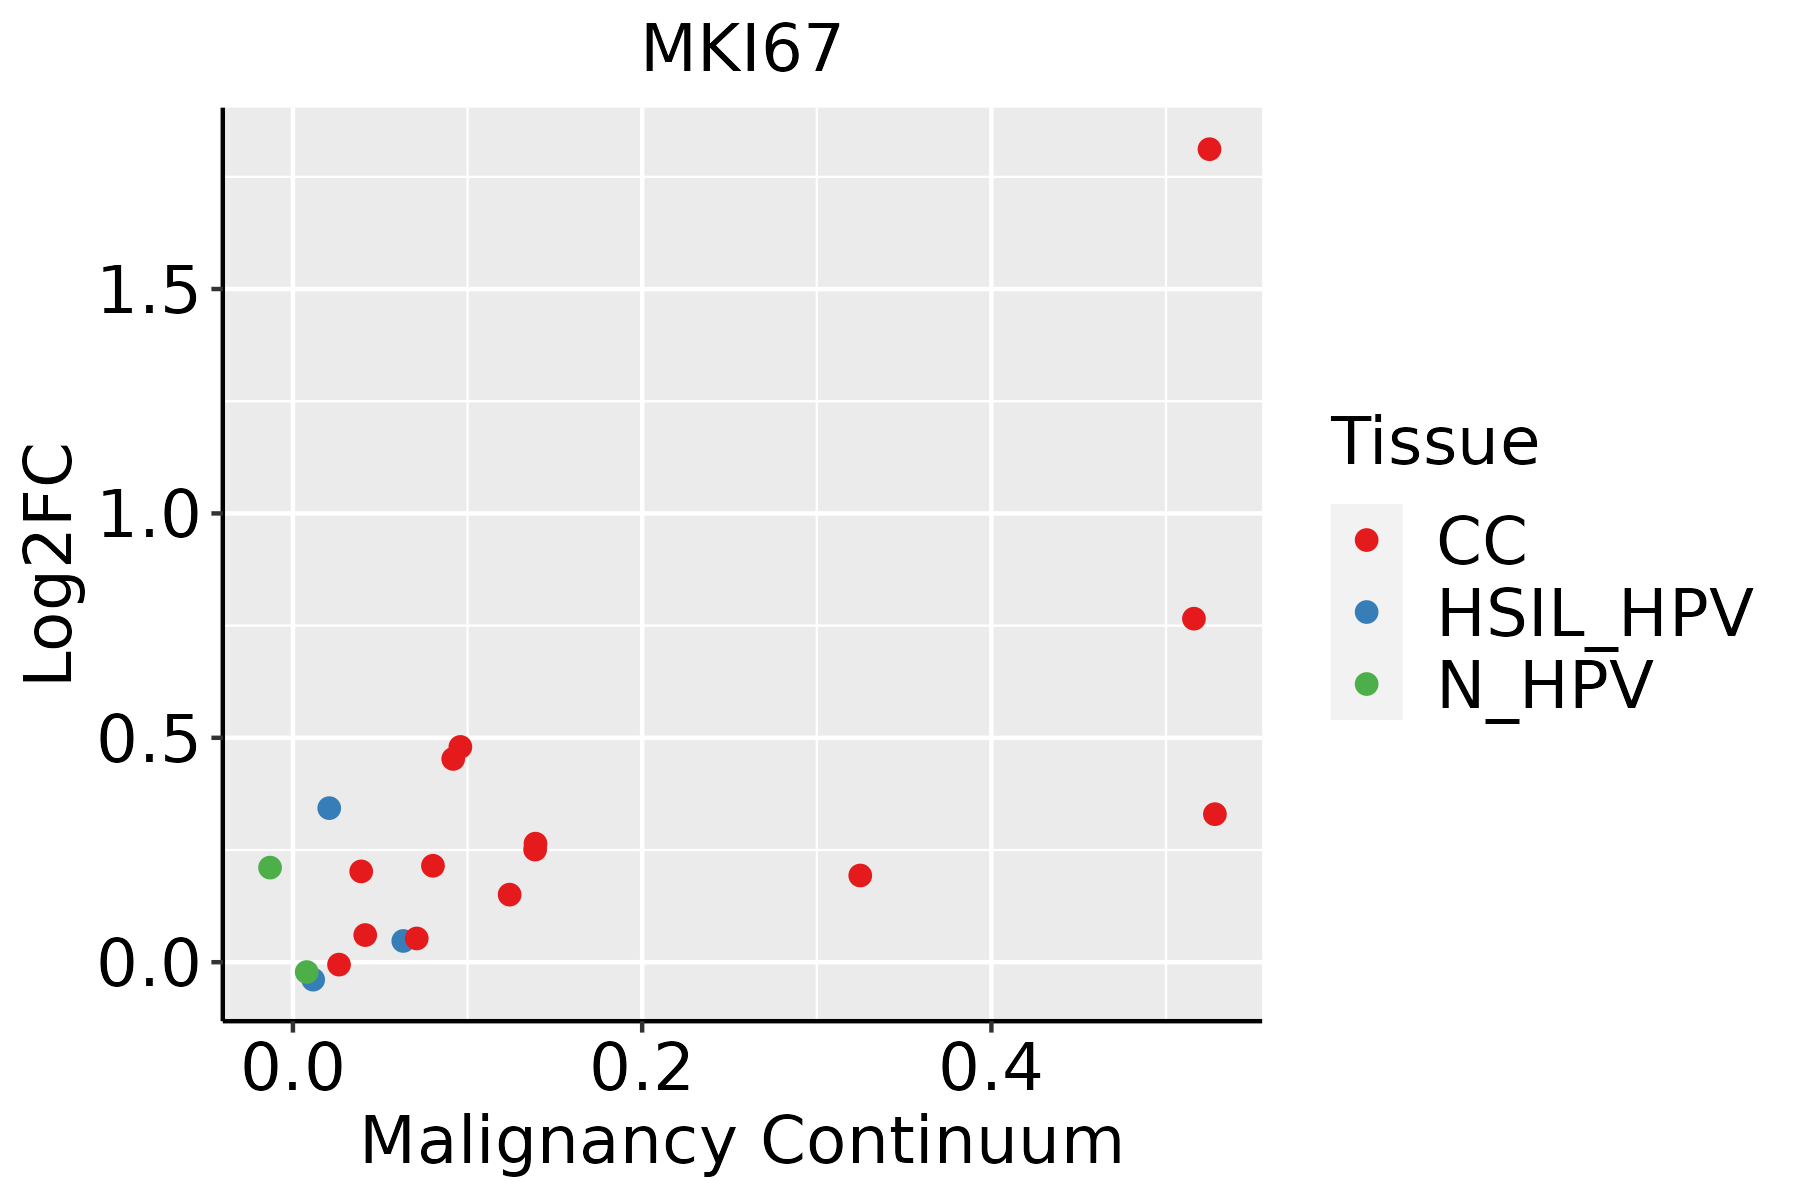 | CC: Cervix cancer |
| HSIL_HPV: HPV-infected high-grade squamous intraepithelial lesions | ||
| N_HPV: HPV-infected normal cervix | ||
| Colorectum (GSE201348) |  | FAP: Familial adenomatous polyposis |
| CRC: Colorectal cancer | ||
| Colorectum (HTA11) |  | AD: Adenomas |
| SER: Sessile serrated lesions | ||
| MSI-H: Microsatellite-high colorectal cancer | ||
| MSS: Microsatellite stable colorectal cancer | ||
| Esophagus | 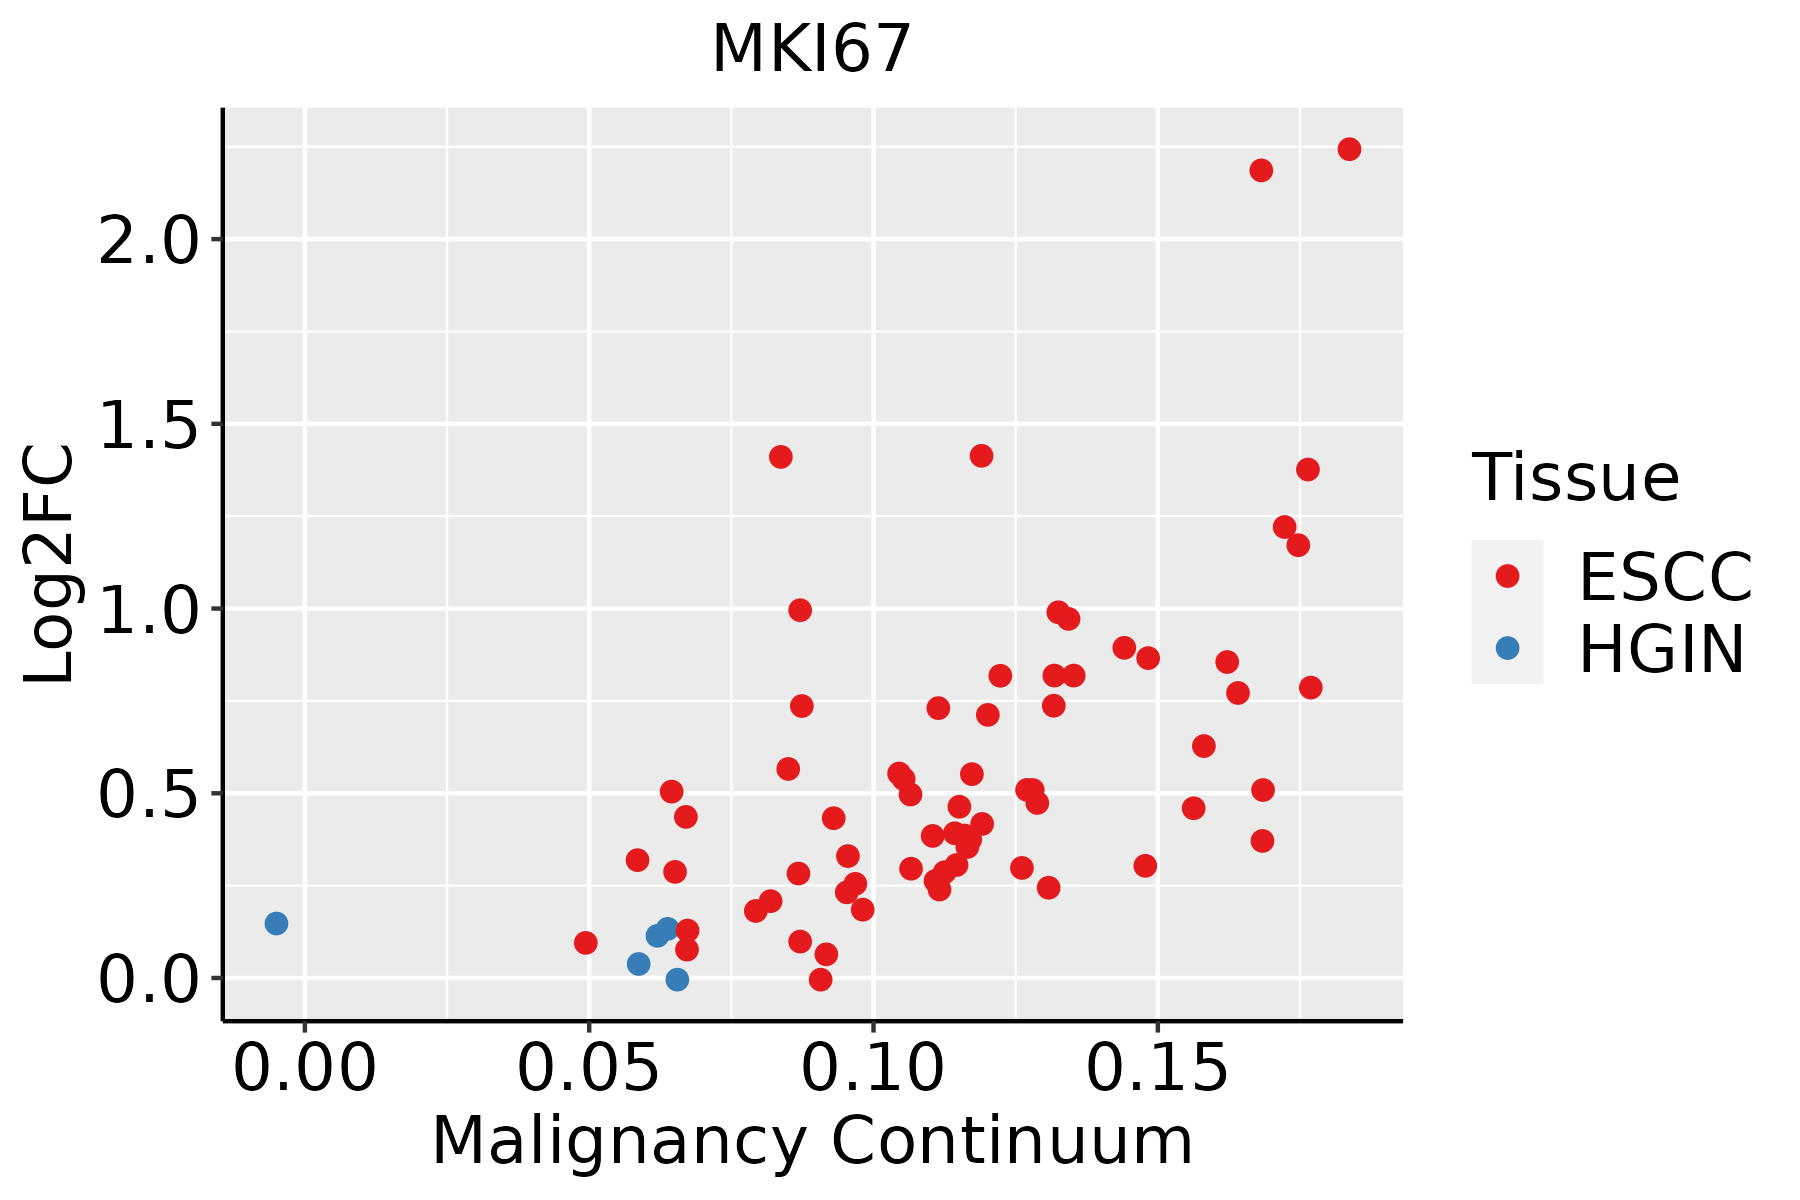 | ESCC: Esophageal squamous cell carcinoma |
| HGIN: High-grade intraepithelial neoplasias | ||
| LGIN: Low-grade intraepithelial neoplasias | ||
| Liver |  | HCC: Hepatocellular carcinoma |
| NAFLD: Non-alcoholic fatty liver disease | ||
| Oral Cavity | 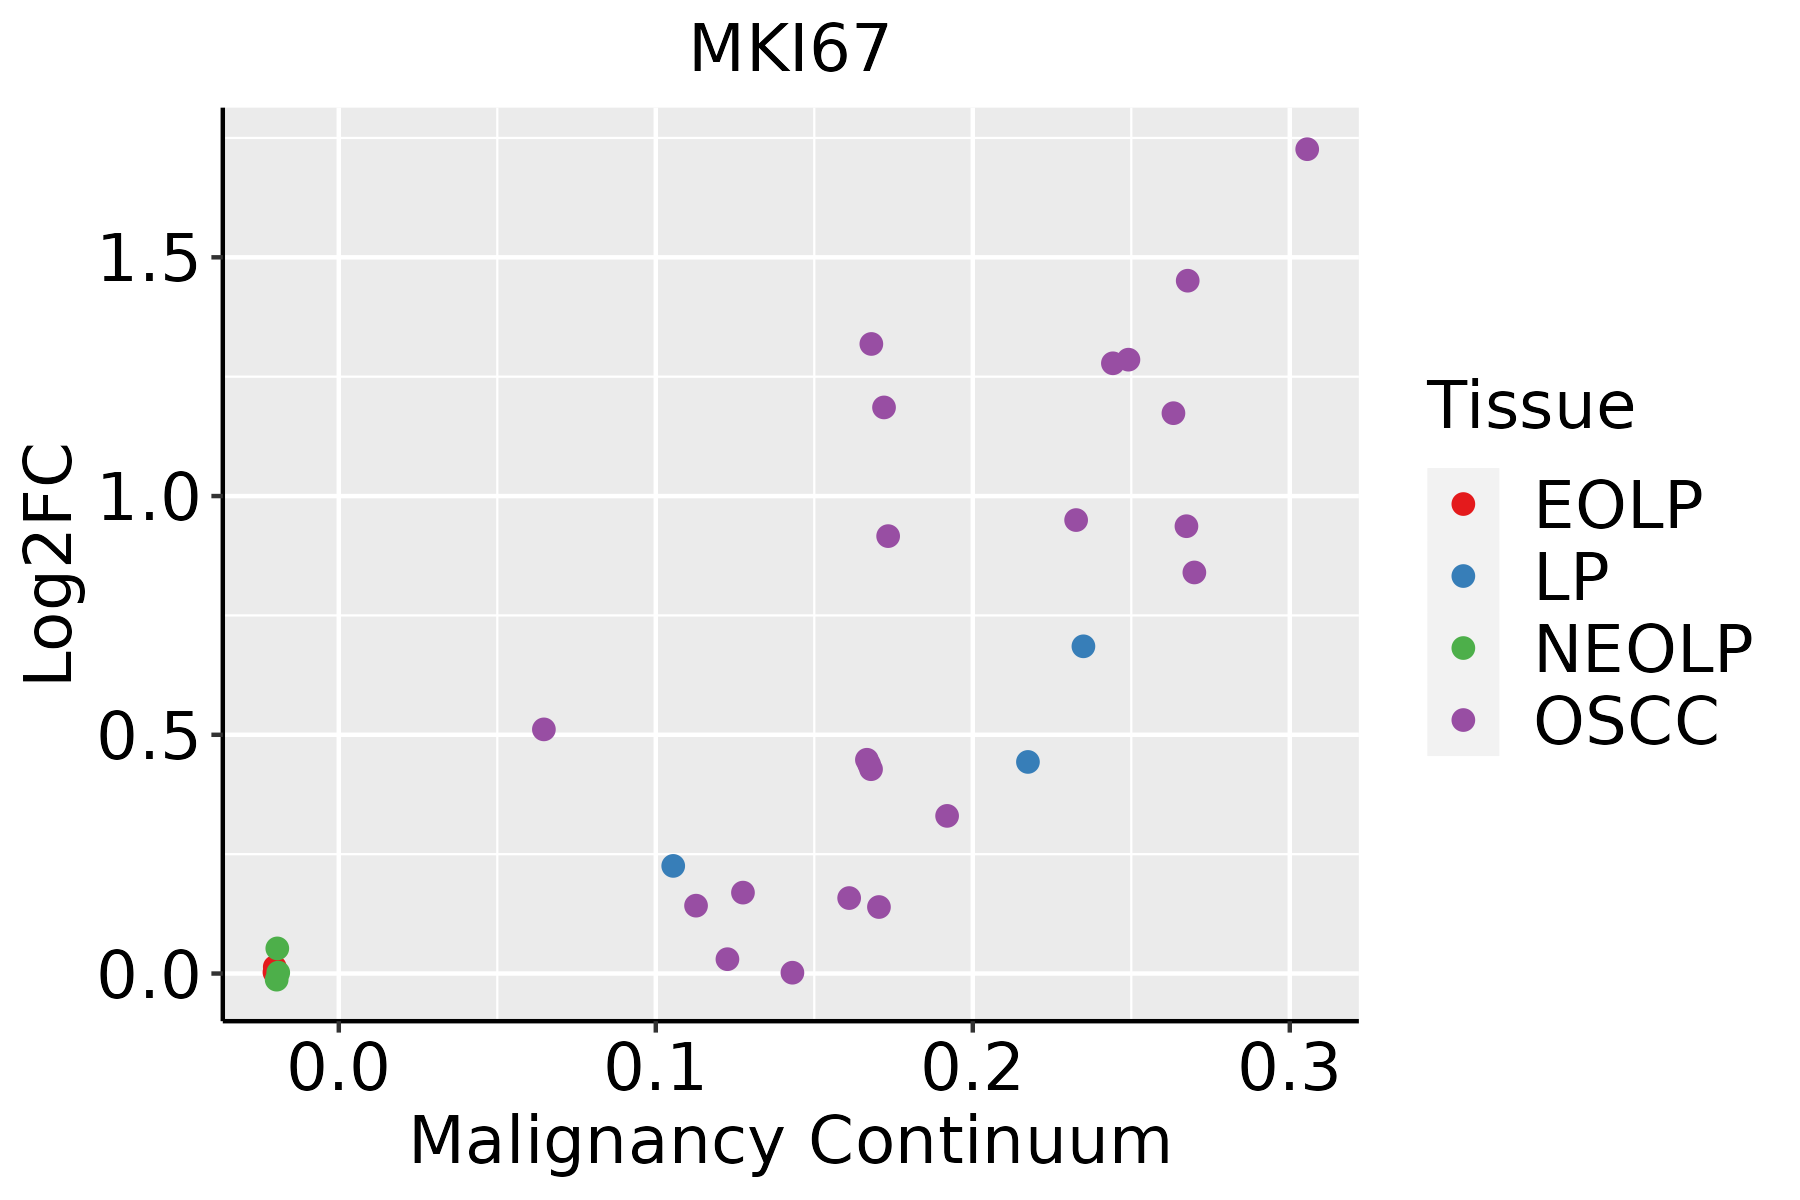 | EOLP: Erosive Oral lichen planus |
| LP: leukoplakia | ||
| NEOLP: Non-erosive oral lichen planus | ||
| OSCC: Oral squamous cell carcinoma | ||
| Skin |  | AK: Actinic keratosis |
| cSCC: Cutaneous squamous cell carcinoma | ||
| SCCIS:squamous cell carcinoma in situ | ||
| Thyroid | 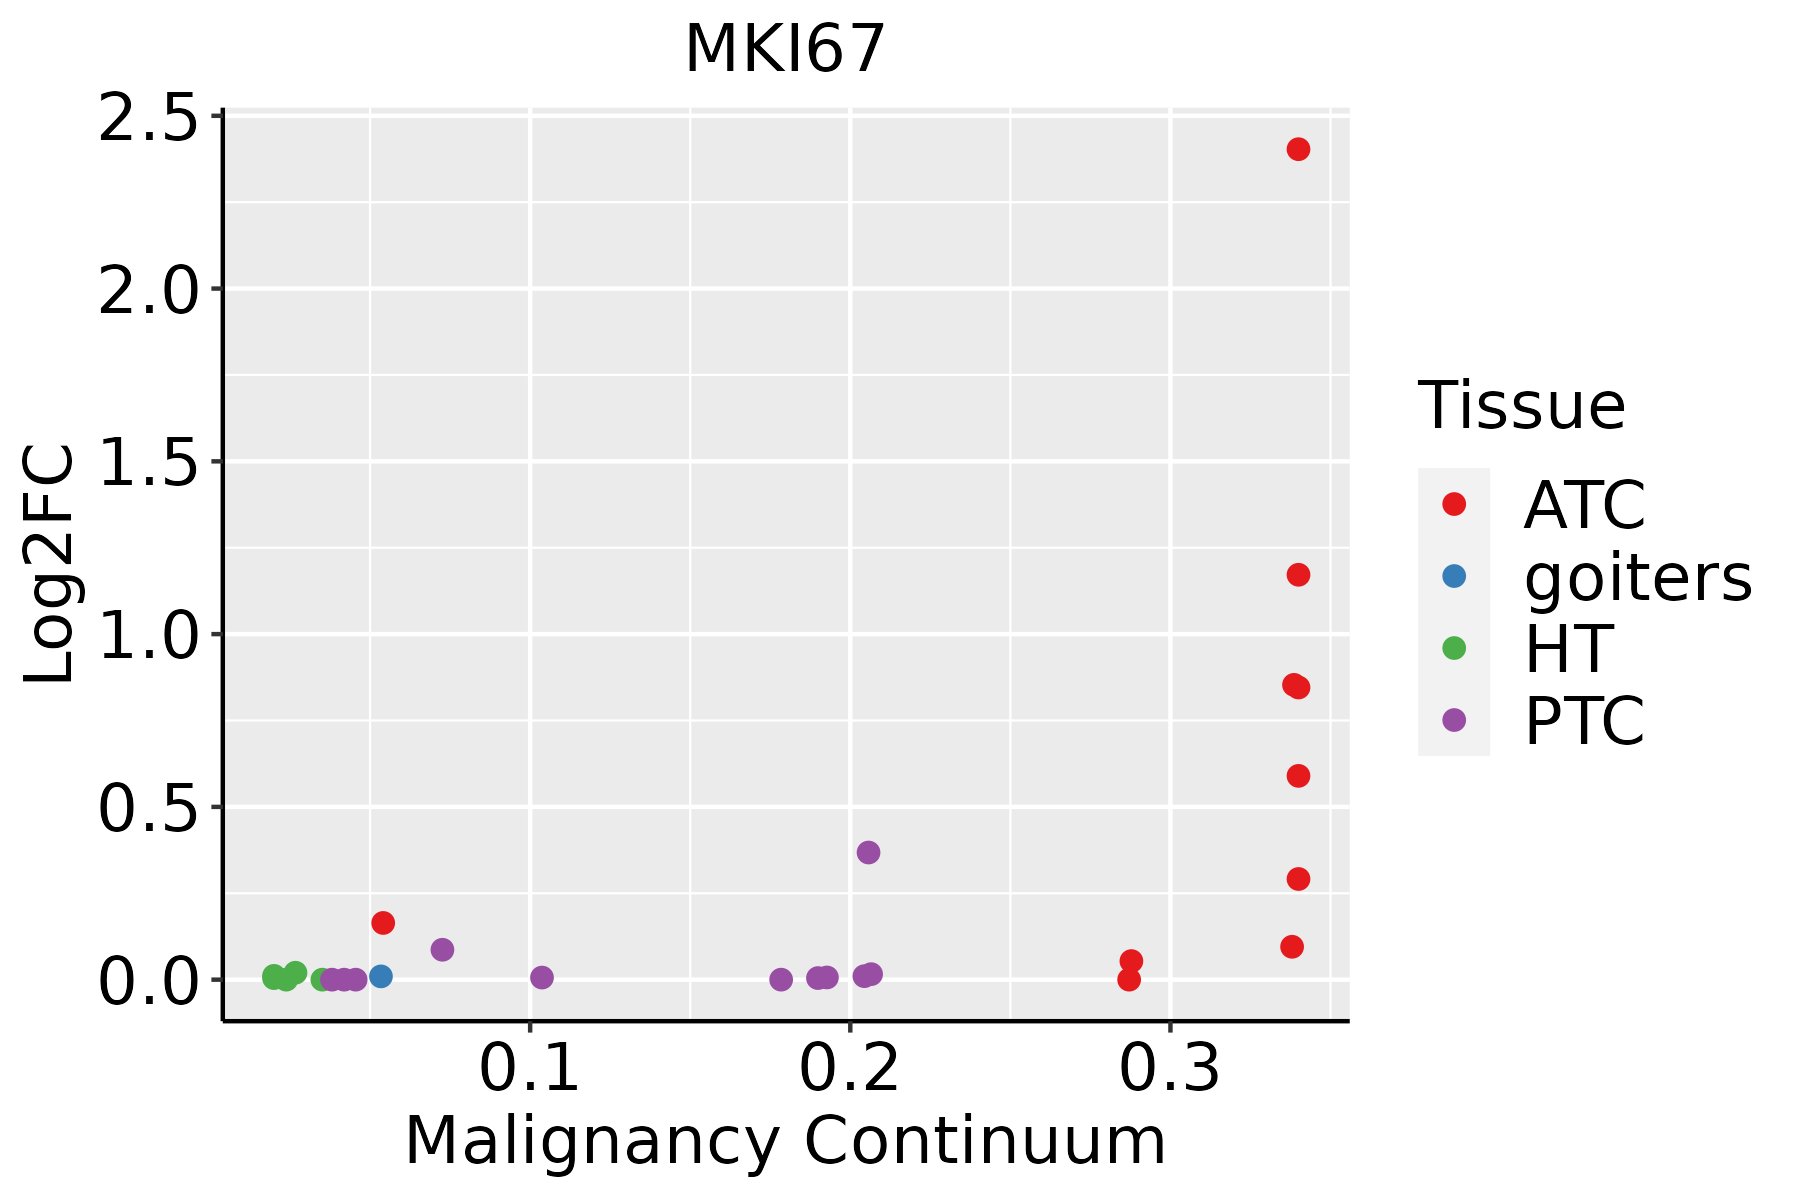 | ATC: Anaplastic thyroid cancer |
| HT: Hashimoto's thyroiditis | ||
| PTC: Papillary thyroid cancer |
| ∗log2FC in expression of this searched gene in stem-like cells from each diseased tissue sample relative to stem-like cells in normal samples in each tissue plotted against the malignancy continuum. Samples are colored based on if they are from different disease stage. |
Top |
Malignant transformation related pathway analysis |
| Find out the enriched GO biological processes and KEGG pathways involved in transition from healthy to precancer to cancer |
| Tissue | Disease Stage | Enriched GO biological Processes |
| Colorectum | AD |  |
| Colorectum | SER |  |
| Colorectum | MSS |  |
| Colorectum | MSI-H |  |
| Colorectum | FAP |  |
| ∗Top 15 enriched GO BP terms are showed in the bar plot of each disease state in each tissue. Each row represents a significant GO biological process which is colored according to the -log10(p.adjust). |
| Page: 1 2 3 4 5 6 7 8 9 |
| GO ID | Tissue | Disease Stage | Description | Gene Ratio | Bg Ratio | pvalue | p.adjust | Count |
| GO:00073466 | Cervix | CC | regulation of mitotic cell cycle | 88/2311 | 457/18723 | 1.26e-05 | 2.60e-04 | 88 |
| GO:00063257 | Cervix | CC | chromatin organization | 78/2311 | 409/18723 | 5.40e-05 | 8.02e-04 | 78 |
| GO:01400143 | Cervix | CC | mitotic nuclear division | 50/2311 | 287/18723 | 7.27e-03 | 3.91e-02 | 50 |
| GO:00482851 | Cervix | CC | organelle fission | 78/2311 | 488/18723 | 9.70e-03 | 4.79e-02 | 78 |
| GO:0006325 | Colorectum | AD | chromatin organization | 119/3918 | 409/18723 | 4.85e-05 | 8.33e-04 | 119 |
| GO:0007346 | Colorectum | AD | regulation of mitotic cell cycle | 119/3918 | 457/18723 | 4.60e-03 | 3.14e-02 | 119 |
| GO:0140014 | Colorectum | AD | mitotic nuclear division | 78/3918 | 287/18723 | 6.48e-03 | 4.05e-02 | 78 |
| GO:00063252 | Colorectum | MSS | chromatin organization | 107/3467 | 409/18723 | 7.22e-05 | 1.21e-03 | 107 |
| GO:00073461 | Colorectum | MSS | regulation of mitotic cell cycle | 108/3467 | 457/18723 | 3.30e-03 | 2.50e-02 | 108 |
| GO:01400141 | Colorectum | MSS | mitotic nuclear division | 70/3467 | 287/18723 | 7.48e-03 | 4.72e-02 | 70 |
| GO:00063253 | Colorectum | FAP | chromatin organization | 84/2622 | 409/18723 | 1.62e-04 | 2.47e-03 | 84 |
| GO:00073462 | Colorectum | FAP | regulation of mitotic cell cycle | 85/2622 | 457/18723 | 3.41e-03 | 2.48e-02 | 85 |
| GO:014001414 | Esophagus | ESCC | mitotic nuclear division | 218/8552 | 287/18723 | 6.17e-26 | 1.78e-23 | 218 |
| GO:000705911 | Esophagus | ESCC | chromosome segregation | 238/8552 | 346/18723 | 1.72e-18 | 1.82e-16 | 238 |
| GO:000734615 | Esophagus | ESCC | regulation of mitotic cell cycle | 293/8552 | 457/18723 | 8.00e-16 | 5.64e-14 | 293 |
| GO:00482853 | Esophagus | ESCC | organelle fission | 301/8552 | 488/18723 | 4.64e-13 | 2.12e-11 | 301 |
| GO:00002802 | Esophagus | ESCC | nuclear division | 270/8552 | 439/18723 | 1.17e-11 | 4.24e-10 | 270 |
| GO:00519833 | Esophagus | ESCC | regulation of chromosome segregation | 67/8552 | 91/18723 | 5.42e-08 | 9.66e-07 | 67 |
| GO:000632517 | Esophagus | ESCC | chromatin organization | 240/8552 | 409/18723 | 6.52e-08 | 1.14e-06 | 240 |
| GO:00070883 | Esophagus | ESCC | regulation of mitotic nuclear division | 78/8552 | 110/18723 | 6.96e-08 | 1.21e-06 | 78 |
| Page: 1 2 3 4 |
| Pathway ID | Tissue | Disease Stage | Description | Gene Ratio | Bg Ratio | pvalue | p.adjust | qvalue | Count |
| Page: 1 |
Top |
Cell-cell communication analysis |
| Identification of potential cell-cell interactions between two cell types and their ligand-receptor pairs for different disease states |
| Ligand | Receptor | LRpair | Pathway | Tissue | Disease Stage |
| Page: 1 |
Top |
Single-cell gene regulatory network inference analysis |
| Find out the significant the regulons (TFs) and the target genes of each regulon across cell types for different disease states |
| TF | Cell Type | Tissue | Disease Stage | Target Gene | RSS | Regulon Activity |
| ∗The dot plots of a searched regulon are shown for all cell subpopulations in each disease state of each tissue based on the regulon specific score inferred using pySCENIC and by calculating the average expression. |
| Page: 1 |
Top |
Somatic mutation of malignant transformation related genes |
| Annotation of somatic variants for genes involved in malignant transformation |
| Hugo Symbol | Variant Class | Variant Classification | dbSNP RS | HGVSc | HGVSp | HGVSp Short | SWISSPROT | BIOTYPE | SIFT | PolyPhen | Tumor Sample Barcode | Tissue | Histology | Sex | Age | Stage | Therapy Types | Drugs | Outcome |
| MKI67 | SNV | Missense_Mutation | novel | c.8210N>A | p.Pro2737His | p.P2737H | P46013 | protein_coding | deleterious(0.05) | probably_damaging(0.992) | TCGA-A2-A25A-01 | Breast | breast invasive carcinoma | Female | <65 | I/II | Unspecific | Cytoxan | SD |
| MKI67 | SNV | Missense_Mutation | rs757873177 | c.1398N>C | p.Lys466Asn | p.K466N | P46013 | protein_coding | deleterious(0) | possibly_damaging(0.536) | TCGA-A7-A26H-01 | Breast | breast invasive carcinoma | Female | >=65 | I/II | Hormone Therapy | anastrozole | PD |
| MKI67 | SNV | Missense_Mutation | novel | c.6505G>A | p.Asp2169Asn | p.D2169N | P46013 | protein_coding | tolerated(0.15) | possibly_damaging(0.642) | TCGA-A7-A6VX-01 | Breast | breast invasive carcinoma | Female | >=65 | I/II | Chemotherapy | docetaxel | CR |
| MKI67 | SNV | Missense_Mutation | c.599N>T | p.Ser200Phe | p.S200F | P46013 | protein_coding | deleterious(0.01) | possibly_damaging(0.735) | TCGA-A8-A08H-01 | Breast | breast invasive carcinoma | Female | >=65 | I/II | Unknown | Unknown | SD | |
| MKI67 | SNV | Missense_Mutation | c.4840N>A | p.Ala1614Thr | p.A1614T | P46013 | protein_coding | tolerated(0.44) | possibly_damaging(0.523) | TCGA-A8-A09Z-01 | Breast | breast invasive carcinoma | Female | >=65 | I/II | Unknown | Unknown | SD | |
| MKI67 | SNV | Missense_Mutation | c.9156G>C | p.Leu3052Phe | p.L3052F | P46013 | protein_coding | deleterious(0.03) | probably_damaging(0.916) | TCGA-AC-A23H-01 | Breast | breast invasive carcinoma | Female | >=65 | I/II | Unknown | Unknown | PD | |
| MKI67 | SNV | Missense_Mutation | novel | c.4809N>C | p.Glu1603Asp | p.E1603D | P46013 | protein_coding | tolerated(0.66) | benign(0.001) | TCGA-AN-A046-01 | Breast | breast invasive carcinoma | Female | >=65 | I/II | Unknown | Unknown | SD |
| MKI67 | SNV | Missense_Mutation | novel | c.4224N>T | p.Lys1408Asn | p.K1408N | P46013 | protein_coding | tolerated(0.07) | possibly_damaging(0.579) | TCGA-AN-A046-01 | Breast | breast invasive carcinoma | Female | >=65 | I/II | Unknown | Unknown | SD |
| MKI67 | SNV | Missense_Mutation | novel | c.1444N>T | p.Ser482Cys | p.S482C | P46013 | protein_coding | deleterious(0.01) | probably_damaging(0.981) | TCGA-AR-A0TU-01 | Breast | breast invasive carcinoma | Female | <65 | I/II | Unspecific | Doxorubicin | SD |
| MKI67 | SNV | Missense_Mutation | c.1022N>G | p.Glu341Gly | p.E341G | P46013 | protein_coding | tolerated(0.09) | benign(0.093) | TCGA-B6-A0RL-01 | Breast | breast invasive carcinoma | Female | <65 | I/II | Unknown | Unknown | SD |
| Page: 1 2 3 4 5 6 7 8 9 10 11 12 13 14 15 16 17 18 19 20 21 22 23 24 25 26 27 28 29 30 31 32 33 34 35 36 37 38 39 40 41 42 43 44 |
Top |
Related drugs of malignant transformation related genes |
| Identification of chemicals and drugs interact with genes involved in malignant transfromation |
| (DGIdb 4.0) |
| Entrez ID | Symbol | Category | Interaction Types | Drug Claim Name | Drug Name | PMIDs |
| Page: 1 |

Copyright 2023-Present -The University of Texas Health Science Center at Houston |