
|
|||||
|
 | |
| |
| |
| |
| |
| |
|
Gene: MITD1 |
Gene summary for MITD1 |
| Gene information | Species | Human | Gene symbol | MITD1 | Gene ID | 129531 |
| Gene name | microtubule interacting and trafficking domain containing 1 | |
| Gene Alias | MITD1 | |
| Cytomap | 2q11.2 | |
| Gene Type | protein-coding | GO ID | GO:0000278 | UniProtAcc | Q8WV92 |
Top |
Malignant transformation analysis |
| Identification of the aberrant gene expression in precancerous and cancerous lesions by comparing the gene expression of stem-like cells in diseased tissues with normal stem cells |
| Entrez ID | Symbol | Replicates | Species | Organ | Tissue | Adj P-value | Log2FC | Malignancy |
| 129531 | MITD1 | LZE2T | Human | Esophagus | ESCC | 5.39e-04 | 5.82e-01 | 0.082 |
| 129531 | MITD1 | LZE4T | Human | Esophagus | ESCC | 3.76e-06 | 7.99e-02 | 0.0811 |
| 129531 | MITD1 | LZE5T | Human | Esophagus | ESCC | 3.58e-08 | 4.02e-01 | 0.0514 |
| 129531 | MITD1 | LZE7T | Human | Esophagus | ESCC | 5.75e-11 | 3.18e-01 | 0.0667 |
| 129531 | MITD1 | LZE8T | Human | Esophagus | ESCC | 4.70e-04 | 1.63e-01 | 0.067 |
| 129531 | MITD1 | LZE20T | Human | Esophagus | ESCC | 2.01e-08 | 1.89e-01 | 0.0662 |
| 129531 | MITD1 | LZE21D1 | Human | Esophagus | HGIN | 8.61e-03 | 1.50e-01 | 0.0632 |
| 129531 | MITD1 | LZE22T | Human | Esophagus | ESCC | 3.99e-08 | 4.49e-01 | 0.068 |
| 129531 | MITD1 | LZE24T | Human | Esophagus | ESCC | 2.22e-12 | 4.16e-01 | 0.0596 |
| 129531 | MITD1 | LZE6T | Human | Esophagus | ESCC | 2.31e-09 | 1.68e-01 | 0.0845 |
| 129531 | MITD1 | P1T-E | Human | Esophagus | ESCC | 1.80e-08 | 2.52e-01 | 0.0875 |
| 129531 | MITD1 | P2T-E | Human | Esophagus | ESCC | 1.35e-20 | 3.04e-01 | 0.1177 |
| 129531 | MITD1 | P4T-E | Human | Esophagus | ESCC | 3.59e-25 | 5.69e-01 | 0.1323 |
| 129531 | MITD1 | P5T-E | Human | Esophagus | ESCC | 7.70e-22 | 2.88e-01 | 0.1327 |
| 129531 | MITD1 | P8T-E | Human | Esophagus | ESCC | 1.31e-19 | 3.50e-01 | 0.0889 |
| 129531 | MITD1 | P9T-E | Human | Esophagus | ESCC | 9.73e-18 | 4.29e-01 | 0.1131 |
| 129531 | MITD1 | P10T-E | Human | Esophagus | ESCC | 3.03e-34 | 5.31e-01 | 0.116 |
| 129531 | MITD1 | P11T-E | Human | Esophagus | ESCC | 6.26e-04 | 3.40e-01 | 0.1426 |
| 129531 | MITD1 | P12T-E | Human | Esophagus | ESCC | 7.81e-18 | 2.73e-01 | 0.1122 |
| 129531 | MITD1 | P15T-E | Human | Esophagus | ESCC | 3.79e-27 | 3.07e-01 | 0.1149 |
| Page: 1 2 3 4 5 6 |
| Tissue | Expression Dynamics | Abbreviation |
| Esophagus | 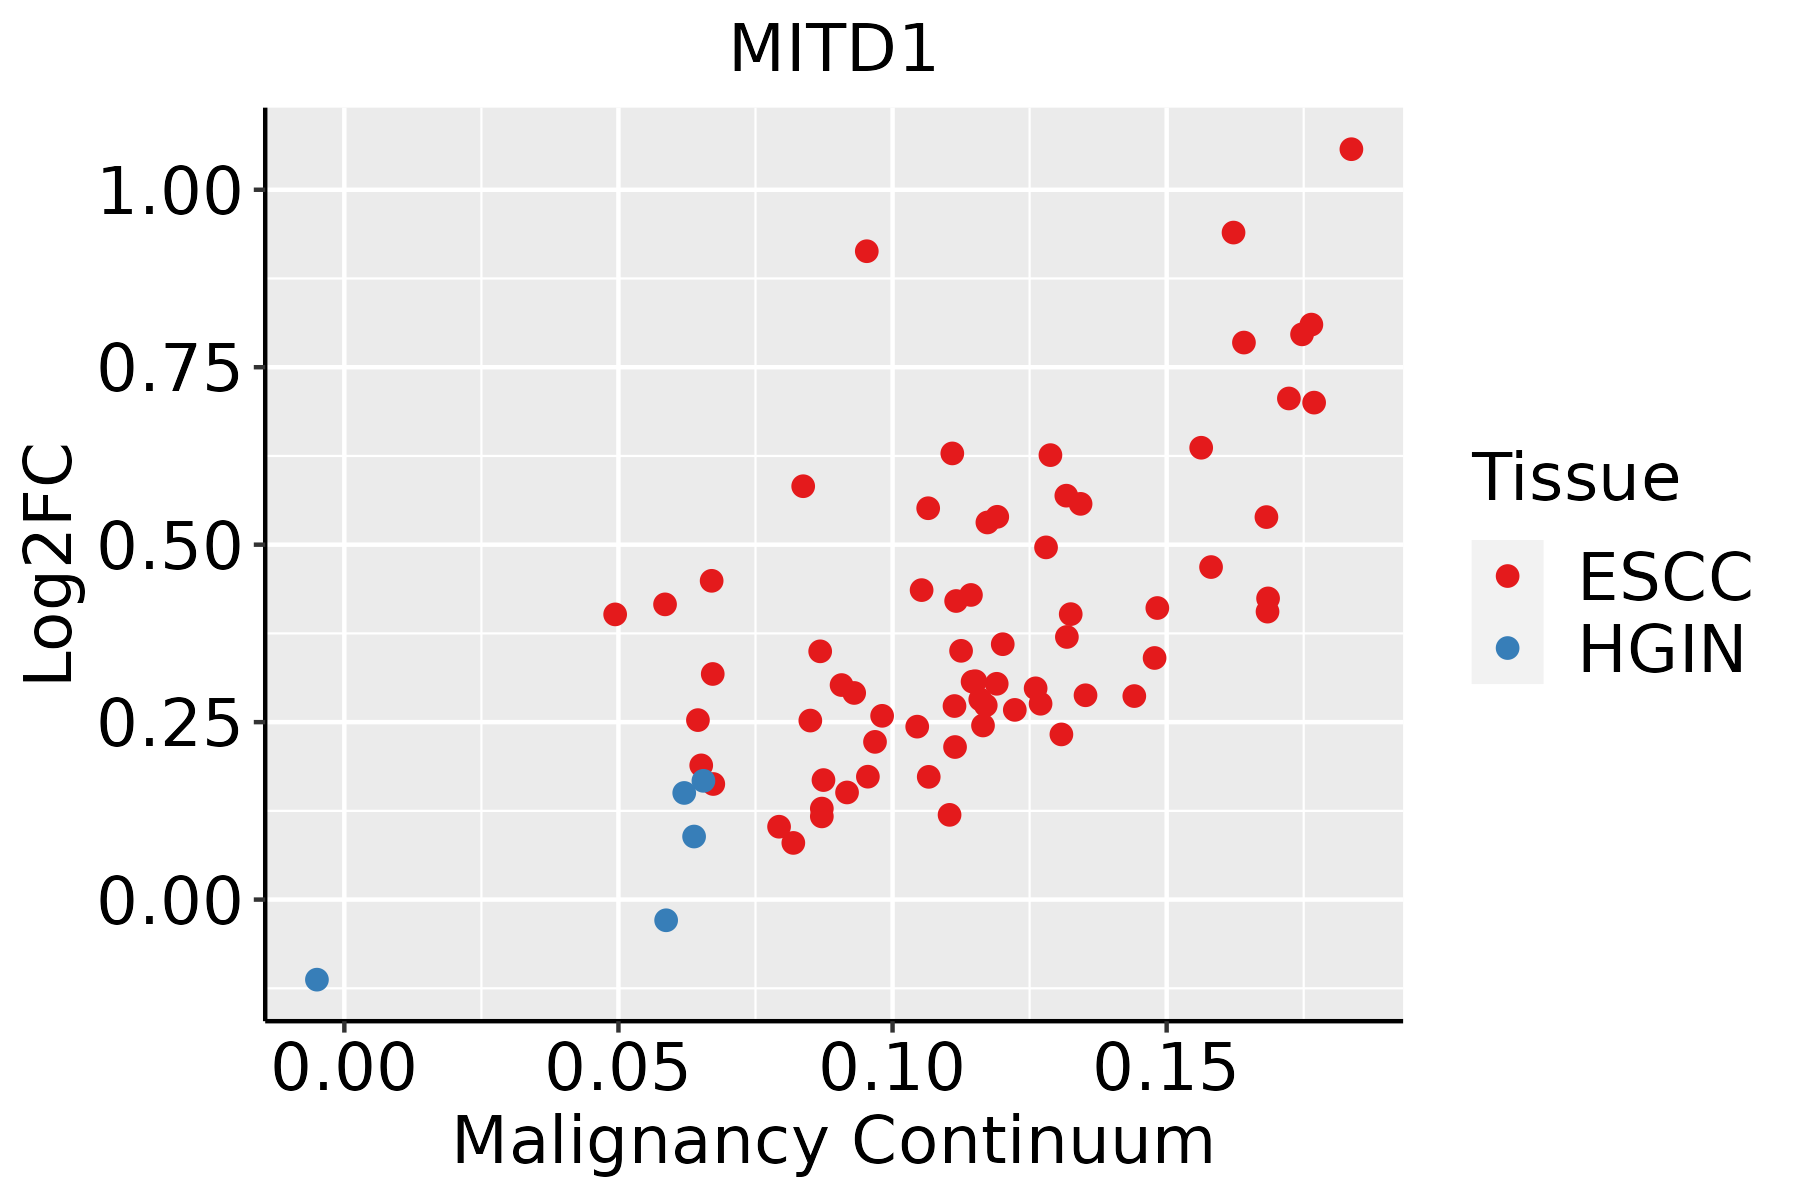 | ESCC: Esophageal squamous cell carcinoma |
| HGIN: High-grade intraepithelial neoplasias | ||
| LGIN: Low-grade intraepithelial neoplasias | ||
| Liver | 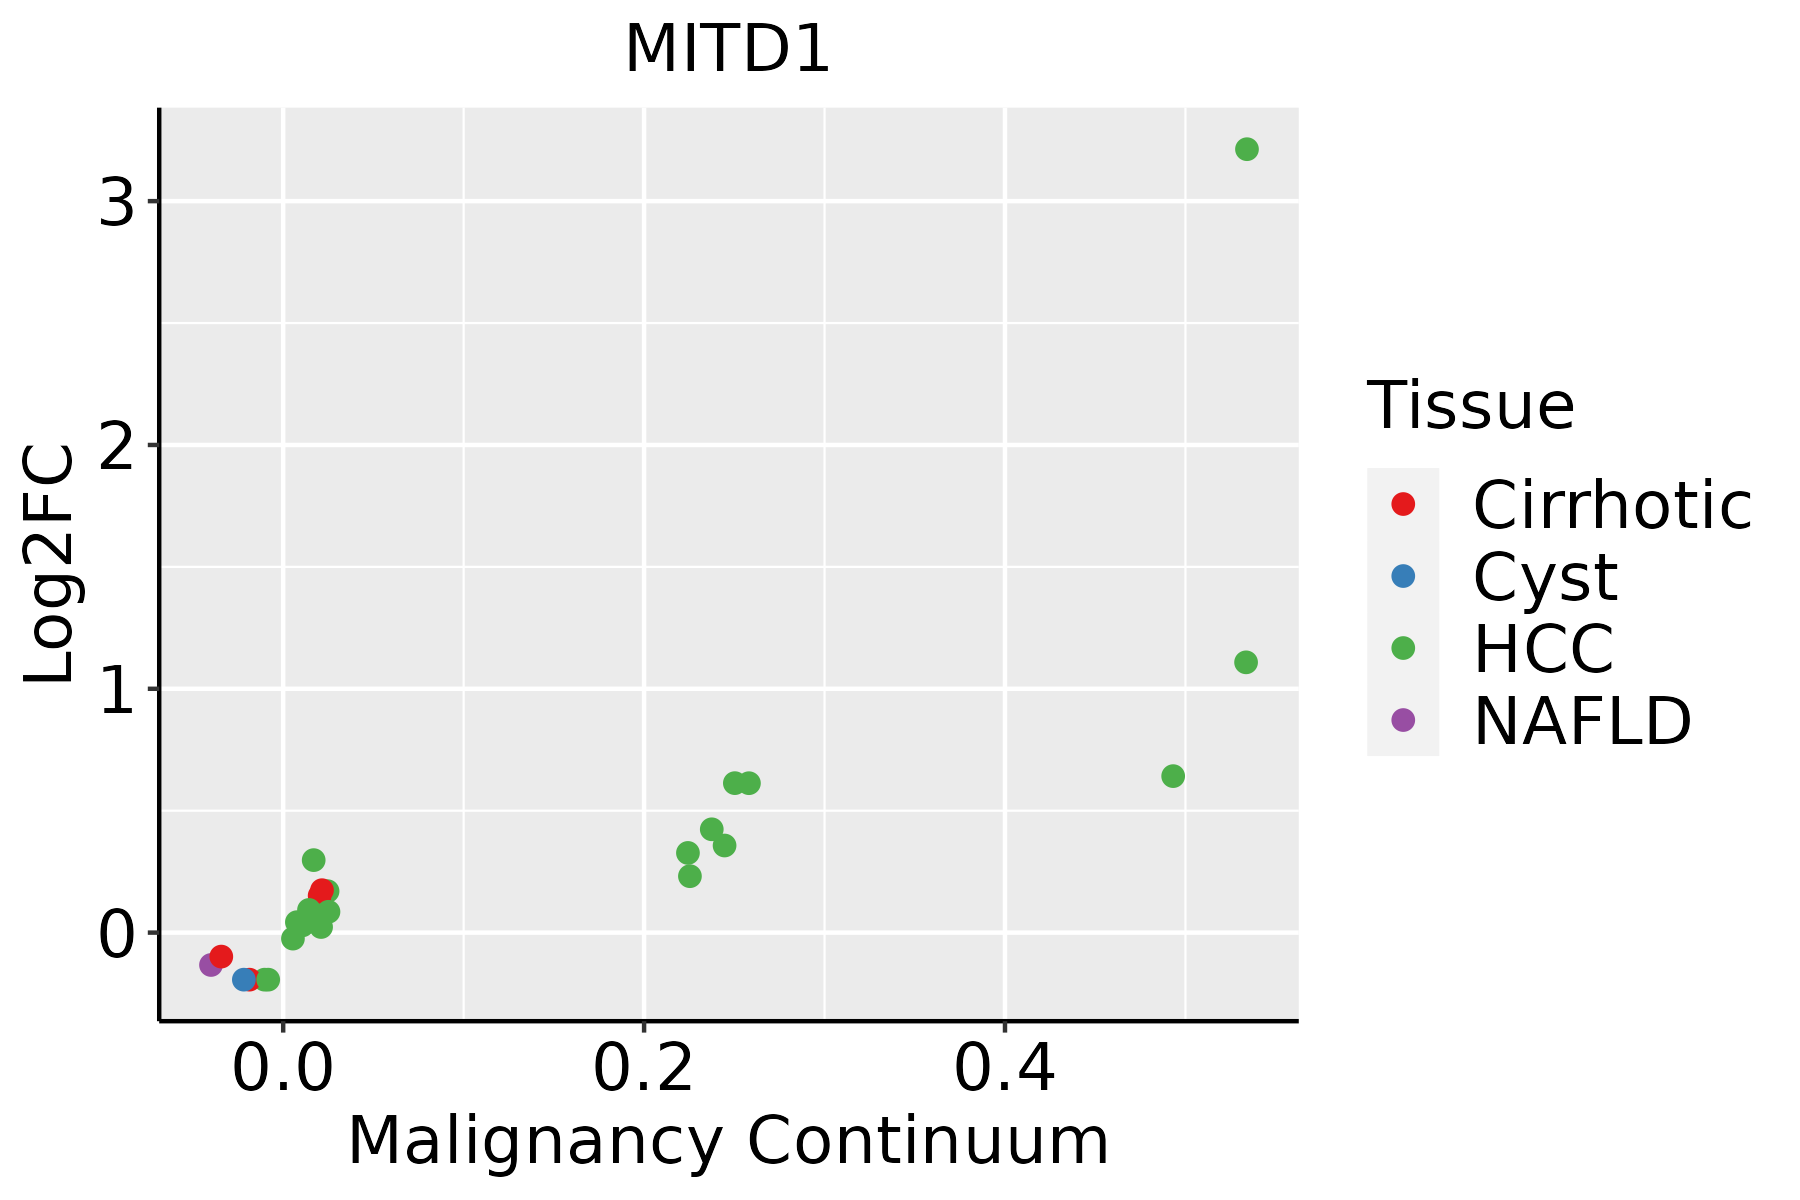 | HCC: Hepatocellular carcinoma |
| NAFLD: Non-alcoholic fatty liver disease | ||
| Oral Cavity | 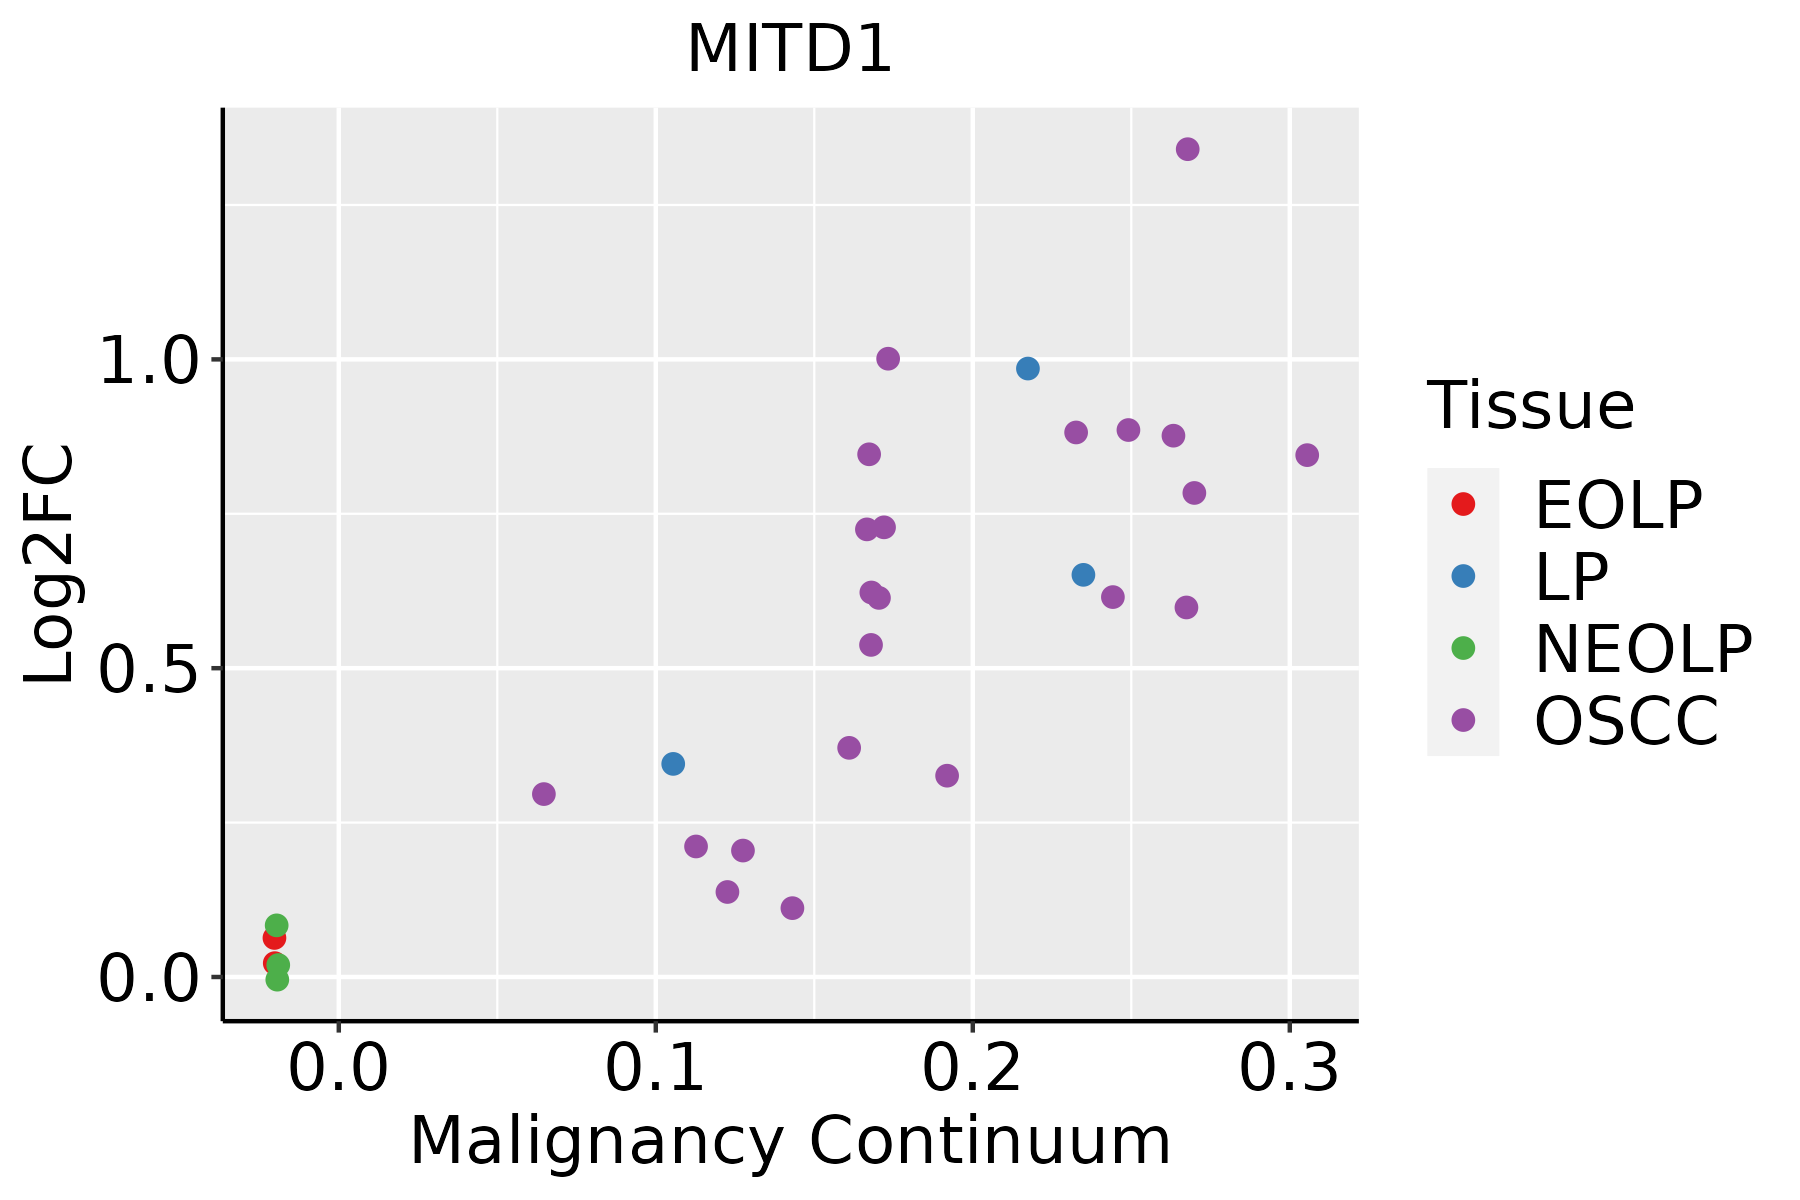 | EOLP: Erosive Oral lichen planus |
| LP: leukoplakia | ||
| NEOLP: Non-erosive oral lichen planus | ||
| OSCC: Oral squamous cell carcinoma | ||
| Skin | 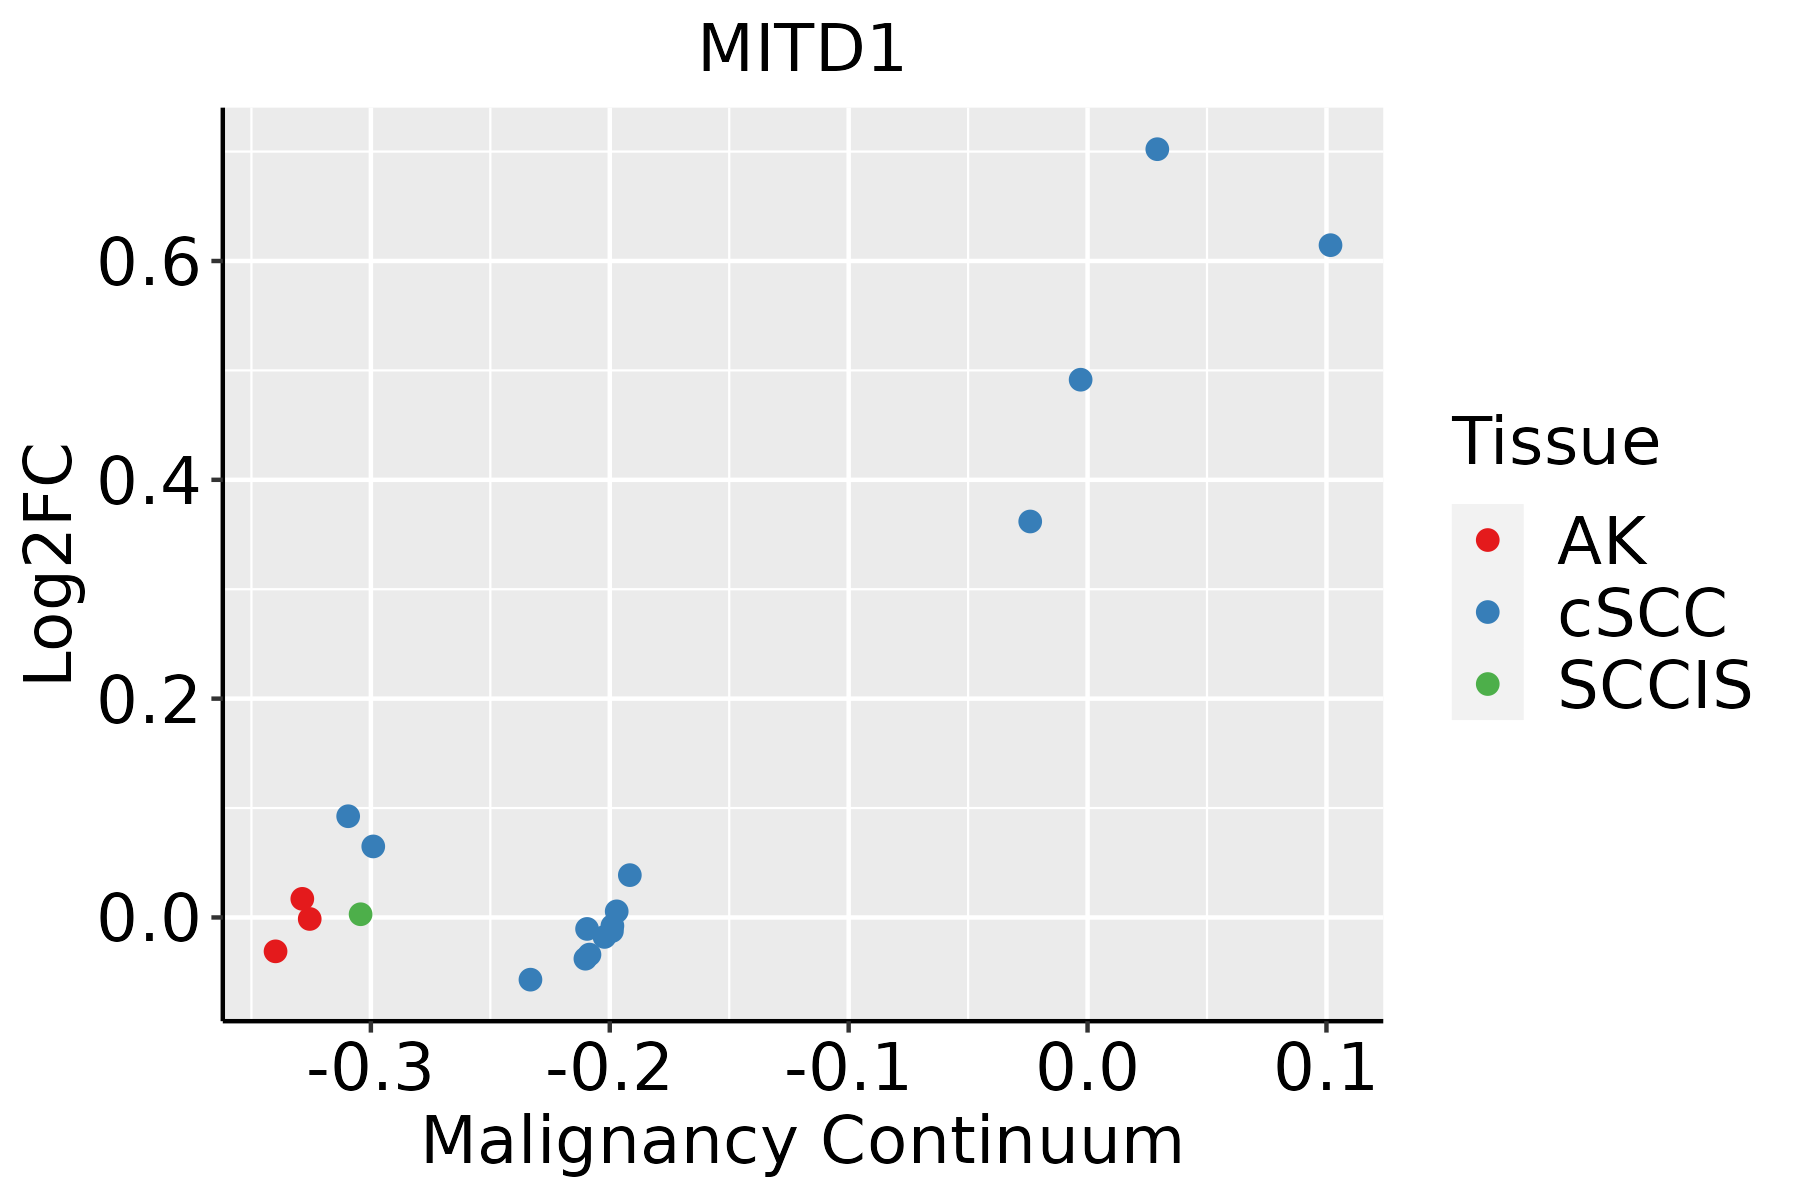 | AK: Actinic keratosis |
| cSCC: Cutaneous squamous cell carcinoma | ||
| SCCIS:squamous cell carcinoma in situ | ||
| Thyroid |  | ATC: Anaplastic thyroid cancer |
| HT: Hashimoto's thyroiditis | ||
| PTC: Papillary thyroid cancer |
| ∗log2FC in expression of this searched gene in stem-like cells from each diseased tissue sample relative to stem-like cells in normal samples in each tissue plotted against the malignancy continuum. Samples are colored based on if they are from different disease stage. |
Top |
Malignant transformation related pathway analysis |
| Find out the enriched GO biological processes and KEGG pathways involved in transition from healthy to precancer to cancer |
| Tissue | Disease Stage | Enriched GO biological Processes |
| Colorectum | AD |  |
| Colorectum | SER |  |
| Colorectum | MSS |  |
| Colorectum | MSI-H |  |
| Colorectum | FAP |  |
| ∗Top 15 enriched GO BP terms are showed in the bar plot of each disease state in each tissue. Each row represents a significant GO biological process which is colored according to the -log10(p.adjust). |
| Page: 1 2 3 4 5 6 7 8 9 |
| GO ID | Tissue | Disease Stage | Description | Gene Ratio | Bg Ratio | pvalue | p.adjust | Count |
| GO:000091015 | Esophagus | HGIN | cytokinesis | 44/2587 | 173/18723 | 3.26e-05 | 8.32e-04 | 44 |
| GO:005109825 | Esophagus | HGIN | regulation of binding | 78/2587 | 363/18723 | 3.73e-05 | 9.30e-04 | 78 |
| GO:00616406 | Esophagus | HGIN | cytoskeleton-dependent cytokinesis | 27/2587 | 100/18723 | 3.71e-04 | 5.77e-03 | 27 |
| GO:00619525 | Esophagus | HGIN | midbody abscission | 8/2587 | 17/18723 | 9.96e-04 | 1.25e-02 | 8 |
| GO:19024108 | Esophagus | HGIN | mitotic cytokinetic process | 9/2587 | 23/18723 | 2.37e-03 | 2.40e-02 | 9 |
| GO:00002816 | Esophagus | HGIN | mitotic cytokinesis | 19/2587 | 71/18723 | 2.90e-03 | 2.81e-02 | 19 |
| GO:003209110 | Esophagus | HGIN | negative regulation of protein binding | 23/2587 | 94/18723 | 3.92e-03 | 3.54e-02 | 23 |
| GO:005110020 | Esophagus | HGIN | negative regulation of binding | 35/2587 | 162/18723 | 4.32e-03 | 3.84e-02 | 35 |
| GO:00325066 | Esophagus | HGIN | cytokinetic process | 12/2587 | 39/18723 | 4.97e-03 | 4.18e-02 | 12 |
| GO:0051098111 | Esophagus | ESCC | regulation of binding | 251/8552 | 363/18723 | 6.73e-20 | 8.46e-18 | 251 |
| GO:004339320 | Esophagus | ESCC | regulation of protein binding | 135/8552 | 196/18723 | 3.69e-11 | 1.22e-09 | 135 |
| GO:000028115 | Esophagus | ESCC | mitotic cytokinesis | 58/8552 | 71/18723 | 4.34e-10 | 1.15e-08 | 58 |
| GO:003250614 | Esophagus | ESCC | cytokinetic process | 35/8552 | 39/18723 | 9.38e-09 | 1.90e-07 | 35 |
| GO:0051100111 | Esophagus | ESCC | negative regulation of binding | 109/8552 | 162/18723 | 2.10e-08 | 4.03e-07 | 109 |
| GO:000091016 | Esophagus | ESCC | cytokinesis | 115/8552 | 173/18723 | 2.48e-08 | 4.68e-07 | 115 |
| GO:006164015 | Esophagus | ESCC | cytoskeleton-dependent cytokinesis | 72/8552 | 100/18723 | 8.10e-08 | 1.39e-06 | 72 |
| GO:190241014 | Esophagus | ESCC | mitotic cytokinetic process | 22/8552 | 23/18723 | 4.17e-07 | 5.71e-06 | 22 |
| GO:006195214 | Esophagus | ESCC | midbody abscission | 17/8552 | 17/18723 | 1.63e-06 | 1.95e-05 | 17 |
| GO:003209116 | Esophagus | ESCC | negative regulation of protein binding | 65/8552 | 94/18723 | 3.46e-06 | 3.82e-05 | 65 |
| GO:005109812 | Liver | Cirrhotic | regulation of binding | 148/4634 | 363/18723 | 9.14e-12 | 5.97e-10 | 148 |
| Page: 1 2 3 4 5 |
| Pathway ID | Tissue | Disease Stage | Description | Gene Ratio | Bg Ratio | pvalue | p.adjust | qvalue | Count |
| Page: 1 |
Top |
Cell-cell communication analysis |
| Identification of potential cell-cell interactions between two cell types and their ligand-receptor pairs for different disease states |
| Ligand | Receptor | LRpair | Pathway | Tissue | Disease Stage |
| Page: 1 |
Top |
Single-cell gene regulatory network inference analysis |
| Find out the significant the regulons (TFs) and the target genes of each regulon across cell types for different disease states |
| TF | Cell Type | Tissue | Disease Stage | Target Gene | RSS | Regulon Activity |
| ∗The dot plots of a searched regulon are shown for all cell subpopulations in each disease state of each tissue based on the regulon specific score inferred using pySCENIC and by calculating the average expression. |
| Page: 1 |
Top |
Somatic mutation of malignant transformation related genes |
| Annotation of somatic variants for genes involved in malignant transformation |
| Hugo Symbol | Variant Class | Variant Classification | dbSNP RS | HGVSc | HGVSp | HGVSp Short | SWISSPROT | BIOTYPE | SIFT | PolyPhen | Tumor Sample Barcode | Tissue | Histology | Sex | Age | Stage | Therapy Types | Drugs | Outcome |
| MITD1 | SNV | Missense_Mutation | c.228N>T | p.Lys76Asn | p.K76N | Q8WV92 | protein_coding | deleterious(0) | probably_damaging(1) | TCGA-AN-A046-01 | Breast | breast invasive carcinoma | Female | >=65 | I/II | Unknown | Unknown | SD | |
| MITD1 | insertion | Nonsense_Mutation | novel | c.259_260insGTGTGATTGCCTCCTAG | p.Lys87SerfsTer6 | p.K87Sfs*6 | Q8WV92 | protein_coding | TCGA-AR-A0U0-01 | Breast | breast invasive carcinoma | Female | >=65 | I/II | Unknown | Unknown | SD | ||
| MITD1 | SNV | Missense_Mutation | c.219A>T | p.Glu73Asp | p.E73D | Q8WV92 | protein_coding | deleterious(0.02) | probably_damaging(1) | TCGA-AA-3510-01 | Colorectum | colon adenocarcinoma | Male | >=65 | I/II | Unknown | Unknown | SD | |
| MITD1 | SNV | Missense_Mutation | c.52N>A | p.Val18Met | p.V18M | Q8WV92 | protein_coding | tolerated(0.09) | possibly_damaging(0.478) | TCGA-AA-3966-01 | Colorectum | colon adenocarcinoma | Female | >=65 | I/II | Unknown | Unknown | SD | |
| MITD1 | SNV | Missense_Mutation | novel | c.194N>A | p.Ile65Asn | p.I65N | Q8WV92 | protein_coding | deleterious(0) | probably_damaging(0.942) | TCGA-A5-A0GP-01 | Endometrium | uterine corpus endometrioid carcinoma | Female | <65 | I/II | Unknown | Unknown | SD |
| MITD1 | SNV | Missense_Mutation | rs373110802 | c.407N>A | p.Arg136Gln | p.R136Q | Q8WV92 | protein_coding | tolerated(0.09) | possibly_damaging(0.799) | TCGA-A5-A2K5-01 | Endometrium | uterine corpus endometrioid carcinoma | Female | >=65 | I/II | Unknown | Unknown | SD |
| MITD1 | SNV | Missense_Mutation | novel | c.196N>C | p.Ser66Pro | p.S66P | Q8WV92 | protein_coding | tolerated(0.09) | possibly_damaging(0.683) | TCGA-AJ-A3BH-01 | Endometrium | uterine corpus endometrioid carcinoma | Female | Unknown | I/II | Unknown | Unknown | SD |
| MITD1 | SNV | Missense_Mutation | novel | c.160N>T | p.Asp54Tyr | p.D54Y | Q8WV92 | protein_coding | deleterious(0) | probably_damaging(0.963) | TCGA-AJ-A5DW-01 | Endometrium | uterine corpus endometrioid carcinoma | Female | <65 | I/II | Unknown | Unknown | SD |
| MITD1 | SNV | Missense_Mutation | c.377N>T | p.Arg126Ile | p.R126I | Q8WV92 | protein_coding | deleterious(0) | probably_damaging(0.999) | TCGA-AX-A0J0-01 | Endometrium | uterine corpus endometrioid carcinoma | Female | <65 | I/II | Unknown | Unknown | SD | |
| MITD1 | SNV | Missense_Mutation | novel | c.713N>C | p.Val238Ala | p.V238A | Q8WV92 | protein_coding | deleterious(0) | possibly_damaging(0.891) | TCGA-AX-A2HJ-01 | Endometrium | uterine corpus endometrioid carcinoma | Female | <65 | I/II | Unknown | Unknown | SD |
| Page: 1 2 3 |
Top |
Related drugs of malignant transformation related genes |
| Identification of chemicals and drugs interact with genes involved in malignant transfromation |
| (DGIdb 4.0) |
| Entrez ID | Symbol | Category | Interaction Types | Drug Claim Name | Drug Name | PMIDs |
| Page: 1 |

Copyright 2023-Present -The University of Texas Health Science Center at Houston |