Schematic overview of the cellular and molecular mechanisms involved in the cancer progression, including the proposed cellular and molecular mechanisms in cancer cells trajectory. AT1: alveolar type 1 cells; AT2: alveolar type 2 cells; AAH: atypical adenomatous hyperplasia; AIS: adenocarcinoma in situ; MIA: minimally invasive adenocarcinoma; IA: invasive adenocarcinoma; EMT: epithelial-mesenchymal transition

Home

Download

Statistics

Help

Contact

Center for Computational Systems Medicine
leaf

Gene summary

leaf

Malignant transformation analysis

leaf

Malignant transformation related pathway analysis

leaf

Cell-cell communication analysis

leaf

Single-cell gene regulatory network inference analysis

leaf

Somatic mutation of malignant transformation related genes

leaf

Related drugs of malignant transformation related genes

Gene: MISP

Gene summary for MISP

check button Gene summary.

Gene informationSpeciesHuman
Gene symbol

MISP

Gene ID

126353

Gene namemitotic spindle positioning
Gene AliasC19orf21
Cytomap19p13.3
Gene Typeprotein-coding
GO ID

GO:0000132

UniProtAcc

Q8IVT2


Top

Malignant transformation analysis

check button Identification of the aberrant gene expression in precancerous and cancerous lesions by comparing the gene expression of stem-like cells in diseased tissues with normal stem cells
check button Malignant transformation involving gene list.
Entrez IDSymbolReplicatesSpeciesOrganTissueAdj P-valueLog2FCMalignancy
126353MISPHTA11_3410_2000001011HumanColorectumAD2.56e-033.48e-020.0155
126353MISPHTA11_2487_2000001011HumanColorectumSER1.66e-231.20e+00-0.1808
126353MISPHTA11_2951_2000001011HumanColorectumAD1.39e-033.18e-010.0216
126353MISPHTA11_1938_2000001011HumanColorectumAD2.55e-125.19e-01-0.0811
126353MISPHTA11_347_2000001011HumanColorectumAD8.85e-113.75e-01-0.1954
126353MISPHTA11_411_2000001011HumanColorectumSER7.54e-091.74e+00-0.2602
126353MISPHTA11_2112_2000001011HumanColorectumSER2.09e-171.73e+00-0.2196
126353MISPHTA11_3361_2000001011HumanColorectumAD2.81e-116.91e-01-0.1207
126353MISPHTA11_83_2000001011HumanColorectumSER2.99e-106.33e-01-0.1526
126353MISPHTA11_696_2000001011HumanColorectumAD2.63e-207.56e-01-0.1464
126353MISPHTA11_866_2000001011HumanColorectumAD1.26e-043.30e-01-0.1001
126353MISPHTA11_1391_2000001011HumanColorectumAD1.71e-177.49e-01-0.059
126353MISPHTA11_2992_2000001011HumanColorectumSER3.06e-058.13e-01-0.1706
126353MISPHTA11_5212_2000001011HumanColorectumAD1.16e-067.94e-01-0.2061
126353MISPHTA11_546_2000001011HumanColorectumAD2.91e-052.87e-01-0.0842
126353MISPHTA11_866_3004761011HumanColorectumAD1.86e-061.37e-010.096
126353MISPHTA11_4255_2000001011HumanColorectumSER4.78e-031.71e-010.0446
126353MISPHTA11_8622_2000001021HumanColorectumSER2.43e-022.83e-010.0528
126353MISPHTA11_10711_2000001011HumanColorectumAD9.18e-033.08e-010.0338
126353MISPHTA11_7696_3000711011HumanColorectumAD2.71e-135.37e-010.0674
Page: 1 2 3 4 5 6 

check button Transcriptomic changes along malignancy continuum.
TissueExpression DynamicsAbbreviation
Colorectum (GSE201348)The image shows the transcriptomic changes along malignancy continuum.log2FC in expression of this searched gene in stem-like cells from each diseased tissue sample relative to stem-like cells in normal samples in each tissue plotted against the malignancy continuum. Samples are colored based on if they are from different disease stage.FAP: Familial adenomatous polyposis
CRC: Colorectal cancer
Colorectum (HTA11)The image shows the transcriptomic changes along malignancy continuum.log2FC in expression of this searched gene in stem-like cells from each diseased tissue sample relative to stem-like cells in normal samples in each tissue plotted against the malignancy continuum. Samples are colored based on if they are from different disease stage.AD: Adenomas
SER: Sessile serrated lesions
MSI-H: Microsatellite-high colorectal cancer
MSS: Microsatellite stable colorectal cancer
EsophagusThe image shows the transcriptomic changes along malignancy continuum.log2FC in expression of this searched gene in stem-like cells from each diseased tissue sample relative to stem-like cells in normal samples in each tissue plotted against the malignancy continuum. Samples are colored based on if they are from different disease stage.ESCC: Esophageal squamous cell carcinoma
HGIN: High-grade intraepithelial neoplasias
LGIN: Low-grade intraepithelial neoplasias
GCThe image shows the transcriptomic changes along malignancy continuum.log2FC in expression of this searched gene in stem-like cells from each diseased tissue sample relative to stem-like cells in normal samples in each tissue plotted against the malignancy continuum. Samples are colored based on if they are from different disease stage.
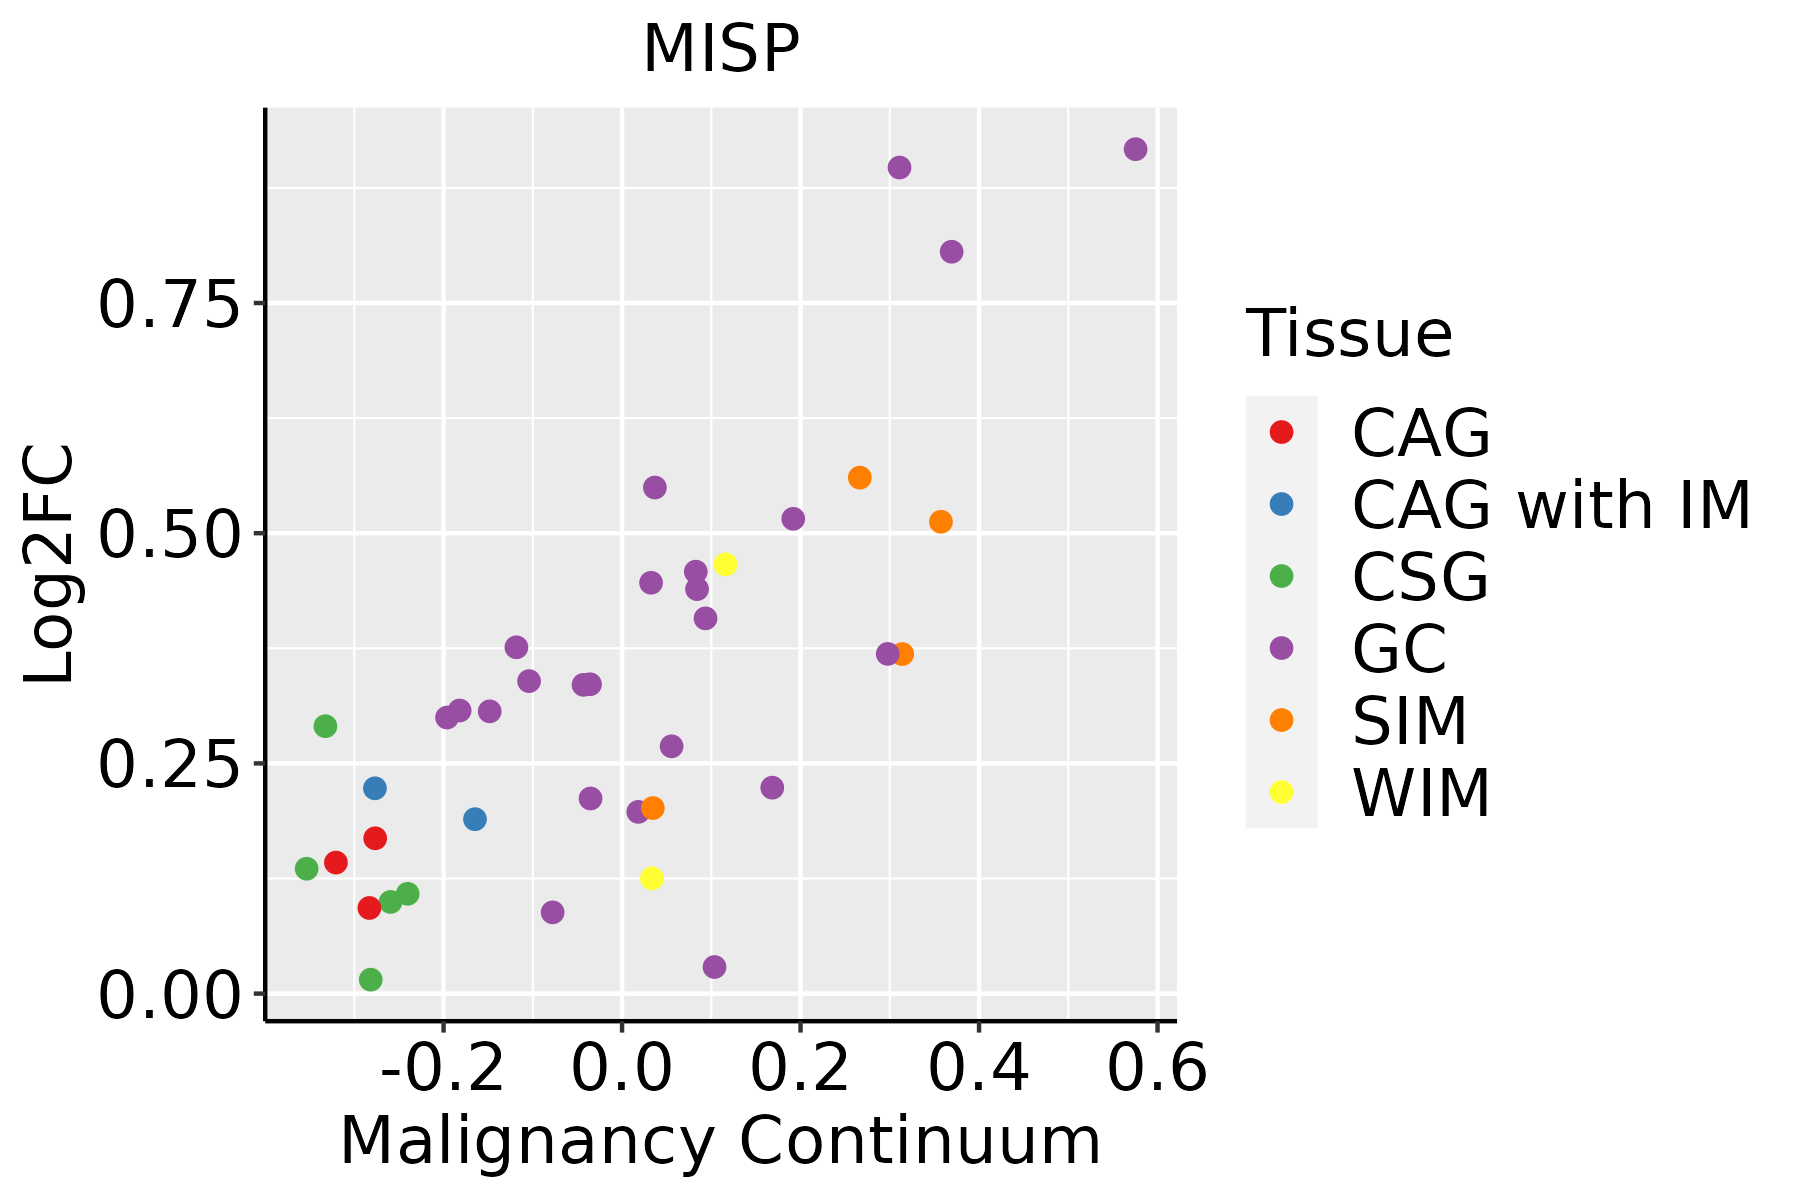
CAG: Chronic atrophic gastritis
CAG with IM: Chronic atrophic gastritis with intestinal metaplasia
CSG: Chronic superficial gastritis
GC: Gastric cancer
SIM: Severe intestinal metaplasia
WIM: Wild intestinal metaplasia
Oral CavityThe image shows the transcriptomic changes along malignancy continuum.log2FC in expression of this searched gene in stem-like cells from each diseased tissue sample relative to stem-like cells in normal samples in each tissue plotted against the malignancy continuum. Samples are colored based on if they are from different disease stage.
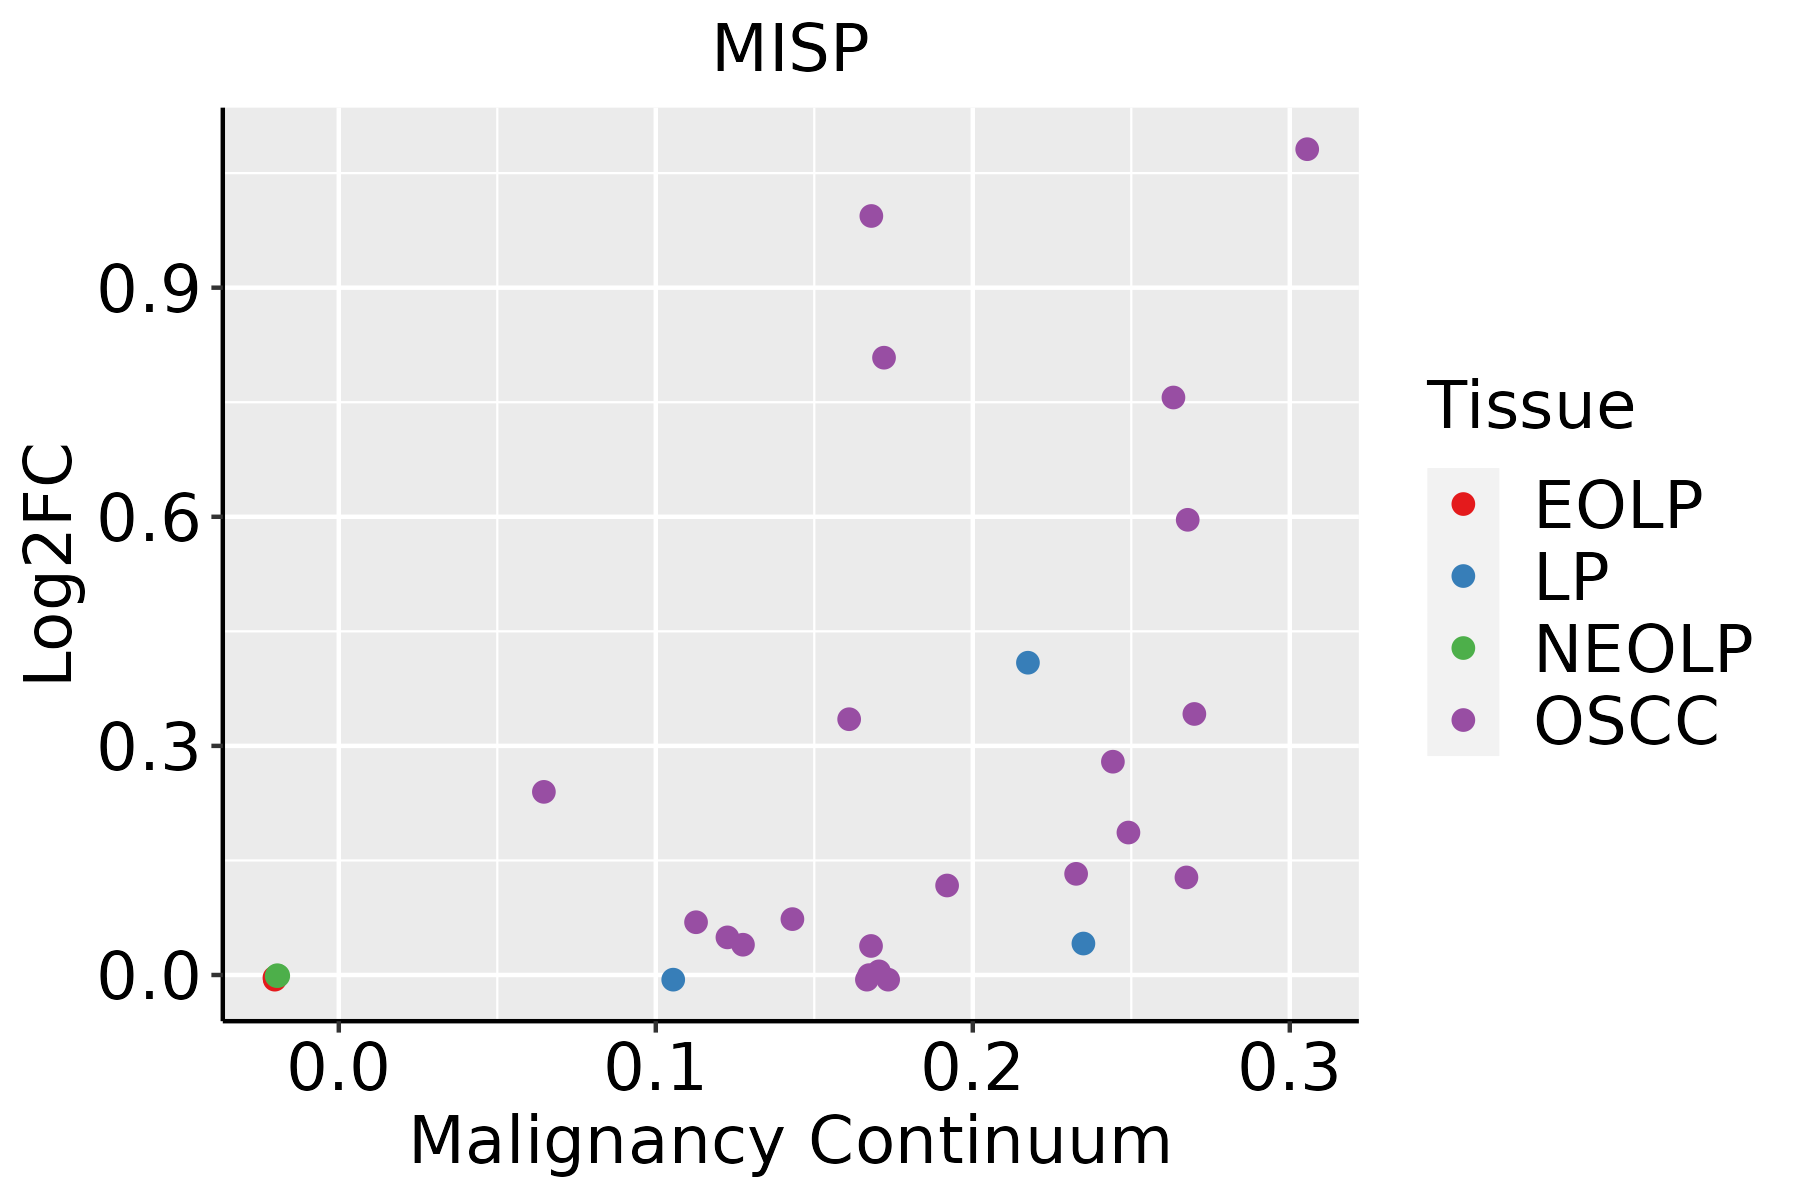
EOLP: Erosive Oral lichen planus
LP: leukoplakia
NEOLP: Non-erosive oral lichen planus
OSCC: Oral squamous cell carcinoma
SkinThe image shows the transcriptomic changes along malignancy continuum.log2FC in expression of this searched gene in stem-like cells from each diseased tissue sample relative to stem-like cells in normal samples in each tissue plotted against the malignancy continuum. Samples are colored based on if they are from different disease stage.
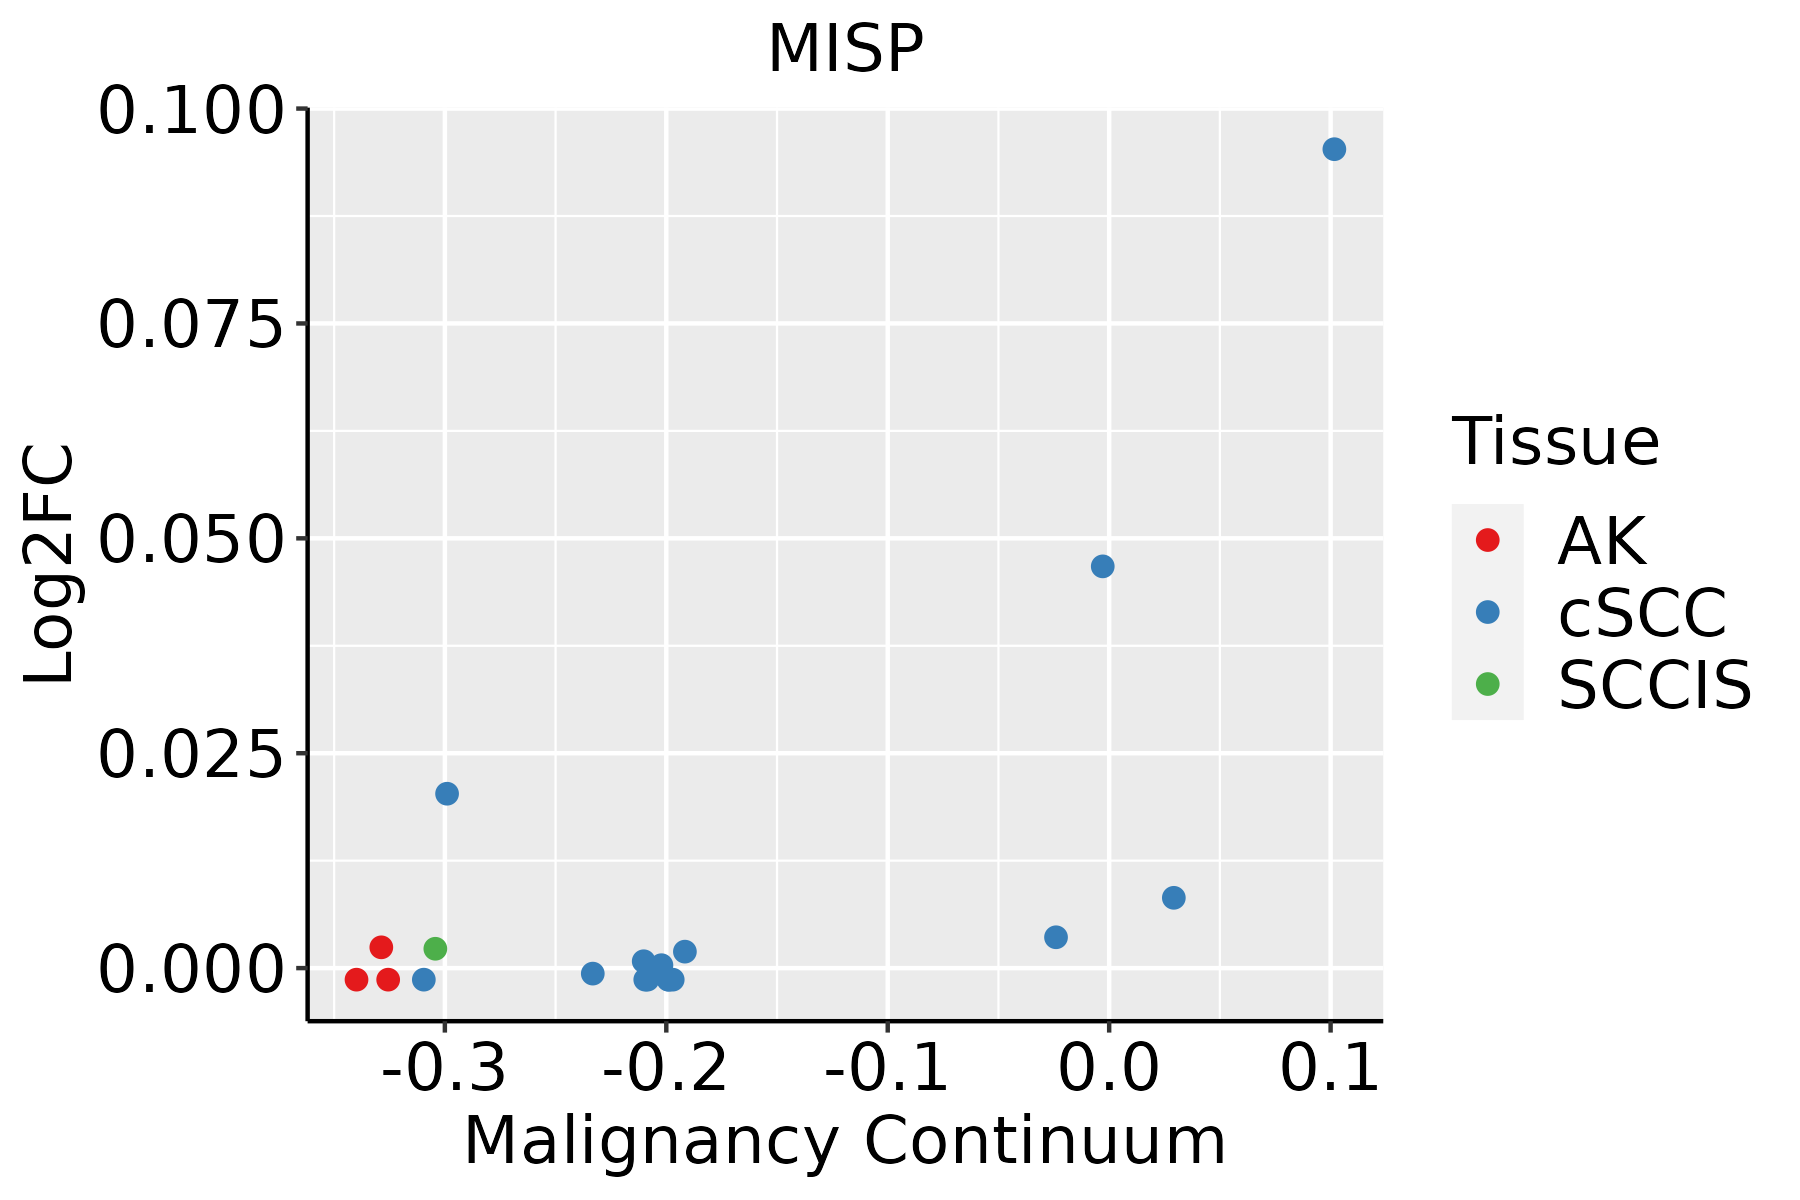
AK: Actinic keratosis
cSCC: Cutaneous squamous cell carcinoma
SCCIS:squamous cell carcinoma in situ
∗log2FC in expression of this searched gene in stem-like cells from each diseased tissue sample relative to stem-like cells in normal samples in each tissue plotted against the malignancy continuum. Samples are colored based on if they are from different disease stage.

Top

Malignant transformation related pathway analysis

check buttonFind out the enriched GO biological processes and KEGG pathways involved in transition from healthy to precancer to cancer
check button Figure of enriched GO biological processes.
TissueDisease StageEnriched GO biological Processes
ColorectumADGO analysis - Figure of enriched GO biological processes: Top 15 enriched GO BP terms are showed in the bar plot of each disease state in each tissue. Each row represents a significant GO biological process which is colored according to the -log10(p.adjust).
ColorectumSERGO analysis - Figure of enriched GO biological processes: Top 15 enriched GO BP terms are showed in the bar plot of each disease state in each tissue. Each row represents a significant GO biological process which is colored according to the -log10(p.adjust).
ColorectumMSSGO analysis - Figure of enriched GO biological processes: Top 15 enriched GO BP terms are showed in the bar plot of each disease state in each tissue. Each row represents a significant GO biological process which is colored according to the -log10(p.adjust).
ColorectumMSI-HGO analysis - Figure of enriched GO biological processes: Top 15 enriched GO BP terms are showed in the bar plot of each disease state in each tissue. Each row represents a significant GO biological process which is colored according to the -log10(p.adjust).
ColorectumFAPGO analysis - Figure of enriched GO biological processes: Top 15 enriched GO BP terms are showed in the bar plot of each disease state in each tissue. Each row represents a significant GO biological process which is colored according to the -log10(p.adjust).
∗Top 15 enriched GO BP terms are showed in the bar plot of each disease state in each tissue. Each row represents a significant GO biological process which is colored according to the -log10(p.adjust).
Page: 1 2 3 4 5 6 7 8 9 

check button Enriched GO biological processes.
GO IDTissueDisease StageDescriptionGene RatioBg Ratiopvaluep.adjustCount
GO:1990778ColorectumADprotein localization to cell periphery129/3918333/187235.51e-141.15e-11129
GO:0051656ColorectumADestablishment of organelle localization131/3918390/187233.00e-092.06e-07131
GO:1904375ColorectumADregulation of protein localization to cell periphery54/3918125/187231.52e-089.00e-0754
GO:0007163ColorectumADestablishment or maintenance of cell polarity77/3918218/187235.72e-072.08e-0577
GO:0030010ColorectumADestablishment of cell polarity50/3918143/187236.90e-051.11e-0350
GO:0007051ColorectumADspindle organization58/3918184/187234.71e-045.20e-0358
GO:1902850ColorectumADmicrotubule cytoskeleton organization involved in mitosis48/3918147/187235.87e-046.21e-0348
GO:0090307ColorectumADmitotic spindle assembly25/391865/187239.12e-048.71e-0325
GO:0007052ColorectumADmitotic spindle organization40/3918120/187231.03e-039.61e-0340
GO:0051660ColorectumADestablishment of centrosome localization7/391810/187231.15e-031.04e-027
GO:0051225ColorectumADspindle assembly37/3918117/187234.32e-032.96e-0237
GO:0140014ColorectumADmitotic nuclear division78/3918287/187236.48e-034.05e-0278
GO:19907781ColorectumSERprotein localization to cell periphery98/2897333/187236.09e-119.57e-0998
GO:00516561ColorectumSERestablishment of organelle localization100/2897390/187231.11e-076.79e-06100
GO:19043751ColorectumSERregulation of protein localization to cell periphery40/2897125/187232.85e-061.16e-0440
GO:00071631ColorectumSERestablishment or maintenance of cell polarity60/2897218/187233.45e-061.33e-0460
GO:00300101ColorectumSERestablishment of cell polarity37/2897143/187238.72e-041.06e-0237
GO:19907782ColorectumMSSprotein localization to cell periphery120/3467333/187232.02e-145.47e-12120
GO:19043752ColorectumMSSregulation of protein localization to cell periphery51/3467125/187235.46e-093.55e-0751
GO:00516562ColorectumMSSestablishment of organelle localization115/3467390/187237.30e-083.67e-06115
Page: 1 2 3 4 5 6 

check button Enriched KEGG pathways.
Pathway IDTissueDisease StageDescriptionGene RatioBg Ratiopvaluep.adjustqvalueCount
Page: 1 

Top

Cell-cell communication analysis

check buttonIdentification of potential cell-cell interactions between two cell types and their ligand-receptor pairs for different disease states
LigandReceptorLRpairPathwayTissueDisease Stage
Page: 1 

Top

Single-cell gene regulatory network inference analysis

check buttonFind out the significant the regulons (TFs) and the target genes of each regulon across cell types for different disease states
TFCell TypeTissueDisease StageTarget GeneRSSRegulon Activity
∗The dot plots of a searched regulon are shown for all cell subpopulations in each disease state of each tissue based on the regulon specific score inferred using pySCENIC and by calculating the average expression.
Page: 1 

Top

Somatic mutation of malignant transformation related genes

check buttonAnnotation of somatic variants for genes involved in malignant transformation
Hugo SymbolVariant ClassVariant ClassificationdbSNP RSHGVScHGVSpHGVSp ShortSWISSPROTBIOTYPESIFTPolyPhenTumor Sample BarcodeTissueHistologySexAgeStageTherapy TypesDrugsOutcome
MISPSNVMissense_Mutationrs140196930c.1169N>Ap.Arg390Glnp.R390QQ8IVT2protein_codingtolerated(0.14)benign(0.037)TCGA-A2-A3KC-01Breastbreast invasive carcinomaFemale<65I/IIChemotherapyadriamycinSD
MISPSNVMissense_Mutationnovelc.1609A>Tp.Arg537Trpp.R537WQ8IVT2protein_codingdeleterious(0)probably_damaging(0.995)TCGA-A8-A08R-01Breastbreast invasive carcinomaFemale<65I/IIUnknownUnknownSD
MISPSNVMissense_Mutationrs775079741c.1225G>Ap.Asp409Asnp.D409NQ8IVT2protein_codingtolerated(0.22)benign(0.027)TCGA-LL-A5YN-01Breastbreast invasive carcinomaFemale<65I/IIChemotherapycarboplatinSD
MISPinsertionIn_Frame_Insnovelc.1988_1989insTAGGAAp.Ala663_Met664insArgAsnp.A663_M664insRNQ8IVT2protein_codingTCGA-A8-A0A4-01Breastbreast invasive carcinomaFemale>=65I/IIHormone TherapytamoxiphenCR
MISPinsertionFrame_Shift_Insnovelc.1990_1991insTAGGAATGTGCCACTGCACCCAGATAGTTTATTTTTATp.Met664IlefsTer57p.M664Ifs*57Q8IVT2protein_codingTCGA-A8-A0A4-01Breastbreast invasive carcinomaFemale>=65I/IIHormone TherapytamoxiphenCR
MISPinsertionNonsense_Mutationnovelc.1899_1900insGGACTACAGGCGCCTGCCTCCACGCCTGGCTAATTTTTTTGTp.Lys633_Lys634insGlyLeuGlnAlaProAlaSerThrProGlyTerPhePheCysp.K633_K634insGLQAPASTPG*FFCQ8IVT2protein_codingTCGA-AO-A0JB-01Breastbreast invasive carcinomaFemale<65III/IVChemotherapycyclophosphamideSD
MISPSNVMissense_Mutationnovelc.1691N>Cp.Glu564Alap.E564AQ8IVT2protein_codingdeleterious(0)possibly_damaging(0.841)TCGA-DS-A1OD-01Cervixcervical & endocervical cancerFemale<65I/IIChemotherapycisplatinSD
MISPSNVMissense_Mutationc.503G>Tp.Gly168Valp.G168VQ8IVT2protein_codingtolerated(0.33)benign(0.01)TCGA-EA-A3HU-01Cervixcervical & endocervical cancerFemale<65I/IIUnknownUnknownSD
MISPSNVMissense_Mutationnovelc.1747G>Cp.Asp583Hisp.D583HQ8IVT2protein_codingdeleterious(0.04)possibly_damaging(0.503)TCGA-JW-A5VJ-01Cervixcervical & endocervical cancerFemale<65I/IIUnknownUnknownPD
MISPSNVMissense_Mutationc.1787N>Ap.Thr596Lysp.T596KQ8IVT2protein_codingtolerated(0.06)probably_damaging(0.927)TCGA-LP-A4AW-01Cervixcervical & endocervical cancerFemale<65I/IIUnknownUnknownSD
Page: 1 2 3 4 5 6 7 8 

Top

Related drugs of malignant transformation related genes

check buttonIdentification of chemicals and drugs interact with genes involved in malignant transfromation
(DGIdb 4.0)
Entrez IDSymbolCategoryInteraction TypesDrug Claim NameDrug NamePMIDs
Page: 1