
|
|||||
|
 | |
| |
| |
| |
| |
| |
|
Gene: MIR31HG |
Gene summary for MIR31HG |
| Gene information | Species | Human | Gene symbol | MIR31HG | Gene ID | 554202 |
| Gene name | MIR31 host gene | |
| Gene Alias | LncHIFCAR | |
| Cytomap | 9p21.3 | |
| Gene Type | ncRNA | GO ID | NA | UniProtAcc | NA |
Top |
Malignant transformation analysis |
| Identification of the aberrant gene expression in precancerous and cancerous lesions by comparing the gene expression of stem-like cells in diseased tissues with normal stem cells |
| Entrez ID | Symbol | Replicates | Species | Organ | Tissue | Adj P-value | Log2FC | Malignancy |
| 554202 | MIR31HG | CCI_1 | Human | Cervix | CC | 3.85e-31 | 1.68e+00 | 0.528 |
| 554202 | MIR31HG | CCI_2 | Human | Cervix | CC | 1.92e-27 | 1.64e+00 | 0.5249 |
| 554202 | MIR31HG | CCI_3 | Human | Cervix | CC | 2.36e-71 | 2.18e+00 | 0.516 |
| 554202 | MIR31HG | CCII_1 | Human | Cervix | CC | 3.47e-03 | 1.31e-01 | 0.3249 |
| 554202 | MIR31HG | sample3 | Human | Cervix | CC | 1.61e-02 | 6.45e-02 | 0.1387 |
| 554202 | MIR31HG | AEH-subject2 | Human | Endometrium | AEH | 2.17e-08 | 2.74e-01 | -0.2525 |
| 554202 | MIR31HG | AEH-subject5 | Human | Endometrium | AEH | 1.95e-33 | 7.01e-01 | -0.2953 |
| 554202 | MIR31HG | EEC-subject3 | Human | Endometrium | EEC | 1.60e-18 | 5.54e-01 | -0.2525 |
| 554202 | MIR31HG | GSM5252135_BPH511PrPUr_Fcol_3GEX | Human | Prostate | BPH | 1.72e-02 | 2.56e-01 | -0.1833 |
| 554202 | MIR31HG | 047563_1562-all-cells | Human | Prostate | BPH | 2.43e-08 | 2.43e-01 | 0.0791 |
| 554202 | MIR31HG | 052095_1628-all-cells | Human | Prostate | BPH | 1.06e-05 | 3.66e-01 | 0.1032 |
| 554202 | MIR31HG | 052097_1595-all-cells | Human | Prostate | BPH | 3.80e-29 | 8.54e-01 | 0.0972 |
| 554202 | MIR31HG | 052099_1652-all-cells | Human | Prostate | BPH | 6.25e-32 | 9.88e-01 | 0.1038 |
| 554202 | MIR31HG | P1_S1_AK | Human | Skin | AK | 9.58e-18 | 4.64e-01 | -0.3399 |
| 554202 | MIR31HG | P2_S3_AK | Human | Skin | AK | 2.16e-07 | 1.81e-01 | -0.3287 |
| 554202 | MIR31HG | P2_S4_SCCIS | Human | Skin | SCCIS | 4.29e-43 | 9.60e-01 | -0.3043 |
| 554202 | MIR31HG | P5_S10_cSCC | Human | Skin | cSCC | 1.47e-57 | 7.79e-01 | -0.299 |
| Page: 1 |
| Tissue | Expression Dynamics | Abbreviation |
| Cervix | 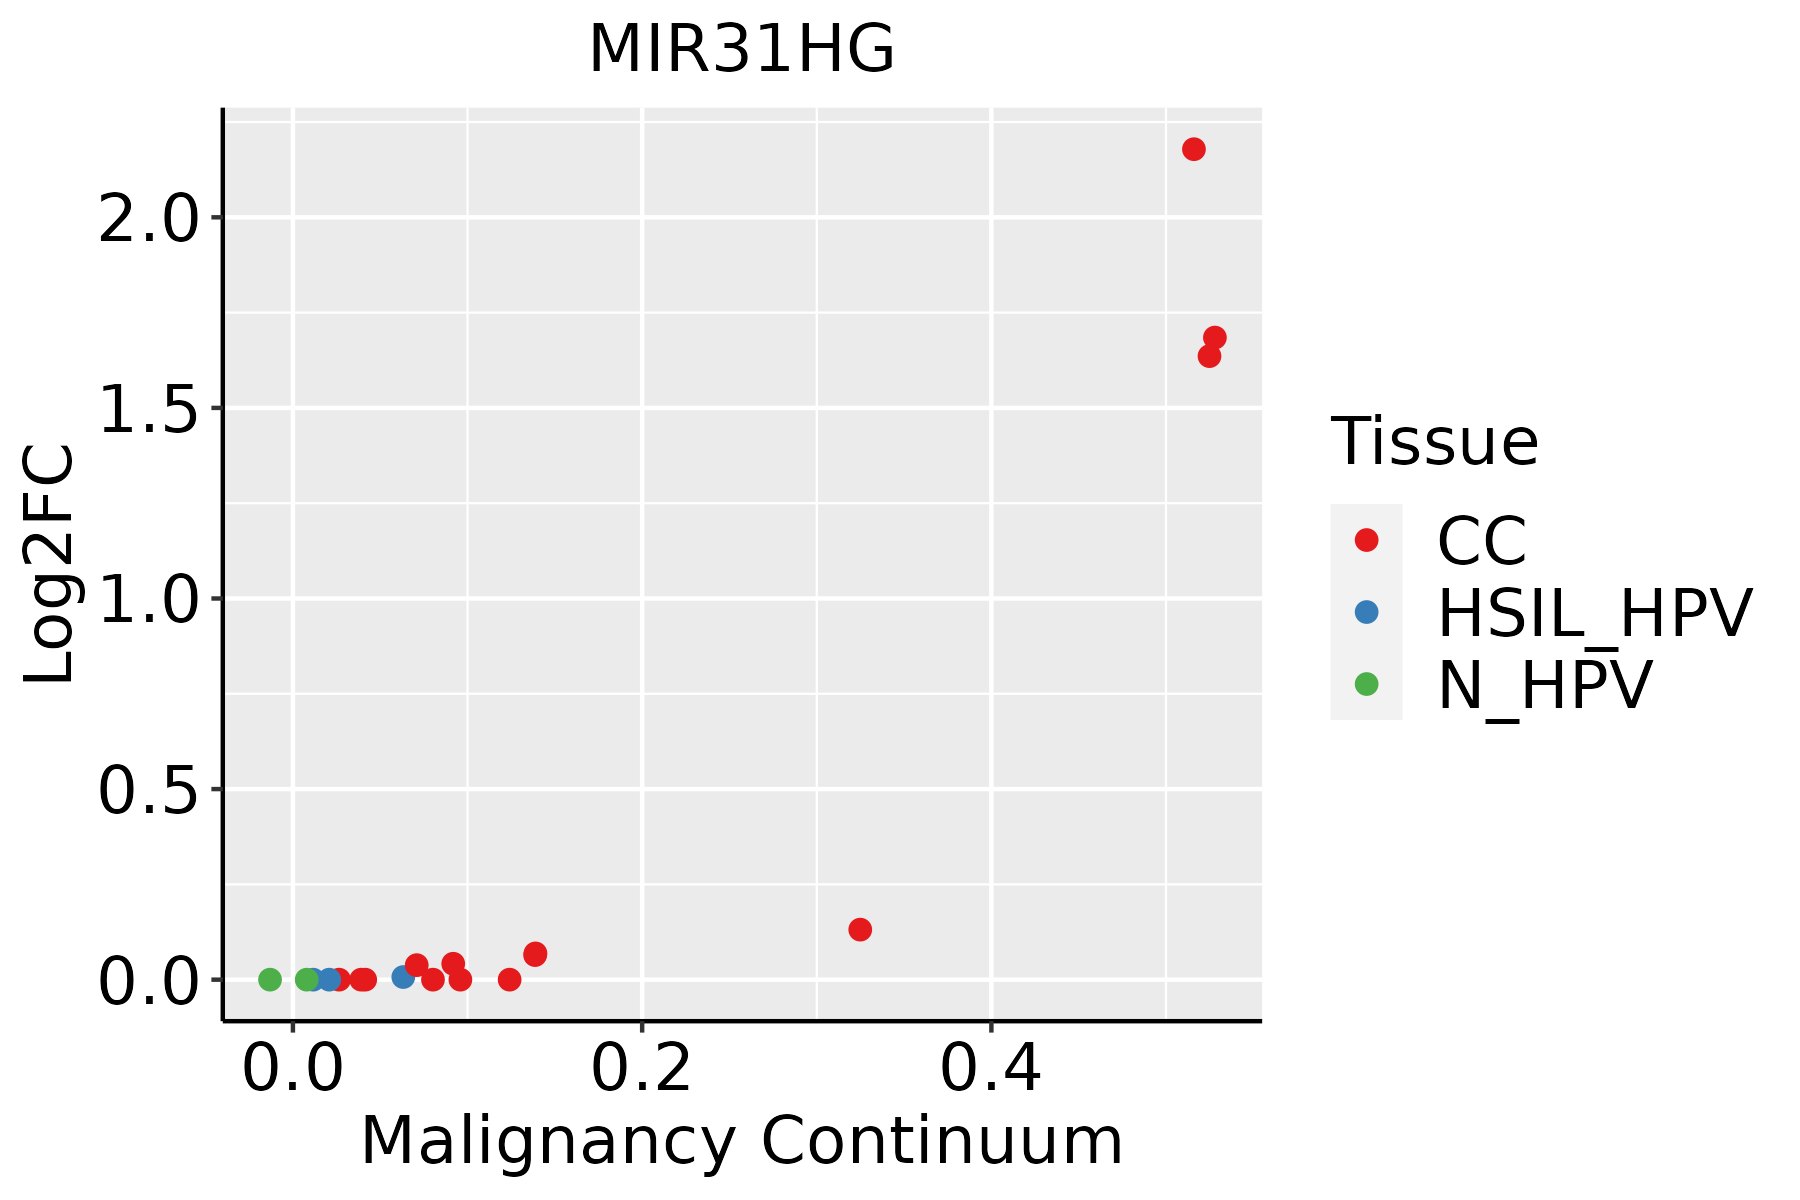 | CC: Cervix cancer |
| HSIL_HPV: HPV-infected high-grade squamous intraepithelial lesions | ||
| N_HPV: HPV-infected normal cervix | ||
| Endometrium | 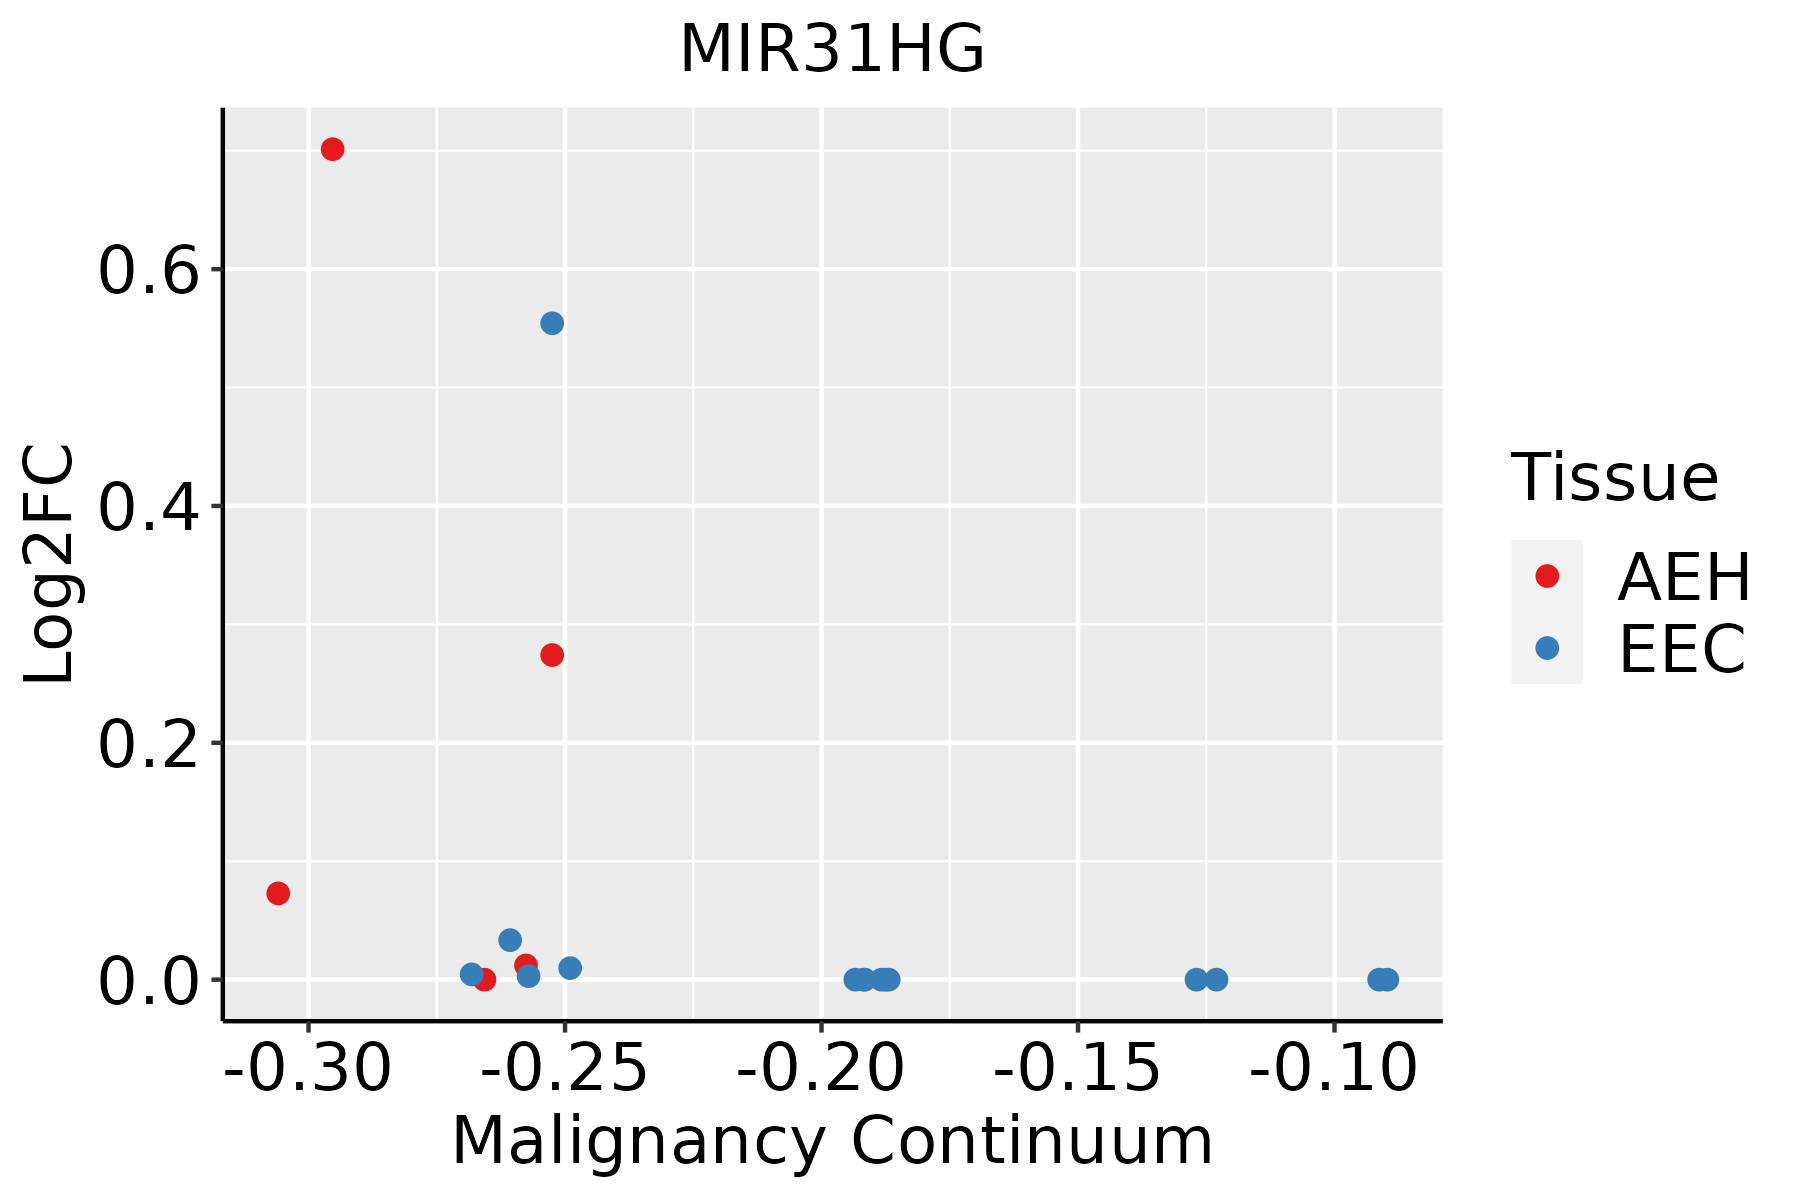 | AEH: Atypical endometrial hyperplasia |
| EEC: Endometrioid Cancer | ||
| Prostate | 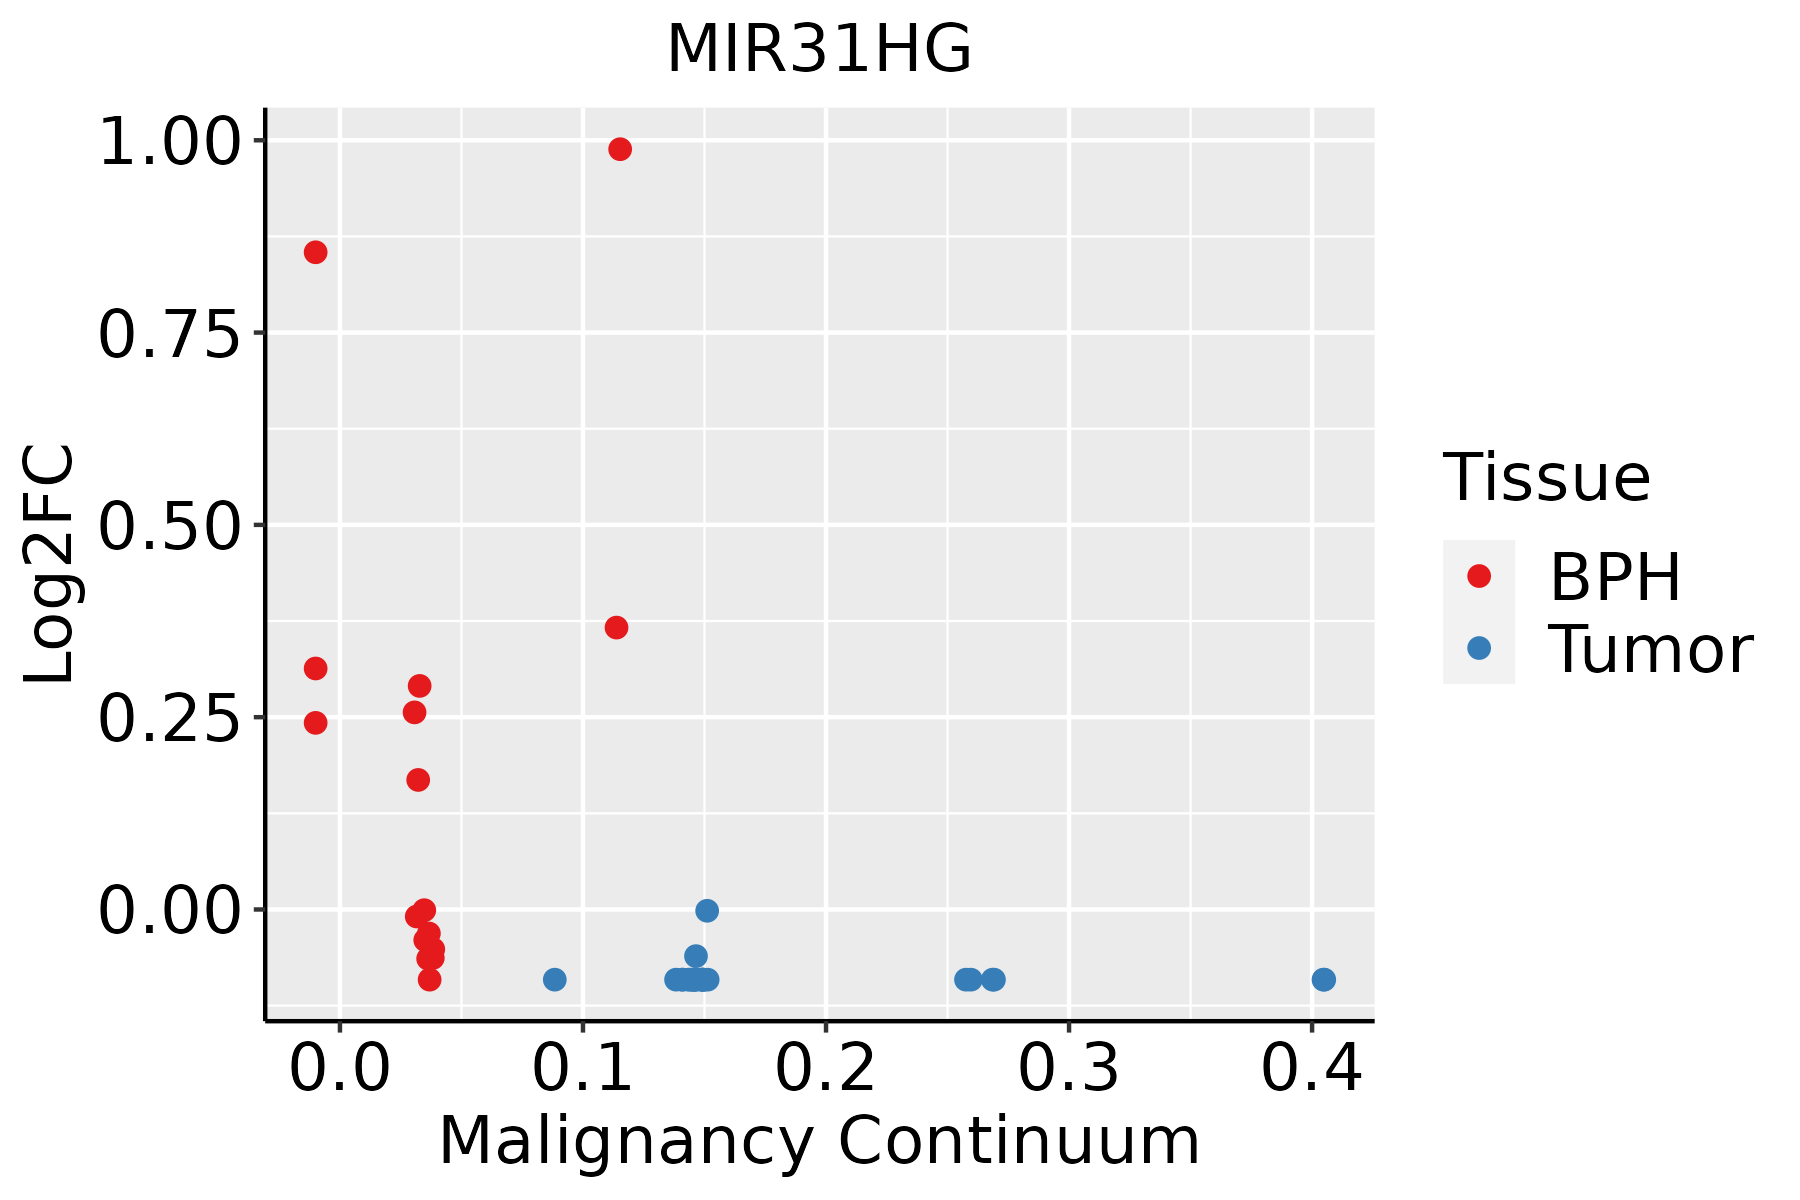 | BPH: Benign Prostatic Hyperplasia |
| Skin |  | AK: Actinic keratosis |
| cSCC: Cutaneous squamous cell carcinoma | ||
| SCCIS:squamous cell carcinoma in situ |
| ∗log2FC in expression of this searched gene in stem-like cells from each diseased tissue sample relative to stem-like cells in normal samples in each tissue plotted against the malignancy continuum. Samples are colored based on if they are from different disease stage. |
Top |
Malignant transformation related pathway analysis |
| Find out the enriched GO biological processes and KEGG pathways involved in transition from healthy to precancer to cancer |
| Tissue | Disease Stage | Enriched GO biological Processes |
| Colorectum | AD |  |
| Colorectum | SER |  |
| Colorectum | MSS |  |
| Colorectum | MSI-H |  |
| Colorectum | FAP |  |
| ∗Top 15 enriched GO BP terms are showed in the bar plot of each disease state in each tissue. Each row represents a significant GO biological process which is colored according to the -log10(p.adjust). |
| Page: 1 2 3 4 5 6 7 8 9 |
| GO ID | Tissue | Disease Stage | Description | Gene Ratio | Bg Ratio | pvalue | p.adjust | Count |
| Page: 1 |
| Pathway ID | Tissue | Disease Stage | Description | Gene Ratio | Bg Ratio | pvalue | p.adjust | qvalue | Count |
| Page: 1 |
Top |
Cell-cell communication analysis |
| Identification of potential cell-cell interactions between two cell types and their ligand-receptor pairs for different disease states |
| Ligand | Receptor | LRpair | Pathway | Tissue | Disease Stage |
| Page: 1 |
Top |
Single-cell gene regulatory network inference analysis |
| Find out the significant the regulons (TFs) and the target genes of each regulon across cell types for different disease states |
| TF | Cell Type | Tissue | Disease Stage | Target Gene | RSS | Regulon Activity |
| ∗The dot plots of a searched regulon are shown for all cell subpopulations in each disease state of each tissue based on the regulon specific score inferred using pySCENIC and by calculating the average expression. |
| Page: 1 |
Top |
Somatic mutation of malignant transformation related genes |
| Annotation of somatic variants for genes involved in malignant transformation |
| Hugo Symbol | Variant Class | Variant Classification | dbSNP RS | HGVSc | HGVSp | HGVSp Short | SWISSPROT | BIOTYPE | SIFT | PolyPhen | Tumor Sample Barcode | Tissue | Histology | Sex | Age | Stage | Therapy Types | Drugs | Outcome |
| Page: 1 |
Top |
Related drugs of malignant transformation related genes |
| Identification of chemicals and drugs interact with genes involved in malignant transfromation |
| (DGIdb 4.0) |
| Entrez ID | Symbol | Category | Interaction Types | Drug Claim Name | Drug Name | PMIDs |
| Page: 1 |

Copyright 2023-Present -The University of Texas Health Science Center at Houston |