
|
|||||
|
 | |
| |
| |
| |
| |
| |
|
Gene: MIR100HG |
Gene summary for MIR100HG |
| Gene information | Species | Human | Gene symbol | MIR100HG | Gene ID | 399959 |
| Gene name | mir-100-let-7a-2-mir-125b-1 cluster host gene | |
| Gene Alias | AGD1 | |
| Cytomap | 11q24.1 | |
| Gene Type | ncRNA | GO ID | NA | UniProtAcc | NA |
Top |
Malignant transformation analysis |
| Identification of the aberrant gene expression in precancerous and cancerous lesions by comparing the gene expression of stem-like cells in diseased tissues with normal stem cells |
| Entrez ID | Symbol | Replicates | Species | Organ | Tissue | Adj P-value | Log2FC | Malignancy |
| 399959 | MIR100HG | AEH-subject4 | Human | Endometrium | AEH | 2.09e-04 | 2.70e-01 | -0.2657 |
| 399959 | MIR100HG | EEC-subject1 | Human | Endometrium | EEC | 1.56e-02 | 1.12e-01 | -0.2682 |
| 399959 | MIR100HG | RNA-P23T2-P23T2-1 | Human | Lung | MIAC | 5.81e-04 | 1.03e+00 | -0.037 |
| 399959 | MIR100HG | RNA-P3T-P3T-1 | Human | Lung | IAC | 1.72e-16 | 1.14e+00 | 0.1829 |
| 399959 | MIR100HG | RNA-P3T-P3T-2 | Human | Lung | IAC | 9.59e-18 | 1.19e+00 | 0.1835 |
| 399959 | MIR100HG | RNA-P3T-P3T-4 | Human | Lung | IAC | 1.76e-19 | 1.16e+00 | 0.1859 |
| 399959 | MIR100HG | RNA-P7T1-P7T1-1 | Human | Lung | AIS | 3.65e-06 | 8.09e-01 | -0.0961 |
| 399959 | MIR100HG | RNA-P7T1-P7T1-2 | Human | Lung | AIS | 1.65e-06 | 7.86e-01 | -0.0876 |
| 399959 | MIR100HG | RNA-P7T1-P7T1-3 | Human | Lung | AIS | 1.18e-04 | 7.86e-01 | -0.0822 |
| 399959 | MIR100HG | RNA-P7T1-P7T1-4 | Human | Lung | AIS | 3.48e-07 | 7.61e-01 | -0.0809 |
| 399959 | MIR100HG | HTA12-23-1 | Human | Pancreas | PDAC | 9.17e-05 | 6.44e-01 | 0.3405 |
| 399959 | MIR100HG | HTA12-25-1 | Human | Pancreas | PDAC | 3.44e-03 | 4.44e-01 | 0.313 |
| 399959 | MIR100HG | HTA12-26-1 | Human | Pancreas | PDAC | 2.16e-11 | 6.39e-01 | 0.3728 |
| 399959 | MIR100HG | HTA12-29-1 | Human | Pancreas | PDAC | 5.86e-16 | 4.71e-01 | 0.3722 |
| 399959 | MIR100HG | GSM5252128_BPH327PrGF_Via | Human | Prostate | BPH | 5.74e-29 | 7.98e-01 | -0.1688 |
| 399959 | MIR100HG | GSM5252130_BPH340PrGF_Via | Human | Prostate | BPH | 4.23e-30 | 1.21e+00 | -0.1972 |
| 399959 | MIR100HG | GSM5252131_BPH340PrSF_Via | Human | Prostate | BPH | 1.85e-13 | 5.91e-01 | -0.2126 |
| 399959 | MIR100HG | GSM5252132_BPH389PrGF | Human | Prostate | BPH | 3.32e-21 | 1.40e+00 | -0.2247 |
| 399959 | MIR100HG | GSM5252134_BPH511PrG_Fcol_3GEX | Human | Prostate | BPH | 1.13e-08 | 6.48e-01 | -0.1433 |
| 399959 | MIR100HG | GSM5252136_BPH556PrGA1_Fcol | Human | Prostate | BPH | 1.79e-12 | 5.33e-01 | -0.23 |
| Page: 1 2 |
| Tissue | Expression Dynamics | Abbreviation |
| Endometrium |  | AEH: Atypical endometrial hyperplasia |
| EEC: Endometrioid Cancer | ||
| Lung | 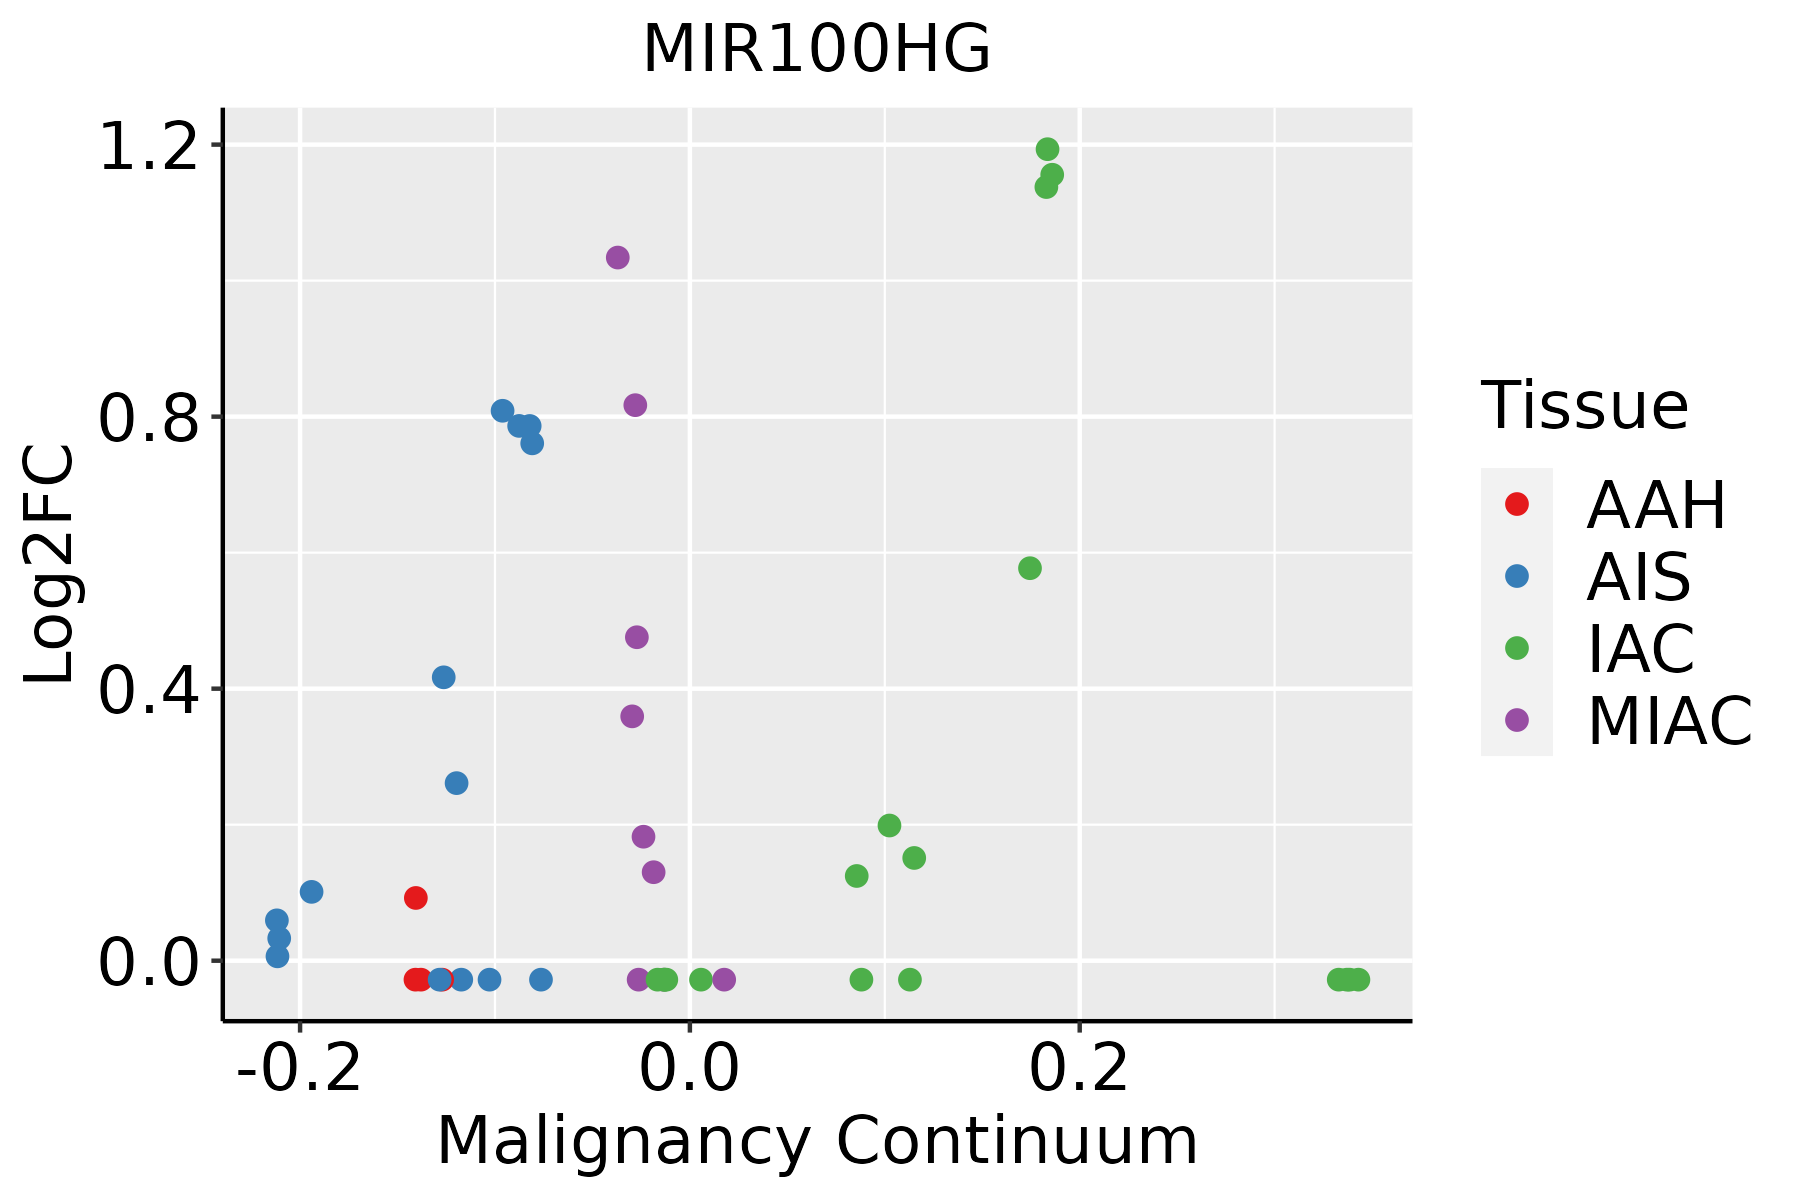 | AAH: Atypical adenomatous hyperplasia |
| AIS: Adenocarcinoma in situ | ||
| IAC: Invasive lung adenocarcinoma | ||
| MIA: Minimally invasive adenocarcinoma | ||
| Prostate | 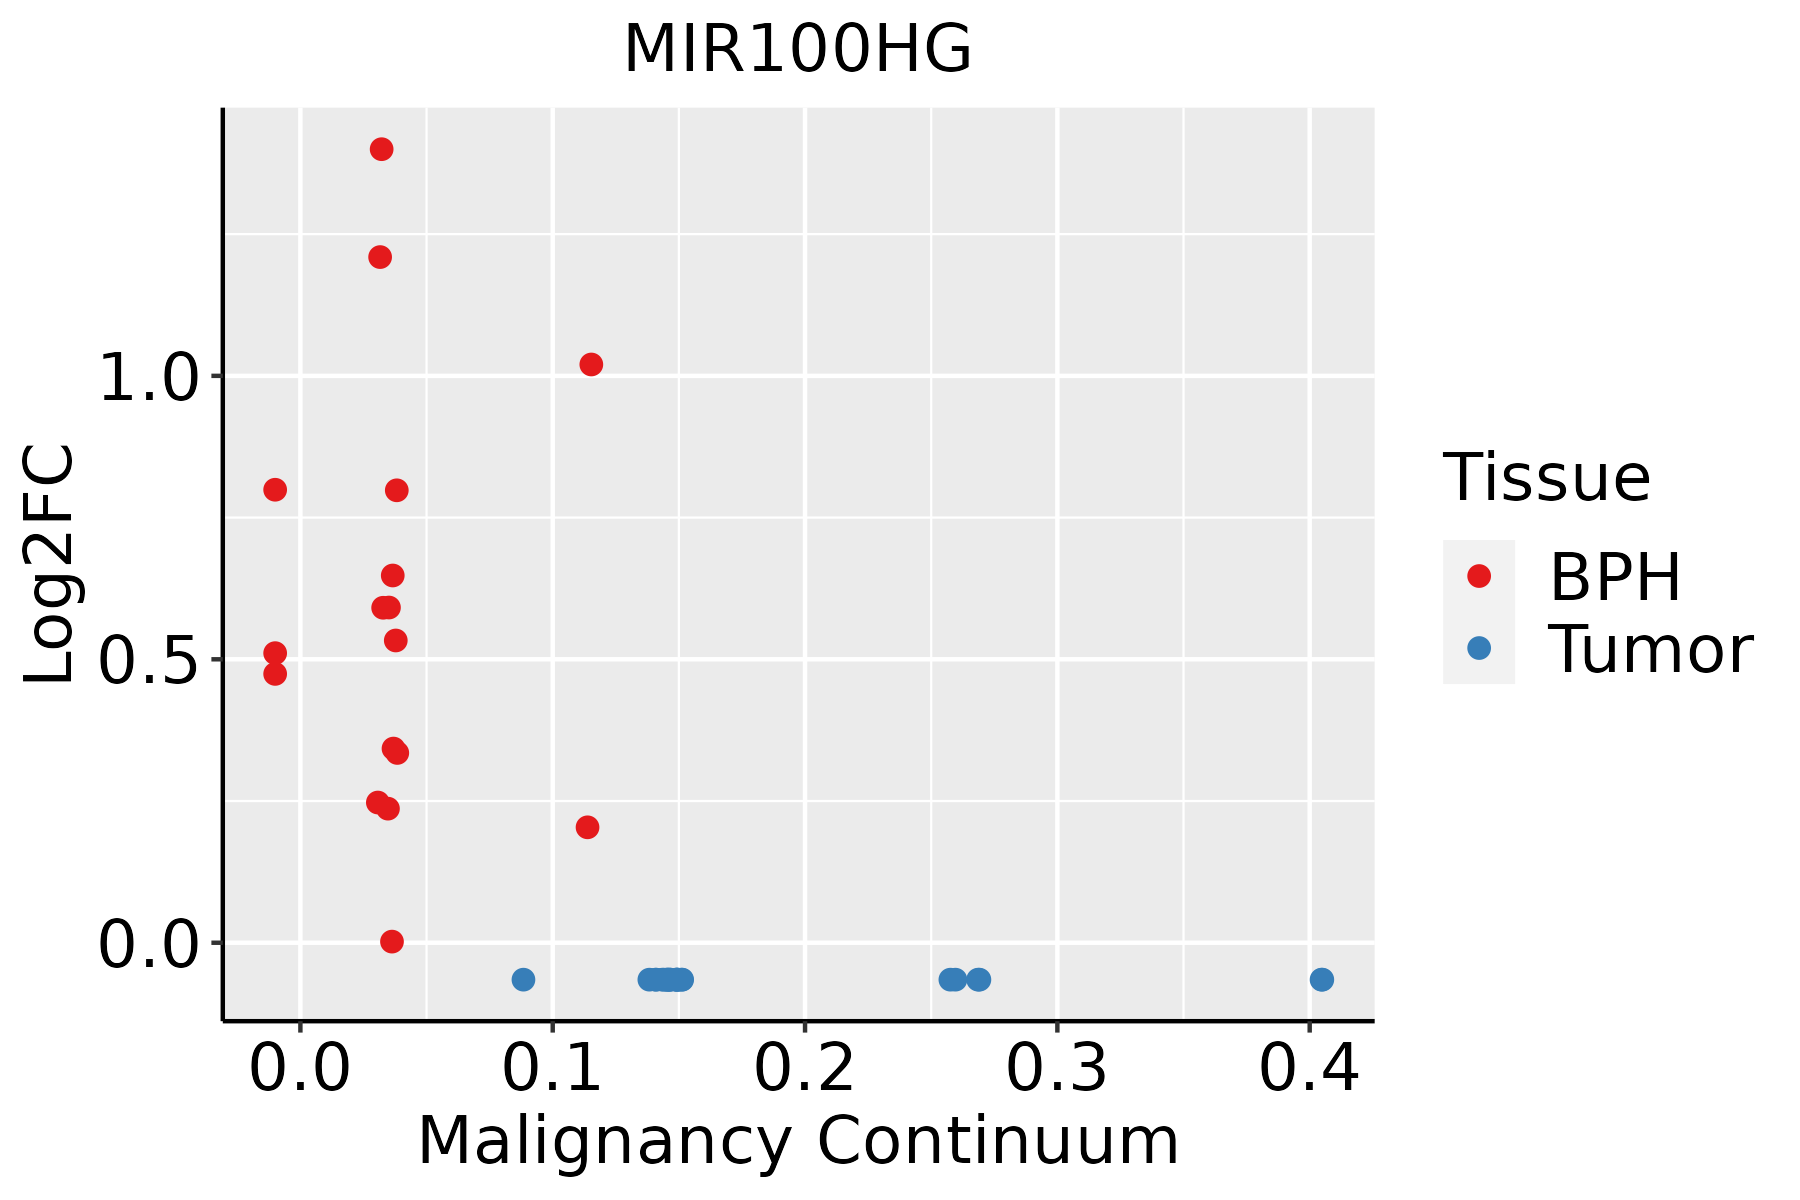 | BPH: Benign Prostatic Hyperplasia |
| ∗log2FC in expression of this searched gene in stem-like cells from each diseased tissue sample relative to stem-like cells in normal samples in each tissue plotted against the malignancy continuum. Samples are colored based on if they are from different disease stage. |
Top |
Malignant transformation related pathway analysis |
| Find out the enriched GO biological processes and KEGG pathways involved in transition from healthy to precancer to cancer |
| Tissue | Disease Stage | Enriched GO biological Processes |
| Colorectum | AD |  |
| Colorectum | SER |  |
| Colorectum | MSS |  |
| Colorectum | MSI-H |  |
| Colorectum | FAP |  |
| ∗Top 15 enriched GO BP terms are showed in the bar plot of each disease state in each tissue. Each row represents a significant GO biological process which is colored according to the -log10(p.adjust). |
| Page: 1 2 3 4 5 6 7 8 9 |
| GO ID | Tissue | Disease Stage | Description | Gene Ratio | Bg Ratio | pvalue | p.adjust | Count |
| Page: 1 |
| Pathway ID | Tissue | Disease Stage | Description | Gene Ratio | Bg Ratio | pvalue | p.adjust | qvalue | Count |
| Page: 1 |
Top |
Cell-cell communication analysis |
| Identification of potential cell-cell interactions between two cell types and their ligand-receptor pairs for different disease states |
| Ligand | Receptor | LRpair | Pathway | Tissue | Disease Stage |
| Page: 1 |
Top |
Single-cell gene regulatory network inference analysis |
| Find out the significant the regulons (TFs) and the target genes of each regulon across cell types for different disease states |
| TF | Cell Type | Tissue | Disease Stage | Target Gene | RSS | Regulon Activity |
| ∗The dot plots of a searched regulon are shown for all cell subpopulations in each disease state of each tissue based on the regulon specific score inferred using pySCENIC and by calculating the average expression. |
| Page: 1 |
Top |
Somatic mutation of malignant transformation related genes |
| Annotation of somatic variants for genes involved in malignant transformation |
| Hugo Symbol | Variant Class | Variant Classification | dbSNP RS | HGVSc | HGVSp | HGVSp Short | SWISSPROT | BIOTYPE | SIFT | PolyPhen | Tumor Sample Barcode | Tissue | Histology | Sex | Age | Stage | Therapy Types | Drugs | Outcome |
| Page: 1 |
Top |
Related drugs of malignant transformation related genes |
| Identification of chemicals and drugs interact with genes involved in malignant transfromation |
| (DGIdb 4.0) |
| Entrez ID | Symbol | Category | Interaction Types | Drug Claim Name | Drug Name | PMIDs |
| Page: 1 |

Copyright 2023-Present -The University of Texas Health Science Center at Houston |