
|
|||||
|
 | |
| |
| |
| |
| |
| |
|
Gene: MIPEP |
Gene summary for MIPEP |
| Gene information | Species | Human | Gene symbol | MIPEP | Gene ID | 4285 |
| Gene name | mitochondrial intermediate peptidase | |
| Gene Alias | COXPD31 | |
| Cytomap | 13q12.12 | |
| Gene Type | protein-coding | GO ID | GO:0006508 | UniProtAcc | Q99797 |
Top |
Malignant transformation analysis |
| Identification of the aberrant gene expression in precancerous and cancerous lesions by comparing the gene expression of stem-like cells in diseased tissues with normal stem cells |
| Entrez ID | Symbol | Replicates | Species | Organ | Tissue | Adj P-value | Log2FC | Malignancy |
| 4285 | MIPEP | LZE24T | Human | Esophagus | ESCC | 2.20e-03 | 8.21e-02 | 0.0596 |
| 4285 | MIPEP | P2T-E | Human | Esophagus | ESCC | 8.53e-13 | 2.69e-01 | 0.1177 |
| 4285 | MIPEP | P4T-E | Human | Esophagus | ESCC | 8.25e-09 | 2.07e-01 | 0.1323 |
| 4285 | MIPEP | P8T-E | Human | Esophagus | ESCC | 7.51e-04 | 1.13e-01 | 0.0889 |
| 4285 | MIPEP | P10T-E | Human | Esophagus | ESCC | 2.23e-04 | 9.82e-02 | 0.116 |
| 4285 | MIPEP | P11T-E | Human | Esophagus | ESCC | 1.73e-05 | 1.98e-01 | 0.1426 |
| 4285 | MIPEP | P15T-E | Human | Esophagus | ESCC | 4.76e-03 | 3.38e-02 | 0.1149 |
| 4285 | MIPEP | P16T-E | Human | Esophagus | ESCC | 7.23e-09 | 2.08e-01 | 0.1153 |
| 4285 | MIPEP | P21T-E | Human | Esophagus | ESCC | 2.39e-10 | 1.87e-01 | 0.1617 |
| 4285 | MIPEP | P22T-E | Human | Esophagus | ESCC | 6.91e-04 | 8.71e-02 | 0.1236 |
| 4285 | MIPEP | P23T-E | Human | Esophagus | ESCC | 1.28e-12 | 1.54e-01 | 0.108 |
| 4285 | MIPEP | P24T-E | Human | Esophagus | ESCC | 3.99e-03 | 9.61e-02 | 0.1287 |
| 4285 | MIPEP | P26T-E | Human | Esophagus | ESCC | 6.32e-09 | 1.57e-01 | 0.1276 |
| 4285 | MIPEP | P27T-E | Human | Esophagus | ESCC | 3.01e-07 | 1.88e-01 | 0.1055 |
| 4285 | MIPEP | P28T-E | Human | Esophagus | ESCC | 2.92e-04 | 3.87e-02 | 0.1149 |
| 4285 | MIPEP | P30T-E | Human | Esophagus | ESCC | 3.55e-06 | 2.90e-01 | 0.137 |
| 4285 | MIPEP | P31T-E | Human | Esophagus | ESCC | 3.24e-04 | 3.51e-02 | 0.1251 |
| 4285 | MIPEP | P32T-E | Human | Esophagus | ESCC | 7.80e-07 | 1.16e-01 | 0.1666 |
| 4285 | MIPEP | P36T-E | Human | Esophagus | ESCC | 1.55e-08 | 2.48e-01 | 0.1187 |
| 4285 | MIPEP | P37T-E | Human | Esophagus | ESCC | 6.01e-04 | 8.06e-02 | 0.1371 |
| Page: 1 2 3 |
| Tissue | Expression Dynamics | Abbreviation |
| Esophagus | 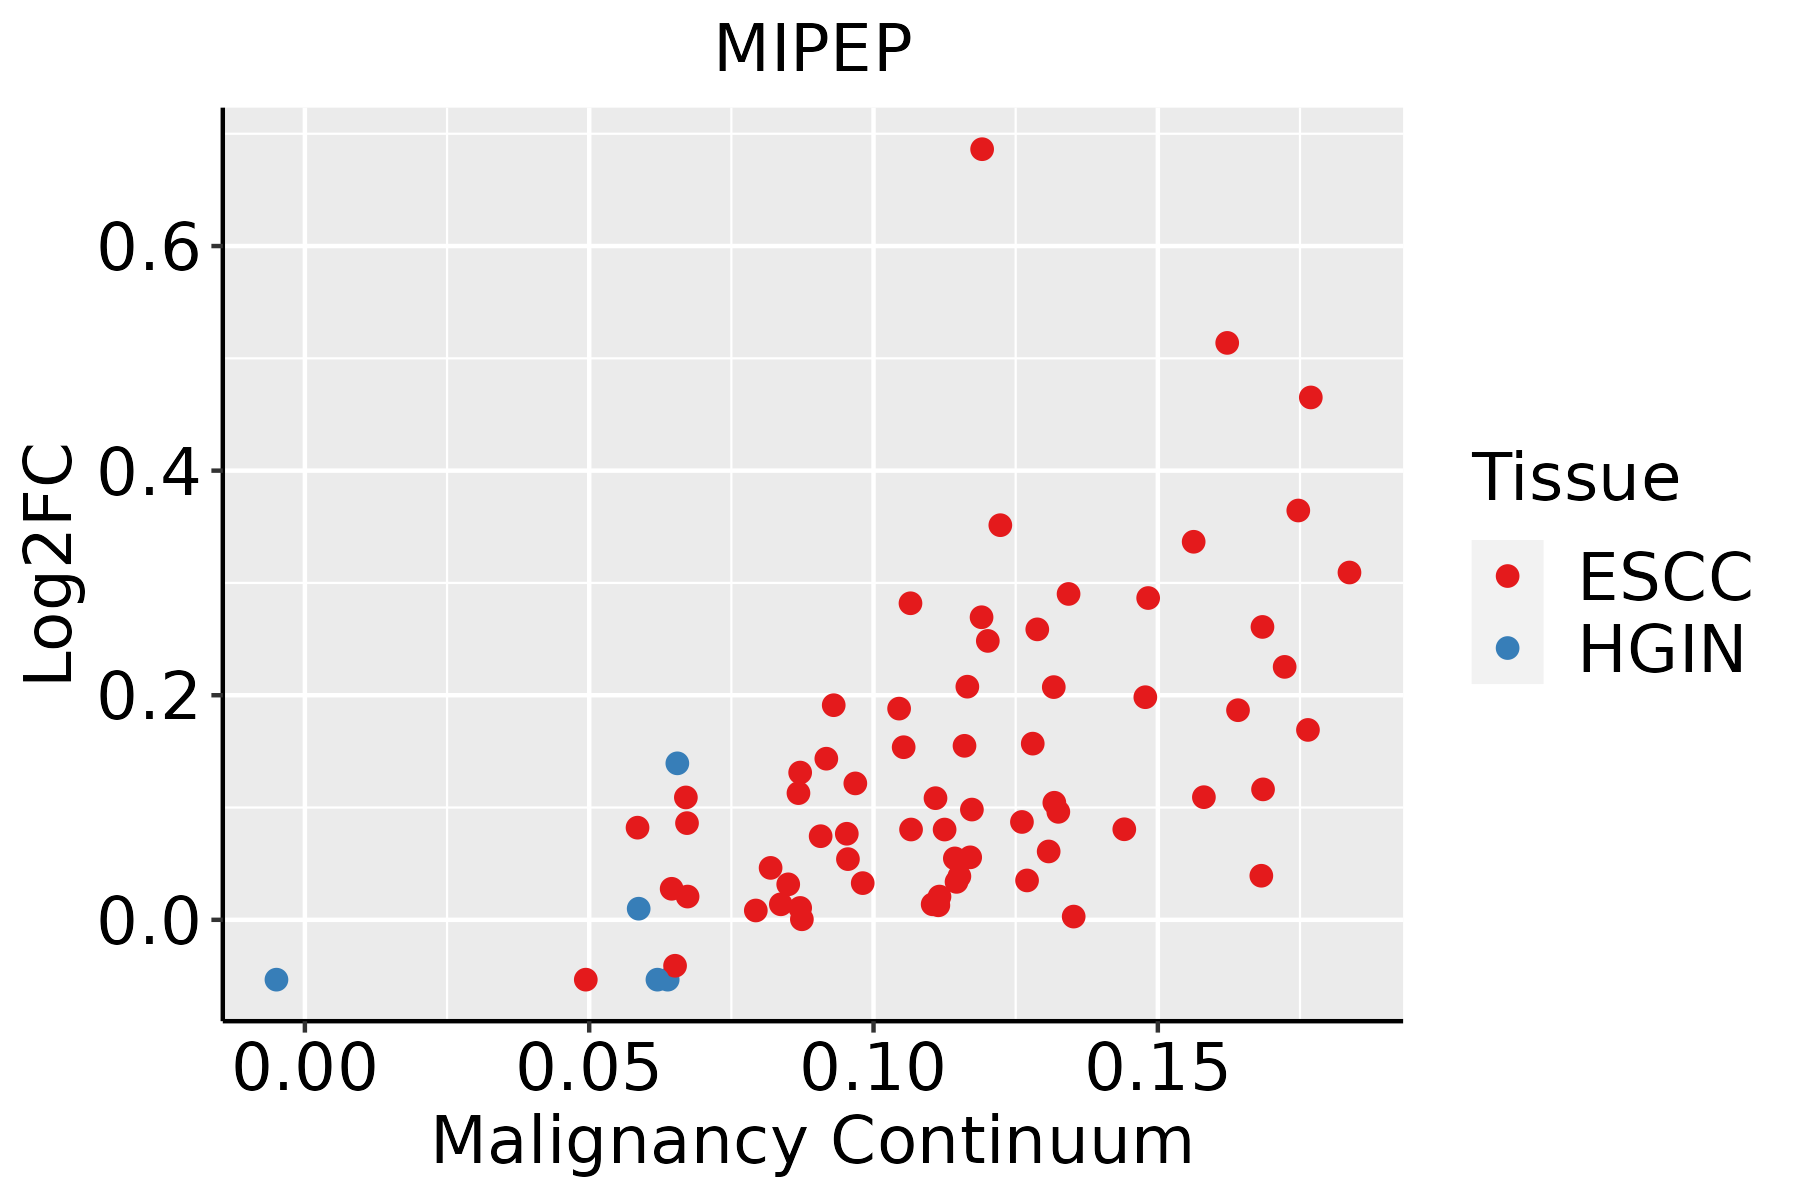 | ESCC: Esophageal squamous cell carcinoma |
| HGIN: High-grade intraepithelial neoplasias | ||
| LGIN: Low-grade intraepithelial neoplasias | ||
| Prostate | 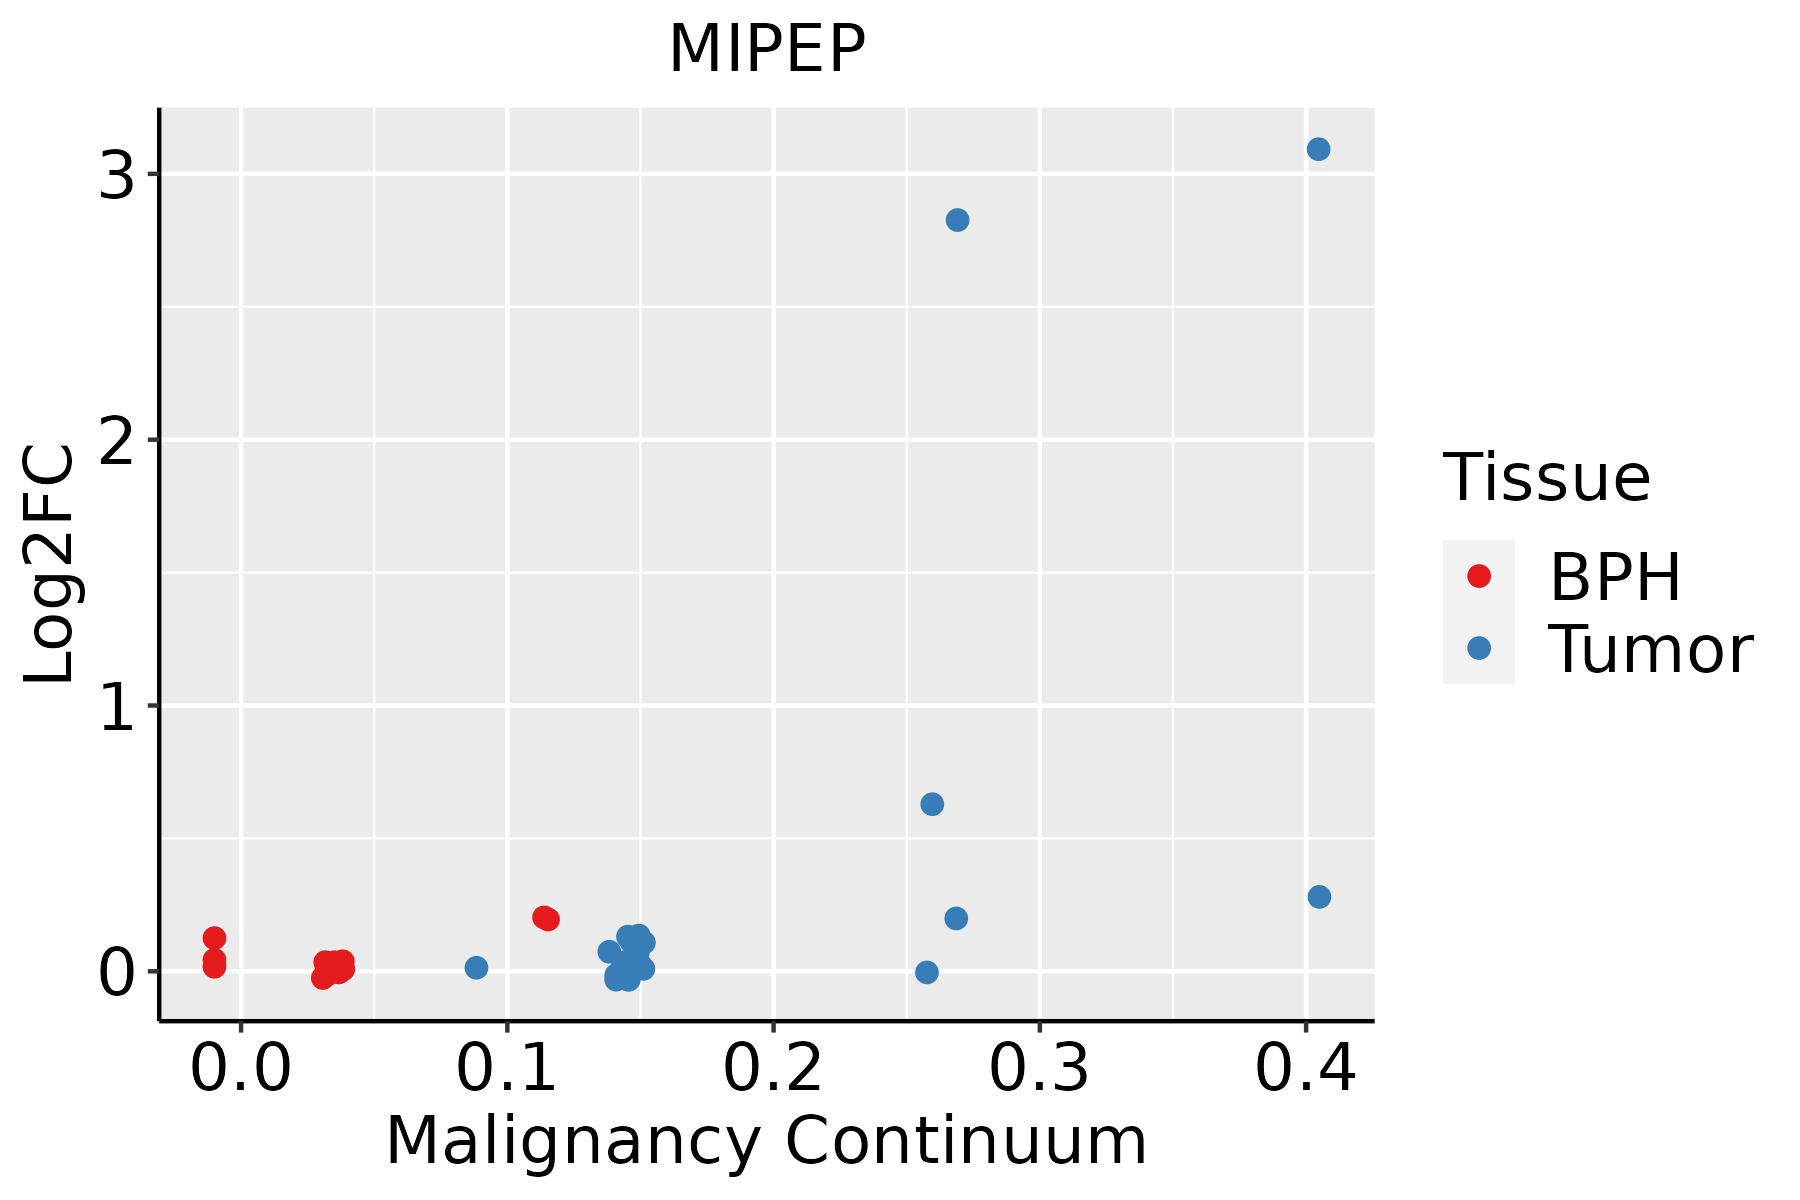 | BPH: Benign Prostatic Hyperplasia |
| Skin | 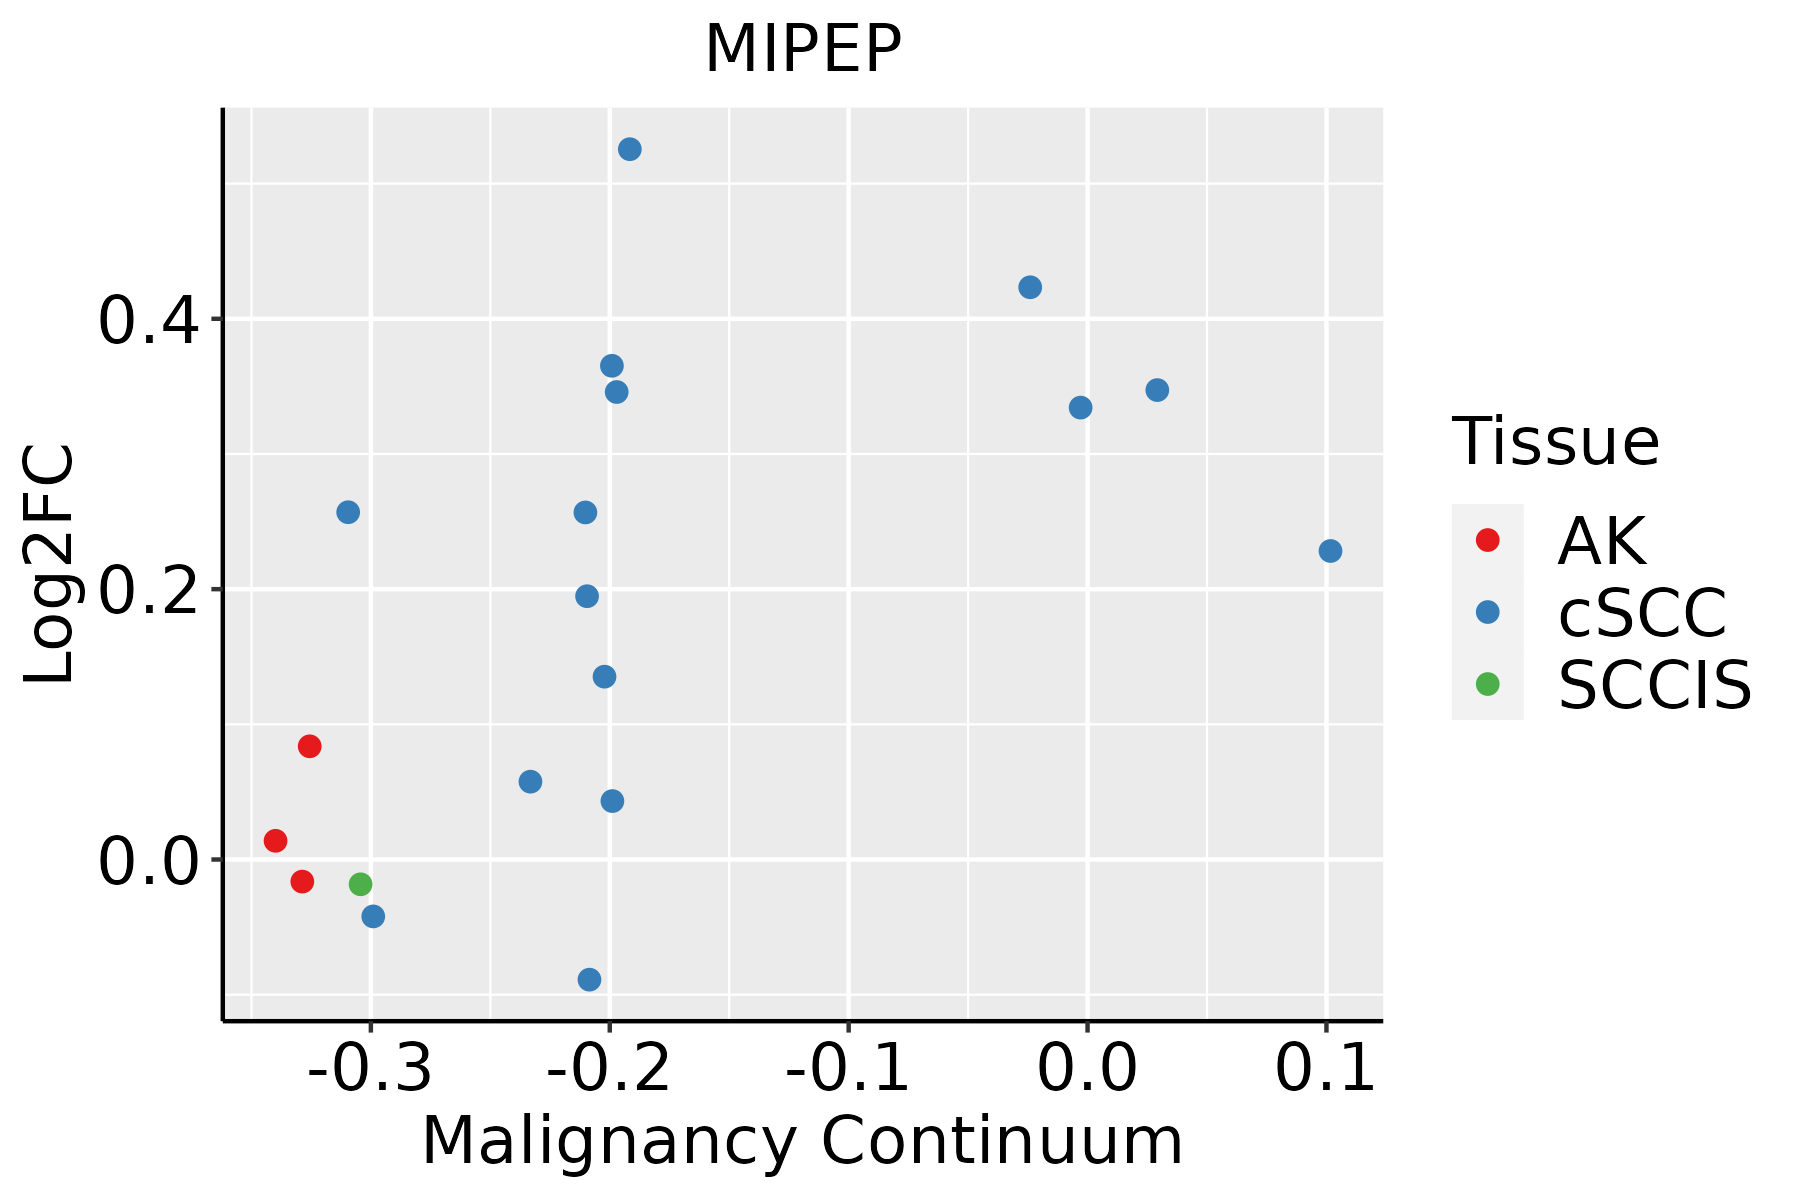 | AK: Actinic keratosis |
| cSCC: Cutaneous squamous cell carcinoma | ||
| SCCIS:squamous cell carcinoma in situ |
| ∗log2FC in expression of this searched gene in stem-like cells from each diseased tissue sample relative to stem-like cells in normal samples in each tissue plotted against the malignancy continuum. Samples are colored based on if they are from different disease stage. |
Top |
Malignant transformation related pathway analysis |
| Find out the enriched GO biological processes and KEGG pathways involved in transition from healthy to precancer to cancer |
| Tissue | Disease Stage | Enriched GO biological Processes |
| Colorectum | AD |  |
| Colorectum | SER |  |
| Colorectum | MSS |  |
| Colorectum | MSI-H |  |
| Colorectum | FAP |  |
| ∗Top 15 enriched GO BP terms are showed in the bar plot of each disease state in each tissue. Each row represents a significant GO biological process which is colored according to the -log10(p.adjust). |
| Page: 1 2 3 4 5 6 7 8 9 |
| GO ID | Tissue | Disease Stage | Description | Gene Ratio | Bg Ratio | pvalue | p.adjust | Count |
| GO:0072594110 | Esophagus | ESCC | establishment of protein localization to organelle | 311/8552 | 422/18723 | 3.02e-32 | 2.13e-29 | 311 |
| GO:0006605111 | Esophagus | ESCC | protein targeting | 229/8552 | 314/18723 | 4.93e-23 | 1.01e-20 | 229 |
| GO:0006839110 | Esophagus | ESCC | mitochondrial transport | 187/8552 | 254/18723 | 8.35e-20 | 9.81e-18 | 187 |
| GO:0072655110 | Esophagus | ESCC | establishment of protein localization to mitochondrion | 97/8552 | 120/18723 | 2.17e-15 | 1.33e-13 | 97 |
| GO:0070585110 | Esophagus | ESCC | protein localization to mitochondrion | 100/8552 | 125/18723 | 2.96e-15 | 1.77e-13 | 100 |
| GO:0006626110 | Esophagus | ESCC | protein targeting to mitochondrion | 81/8552 | 100/18723 | 3.60e-13 | 1.67e-11 | 81 |
| GO:005160418 | Esophagus | ESCC | protein maturation | 189/8552 | 294/18723 | 7.64e-11 | 2.39e-09 | 189 |
| GO:001648514 | Esophagus | ESCC | protein processing | 134/8552 | 225/18723 | 1.81e-05 | 1.60e-04 | 134 |
| GO:007259416 | Prostate | BPH | establishment of protein localization to organelle | 142/3107 | 422/18723 | 4.01e-18 | 1.31e-15 | 142 |
| GO:000660518 | Prostate | BPH | protein targeting | 102/3107 | 314/18723 | 2.51e-12 | 2.05e-10 | 102 |
| GO:000683916 | Prostate | BPH | mitochondrial transport | 79/3107 | 254/18723 | 6.77e-09 | 2.38e-07 | 79 |
| GO:007265516 | Prostate | BPH | establishment of protein localization to mitochondrion | 42/3107 | 120/18723 | 7.32e-07 | 1.39e-05 | 42 |
| GO:007058516 | Prostate | BPH | protein localization to mitochondrion | 43/3107 | 125/18723 | 9.29e-07 | 1.70e-05 | 43 |
| GO:00516049 | Prostate | BPH | protein maturation | 80/3107 | 294/18723 | 2.64e-06 | 4.23e-05 | 80 |
| GO:000662616 | Prostate | BPH | protein targeting to mitochondrion | 34/3107 | 100/18723 | 1.64e-05 | 2.05e-04 | 34 |
| GO:00164855 | Prostate | BPH | protein processing | 62/3107 | 225/18723 | 2.22e-05 | 2.67e-04 | 62 |
| GO:007259417 | Prostate | Tumor | establishment of protein localization to organelle | 151/3246 | 422/18723 | 3.19e-20 | 2.83e-17 | 151 |
| GO:000660519 | Prostate | Tumor | protein targeting | 109/3246 | 314/18723 | 6.11e-14 | 7.30e-12 | 109 |
| GO:000683917 | Prostate | Tumor | mitochondrial transport | 84/3246 | 254/18723 | 7.17e-10 | 3.57e-08 | 84 |
| GO:007058517 | Prostate | Tumor | protein localization to mitochondrion | 47/3246 | 125/18723 | 5.20e-08 | 1.58e-06 | 47 |
| Page: 1 2 |
| Pathway ID | Tissue | Disease Stage | Description | Gene Ratio | Bg Ratio | pvalue | p.adjust | qvalue | Count |
| Page: 1 |
Top |
Cell-cell communication analysis |
| Identification of potential cell-cell interactions between two cell types and their ligand-receptor pairs for different disease states |
| Ligand | Receptor | LRpair | Pathway | Tissue | Disease Stage |
| Page: 1 |
Top |
Single-cell gene regulatory network inference analysis |
| Find out the significant the regulons (TFs) and the target genes of each regulon across cell types for different disease states |
| TF | Cell Type | Tissue | Disease Stage | Target Gene | RSS | Regulon Activity |
| ∗The dot plots of a searched regulon are shown for all cell subpopulations in each disease state of each tissue based on the regulon specific score inferred using pySCENIC and by calculating the average expression. |
| Page: 1 |
Top |
Somatic mutation of malignant transformation related genes |
| Annotation of somatic variants for genes involved in malignant transformation |
| Hugo Symbol | Variant Class | Variant Classification | dbSNP RS | HGVSc | HGVSp | HGVSp Short | SWISSPROT | BIOTYPE | SIFT | PolyPhen | Tumor Sample Barcode | Tissue | Histology | Sex | Age | Stage | Therapy Types | Drugs | Outcome |
| MIPEP | SNV | Missense_Mutation | novel | c.1477N>G | p.Leu493Val | p.L493V | Q99797 | protein_coding | deleterious(0.04) | probably_damaging(0.919) | TCGA-A7-A4SE-01 | Breast | breast invasive carcinoma | Female | <65 | I/II | Chemotherapy | adriamycin | CR |
| MIPEP | SNV | Missense_Mutation | c.814N>A | p.Leu272Ile | p.L272I | Q99797 | protein_coding | deleterious(0.01) | possibly_damaging(0.864) | TCGA-AN-A046-01 | Breast | breast invasive carcinoma | Female | >=65 | I/II | Unknown | Unknown | SD | |
| MIPEP | SNV | Missense_Mutation | c.986C>T | p.Ser329Phe | p.S329F | Q99797 | protein_coding | tolerated(0.69) | benign(0.396) | TCGA-D8-A1JP-01 | Breast | breast invasive carcinoma | Female | >=65 | I/II | Hormone Therapy | tamoxiphen | SD | |
| MIPEP | SNV | Missense_Mutation | c.887N>A | p.Val296Glu | p.V296E | Q99797 | protein_coding | deleterious(0.01) | probably_damaging(0.954) | TCGA-D8-A1XQ-01 | Breast | breast invasive carcinoma | Female | >=65 | I/II | Unknown | Unknown | SD | |
| MIPEP | SNV | Missense_Mutation | novel | c.1703G>A | p.Cys568Tyr | p.C568Y | Q99797 | protein_coding | tolerated(0.34) | benign(0.216) | TCGA-2W-A8YY-01 | Cervix | cervical & endocervical cancer | Female | <65 | I/II | Chemotherapy | cisplatin | CR |
| MIPEP | SNV | Missense_Mutation | rs751340807 | c.791G>A | p.Arg264Gln | p.R264Q | Q99797 | protein_coding | deleterious(0) | probably_damaging(1) | TCGA-A6-6653-01 | Colorectum | colon adenocarcinoma | Male | >=65 | I/II | Unknown | Unknown | SD |
| MIPEP | SNV | Missense_Mutation | c.1357N>A | p.Arg453Ser | p.R453S | Q99797 | protein_coding | deleterious(0) | possibly_damaging(0.768) | TCGA-AA-A022-01 | Colorectum | colon adenocarcinoma | Female | >=65 | I/II | Unknown | Unknown | SD | |
| MIPEP | SNV | Missense_Mutation | rs765285559 | c.1876N>A | p.Val626Met | p.V626M | Q99797 | protein_coding | deleterious(0) | probably_damaging(0.984) | TCGA-AU-6004-01 | Colorectum | colon adenocarcinoma | Female | >=65 | I/II | Unknown | Unknown | SD |
| MIPEP | SNV | Missense_Mutation | rs749656281 | c.2116G>A | p.Glu706Lys | p.E706K | Q99797 | protein_coding | deleterious(0.01) | possibly_damaging(0.543) | TCGA-CK-5913-01 | Colorectum | colon adenocarcinoma | Female | <65 | I/II | Unknown | Unknown | SD |
| MIPEP | SNV | Missense_Mutation | rs746768958 | c.1991N>A | p.Arg664His | p.R664H | Q99797 | protein_coding | deleterious(0.01) | probably_damaging(0.988) | TCGA-CM-6680-01 | Colorectum | colon adenocarcinoma | Female | >=65 | III/IV | Unknown | Unknown | SD |
| Page: 1 2 3 4 5 6 7 |
Top |
Related drugs of malignant transformation related genes |
| Identification of chemicals and drugs interact with genes involved in malignant transfromation |
| (DGIdb 4.0) |
| Entrez ID | Symbol | Category | Interaction Types | Drug Claim Name | Drug Name | PMIDs |
| Page: 1 |

Copyright 2023-Present -The University of Texas Health Science Center at Houston |