
|
|||||
|
 | |
| |
| |
| |
| |
| |
|
Gene: MINPP1 |
Gene summary for MINPP1 |
| Gene information | Species | Human | Gene symbol | MINPP1 | Gene ID | 9562 |
| Gene name | multiple inositol-polyphosphate phosphatase 1 | |
| Gene Alias | HIPER1 | |
| Cytomap | 10q23.2 | |
| Gene Type | protein-coding | GO ID | GO:0001503 | UniProtAcc | Q9UNW1 |
Top |
Malignant transformation analysis |
| Identification of the aberrant gene expression in precancerous and cancerous lesions by comparing the gene expression of stem-like cells in diseased tissues with normal stem cells |
| Entrez ID | Symbol | Replicates | Species | Organ | Tissue | Adj P-value | Log2FC | Malignancy |
| 9562 | MINPP1 | LZE4T | Human | Esophagus | ESCC | 5.58e-05 | 1.73e-01 | 0.0811 |
| 9562 | MINPP1 | LZE8T | Human | Esophagus | ESCC | 1.07e-06 | 2.26e-01 | 0.067 |
| 9562 | MINPP1 | LZE24T | Human | Esophagus | ESCC | 1.52e-13 | 2.93e-01 | 0.0596 |
| 9562 | MINPP1 | LZE6T | Human | Esophagus | ESCC | 2.36e-02 | 2.47e-01 | 0.0845 |
| 9562 | MINPP1 | P2T-E | Human | Esophagus | ESCC | 6.93e-33 | 5.14e-01 | 0.1177 |
| 9562 | MINPP1 | P4T-E | Human | Esophagus | ESCC | 3.90e-19 | 4.48e-01 | 0.1323 |
| 9562 | MINPP1 | P5T-E | Human | Esophagus | ESCC | 7.30e-07 | 5.07e-02 | 0.1327 |
| 9562 | MINPP1 | P8T-E | Human | Esophagus | ESCC | 4.16e-09 | 2.09e-01 | 0.0889 |
| 9562 | MINPP1 | P9T-E | Human | Esophagus | ESCC | 1.02e-04 | 7.91e-02 | 0.1131 |
| 9562 | MINPP1 | P10T-E | Human | Esophagus | ESCC | 1.48e-11 | 1.81e-01 | 0.116 |
| 9562 | MINPP1 | P11T-E | Human | Esophagus | ESCC | 1.23e-10 | 5.69e-01 | 0.1426 |
| 9562 | MINPP1 | P12T-E | Human | Esophagus | ESCC | 1.32e-24 | 3.84e-01 | 0.1122 |
| 9562 | MINPP1 | P15T-E | Human | Esophagus | ESCC | 2.48e-10 | 2.14e-01 | 0.1149 |
| 9562 | MINPP1 | P16T-E | Human | Esophagus | ESCC | 9.55e-39 | 6.64e-01 | 0.1153 |
| 9562 | MINPP1 | P17T-E | Human | Esophagus | ESCC | 3.67e-02 | 2.20e-01 | 0.1278 |
| 9562 | MINPP1 | P20T-E | Human | Esophagus | ESCC | 6.94e-15 | 2.75e-01 | 0.1124 |
| 9562 | MINPP1 | P21T-E | Human | Esophagus | ESCC | 1.20e-16 | 2.34e-01 | 0.1617 |
| 9562 | MINPP1 | P22T-E | Human | Esophagus | ESCC | 5.85e-23 | 3.01e-01 | 0.1236 |
| 9562 | MINPP1 | P23T-E | Human | Esophagus | ESCC | 1.20e-19 | 3.94e-01 | 0.108 |
| 9562 | MINPP1 | P24T-E | Human | Esophagus | ESCC | 9.85e-19 | 2.62e-01 | 0.1287 |
| Page: 1 2 3 4 |
| Tissue | Expression Dynamics | Abbreviation |
| Esophagus | 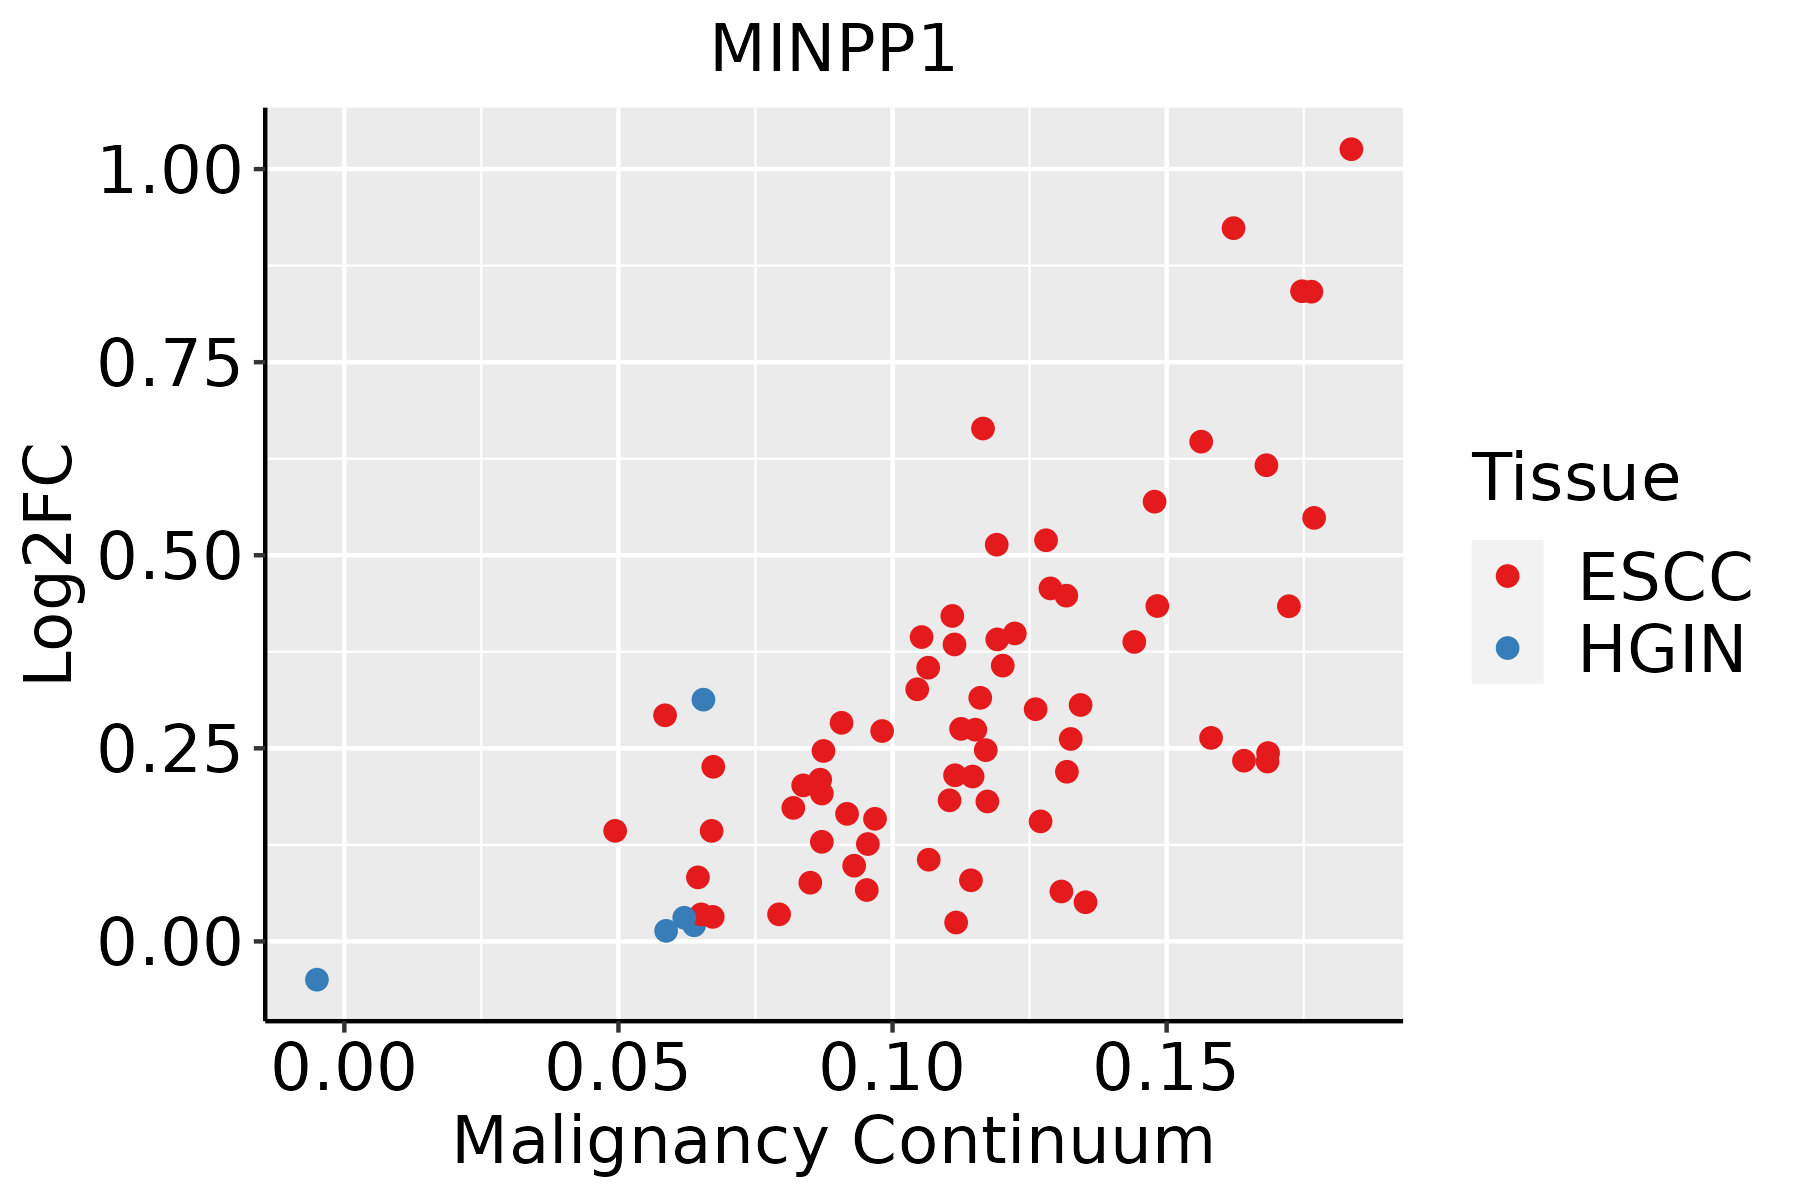 | ESCC: Esophageal squamous cell carcinoma |
| HGIN: High-grade intraepithelial neoplasias | ||
| LGIN: Low-grade intraepithelial neoplasias | ||
| Liver | 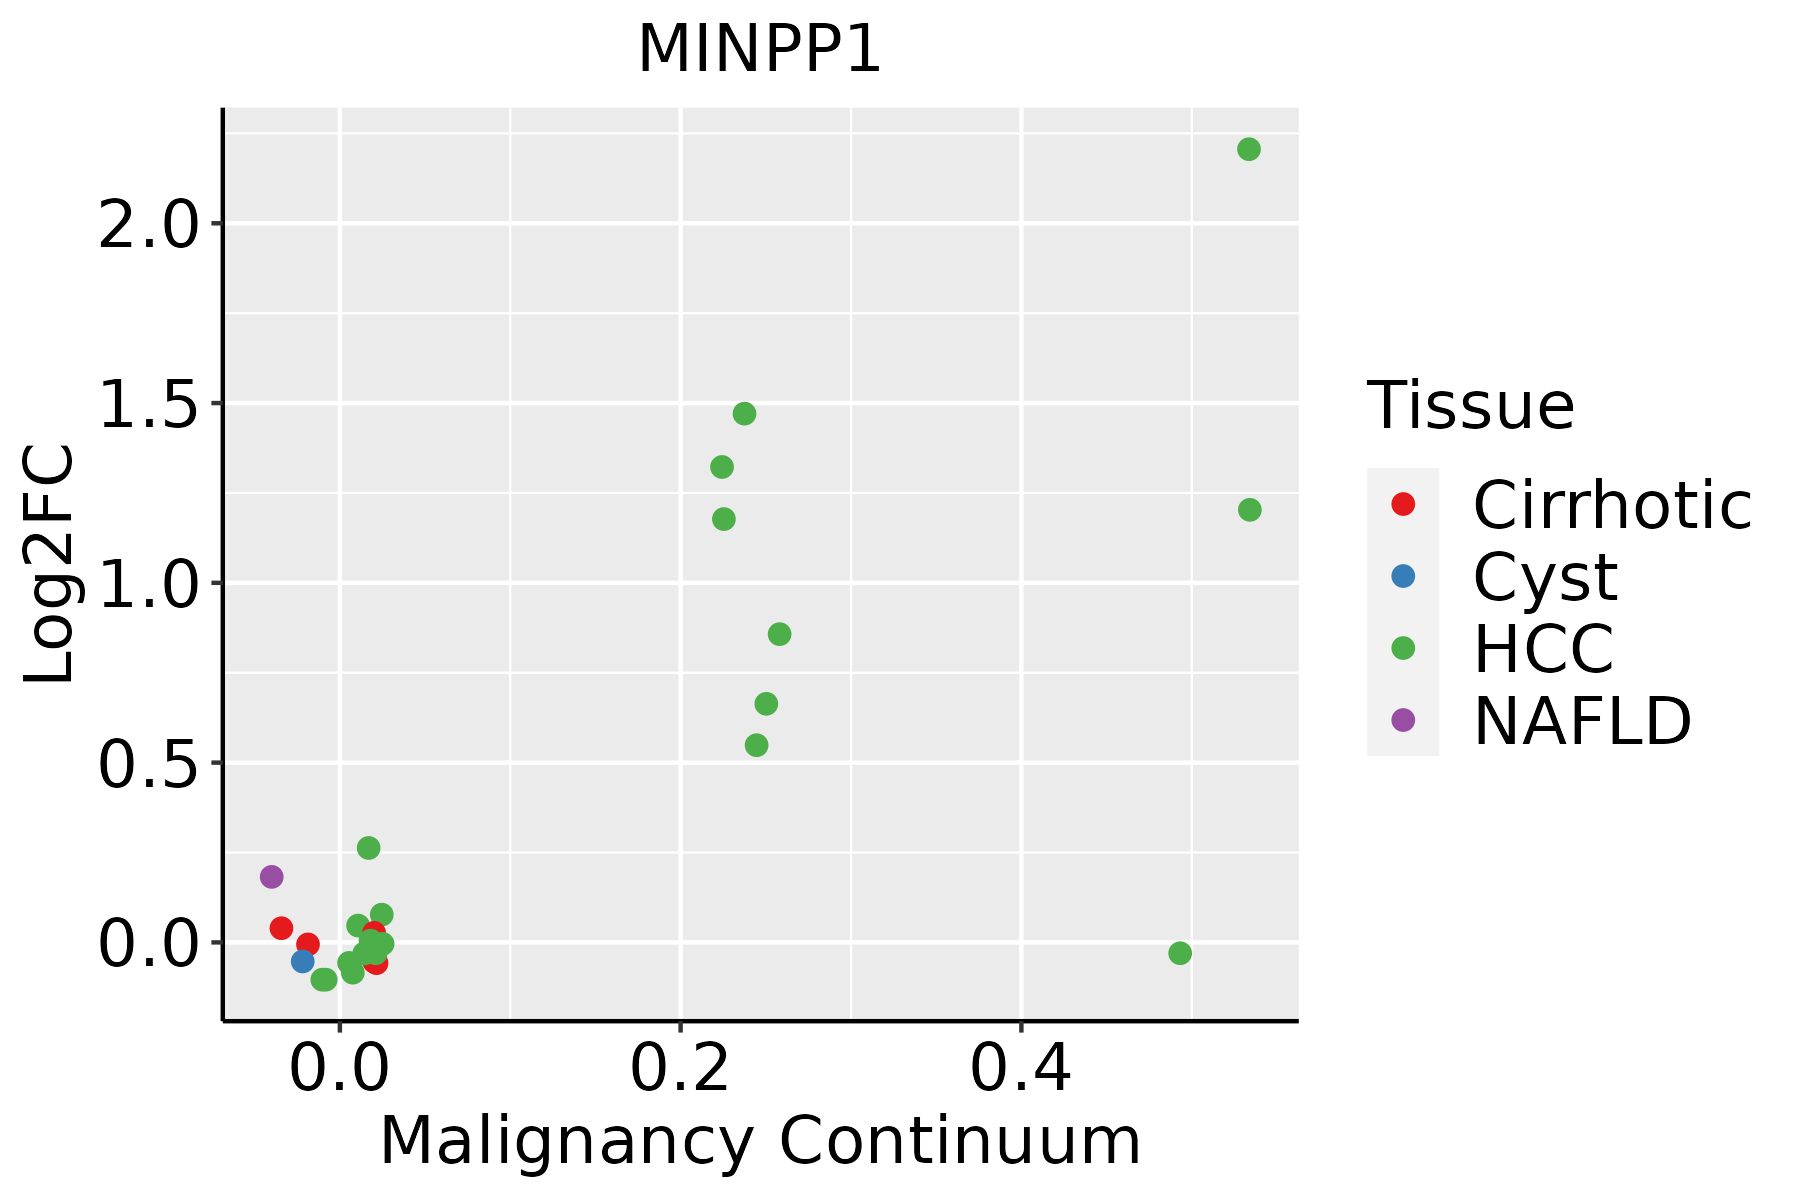 | HCC: Hepatocellular carcinoma |
| NAFLD: Non-alcoholic fatty liver disease | ||
| Oral Cavity | 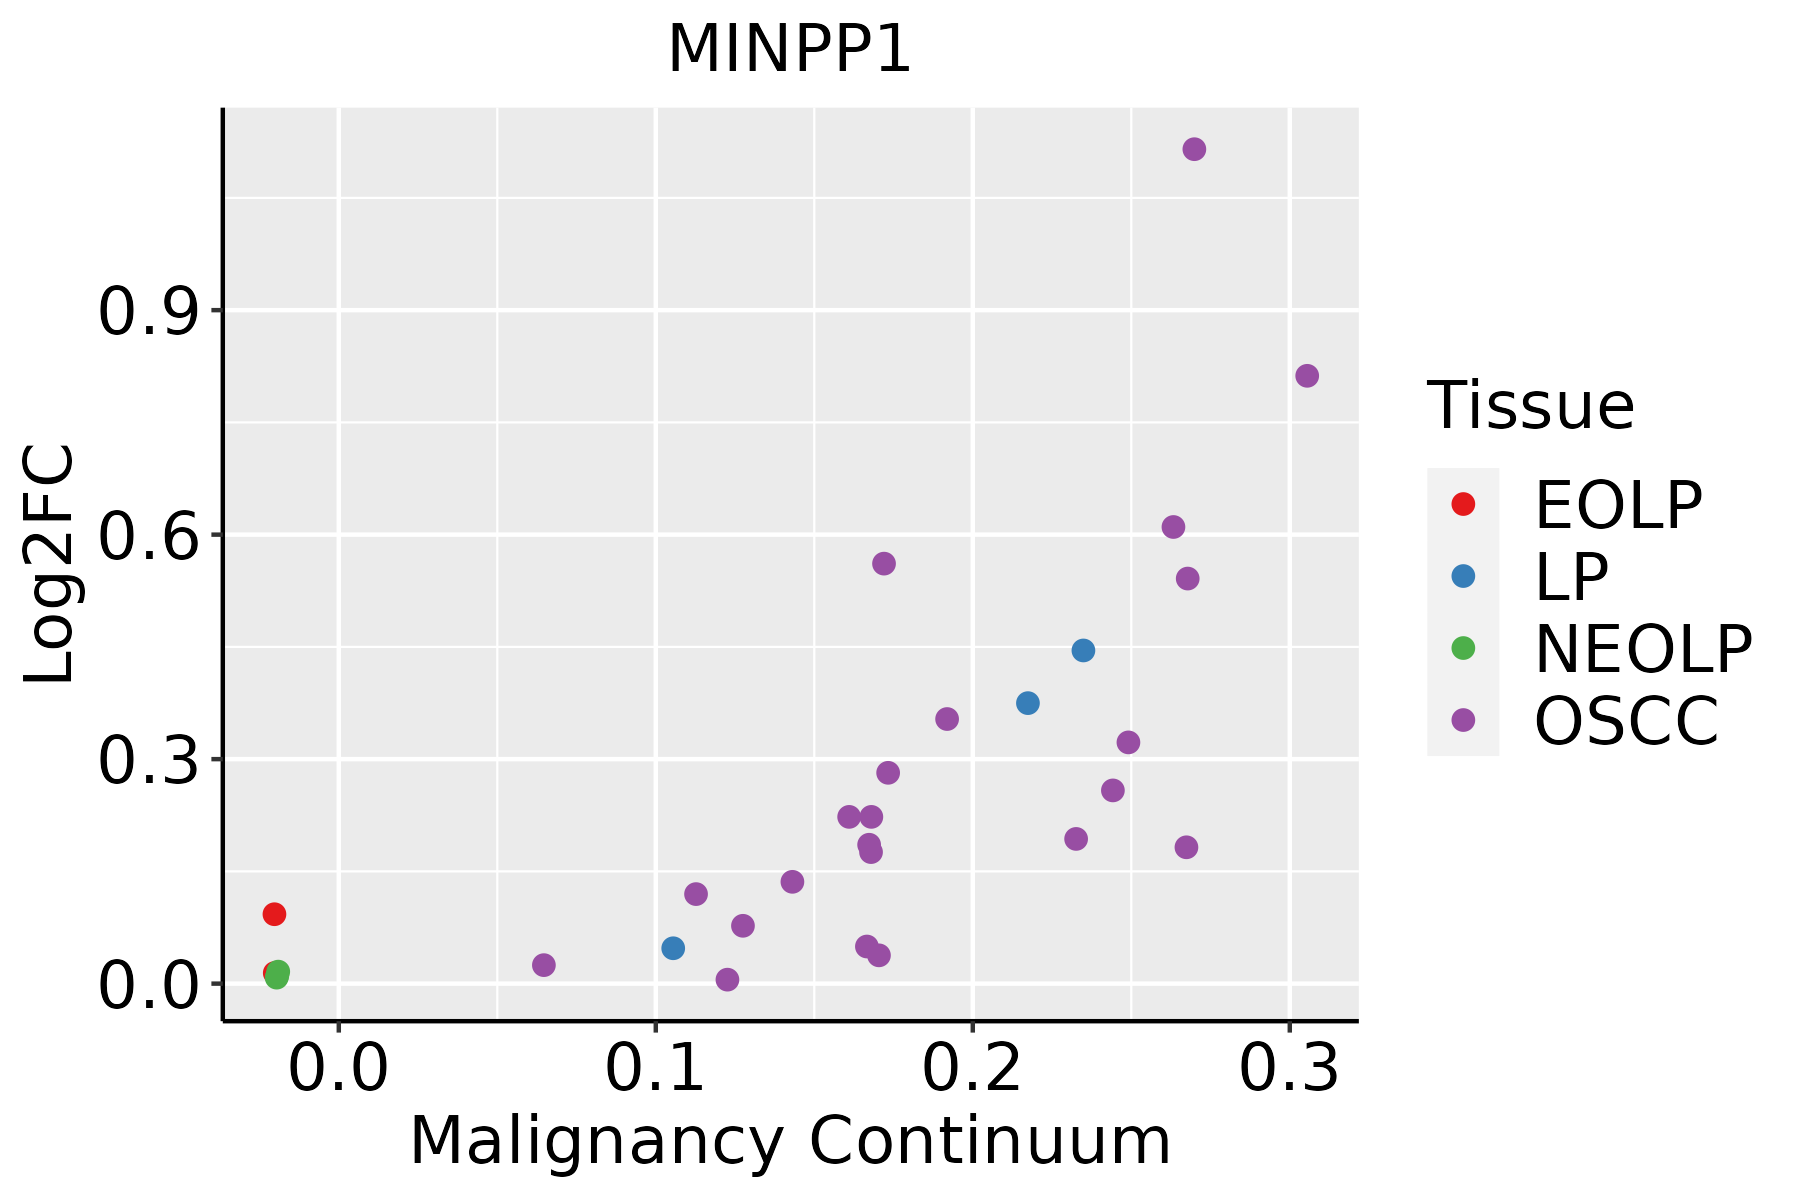 | EOLP: Erosive Oral lichen planus |
| LP: leukoplakia | ||
| NEOLP: Non-erosive oral lichen planus | ||
| OSCC: Oral squamous cell carcinoma |
| ∗log2FC in expression of this searched gene in stem-like cells from each diseased tissue sample relative to stem-like cells in normal samples in each tissue plotted against the malignancy continuum. Samples are colored based on if they are from different disease stage. |
Top |
Malignant transformation related pathway analysis |
| Find out the enriched GO biological processes and KEGG pathways involved in transition from healthy to precancer to cancer |
| Tissue | Disease Stage | Enriched GO biological Processes |
| Colorectum | AD |  |
| Colorectum | SER |  |
| Colorectum | MSS |  |
| Colorectum | MSI-H |  |
| Colorectum | FAP |  |
| ∗Top 15 enriched GO BP terms are showed in the bar plot of each disease state in each tissue. Each row represents a significant GO biological process which is colored according to the -log10(p.adjust). |
| Page: 1 2 3 4 5 6 7 8 9 |
| GO ID | Tissue | Disease Stage | Description | Gene Ratio | Bg Ratio | pvalue | p.adjust | Count |
| GO:001631110 | Esophagus | ESCC | dephosphorylation | 251/8552 | 417/18723 | 1.26e-09 | 2.99e-08 | 251 |
| GO:000647018 | Esophagus | ESCC | protein dephosphorylation | 177/8552 | 281/18723 | 3.13e-09 | 6.72e-08 | 177 |
| GO:000150317 | Esophagus | ESCC | ossification | 232/8552 | 408/18723 | 3.00e-06 | 3.40e-05 | 232 |
| GO:00060668 | Esophagus | ESCC | alcohol metabolic process | 202/8552 | 353/18723 | 7.32e-06 | 7.26e-05 | 202 |
| GO:000606621 | Liver | HCC | alcohol metabolic process | 208/7958 | 353/18723 | 2.80e-10 | 9.50e-09 | 208 |
| GO:001631121 | Liver | HCC | dephosphorylation | 230/7958 | 417/18723 | 1.00e-07 | 1.96e-06 | 230 |
| GO:000647021 | Liver | HCC | protein dephosphorylation | 162/7958 | 281/18723 | 1.91e-07 | 3.46e-06 | 162 |
| GO:000647015 | Oral cavity | OSCC | protein dephosphorylation | 162/7305 | 281/18723 | 1.56e-10 | 4.56e-09 | 162 |
| GO:00163119 | Oral cavity | OSCC | dephosphorylation | 220/7305 | 417/18723 | 6.33e-09 | 1.34e-07 | 220 |
| GO:00060667 | Oral cavity | OSCC | alcohol metabolic process | 179/7305 | 353/18723 | 4.54e-06 | 5.21e-05 | 179 |
| GO:000150310 | Oral cavity | OSCC | ossification | 203/7305 | 408/18723 | 5.54e-06 | 6.19e-05 | 203 |
| GO:000606613 | Oral cavity | LP | alcohol metabolic process | 111/4623 | 353/18723 | 2.24e-03 | 1.62e-02 | 111 |
| GO:000647016 | Oral cavity | LP | protein dephosphorylation | 89/4623 | 281/18723 | 4.60e-03 | 2.93e-02 | 89 |
| GO:000150315 | Oral cavity | LP | ossification | 123/4623 | 408/18723 | 6.55e-03 | 3.84e-02 | 123 |
| Page: 1 |
| Pathway ID | Tissue | Disease Stage | Description | Gene Ratio | Bg Ratio | pvalue | p.adjust | qvalue | Count |
| hsa0001016 | Esophagus | ESCC | Glycolysis / Gluconeogenesis | 42/4205 | 67/8465 | 2.15e-02 | 4.78e-02 | 2.45e-02 | 42 |
| hsa0001017 | Esophagus | ESCC | Glycolysis / Gluconeogenesis | 42/4205 | 67/8465 | 2.15e-02 | 4.78e-02 | 2.45e-02 | 42 |
| hsa0001022 | Liver | HCC | Glycolysis / Gluconeogenesis | 43/4020 | 67/8465 | 4.26e-03 | 1.29e-02 | 7.15e-03 | 43 |
| hsa0001032 | Liver | HCC | Glycolysis / Gluconeogenesis | 43/4020 | 67/8465 | 4.26e-03 | 1.29e-02 | 7.15e-03 | 43 |
| hsa0001014 | Oral cavity | OSCC | Glycolysis / Gluconeogenesis | 40/3704 | 67/8465 | 6.08e-03 | 1.44e-02 | 7.31e-03 | 40 |
| hsa0001015 | Oral cavity | OSCC | Glycolysis / Gluconeogenesis | 40/3704 | 67/8465 | 6.08e-03 | 1.44e-02 | 7.31e-03 | 40 |
| hsa0001023 | Oral cavity | LP | Glycolysis / Gluconeogenesis | 28/2418 | 67/8465 | 1.36e-02 | 4.44e-02 | 2.86e-02 | 28 |
| hsa0001033 | Oral cavity | LP | Glycolysis / Gluconeogenesis | 28/2418 | 67/8465 | 1.36e-02 | 4.44e-02 | 2.86e-02 | 28 |
| Page: 1 |
Top |
Cell-cell communication analysis |
| Identification of potential cell-cell interactions between two cell types and their ligand-receptor pairs for different disease states |
| Ligand | Receptor | LRpair | Pathway | Tissue | Disease Stage |
| Page: 1 |
Top |
Single-cell gene regulatory network inference analysis |
| Find out the significant the regulons (TFs) and the target genes of each regulon across cell types for different disease states |
| TF | Cell Type | Tissue | Disease Stage | Target Gene | RSS | Regulon Activity |
| ∗The dot plots of a searched regulon are shown for all cell subpopulations in each disease state of each tissue based on the regulon specific score inferred using pySCENIC and by calculating the average expression. |
| Page: 1 |
Top |
Somatic mutation of malignant transformation related genes |
| Annotation of somatic variants for genes involved in malignant transformation |
| Hugo Symbol | Variant Class | Variant Classification | dbSNP RS | HGVSc | HGVSp | HGVSp Short | SWISSPROT | BIOTYPE | SIFT | PolyPhen | Tumor Sample Barcode | Tissue | Histology | Sex | Age | Stage | Therapy Types | Drugs | Outcome |
| MINPP1 | SNV | Missense_Mutation | rs373221855 | c.1211N>A | p.Arg404Gln | p.R404Q | Q9UNW1 | protein_coding | deleterious(0) | probably_damaging(0.999) | TCGA-AN-A046-01 | Breast | breast invasive carcinoma | Female | >=65 | I/II | Unknown | Unknown | SD |
| MINPP1 | SNV | Missense_Mutation | c.1456N>A | p.Glu486Lys | p.E486K | Q9UNW1 | protein_coding | deleterious_low_confidence(0) | probably_damaging(0.94) | TCGA-C8-A26Y-01 | Breast | breast invasive carcinoma | Female | >=65 | I/II | Unknown | Unknown | SD | |
| MINPP1 | SNV | Missense_Mutation | rs768977489 | c.786N>T | p.Leu262Phe | p.L262F | Q9UNW1 | protein_coding | tolerated(0.26) | possibly_damaging(0.486) | TCGA-E9-A1RG-01 | Breast | breast invasive carcinoma | Female | <65 | III/IV | Hormone Therapy | tamoxiphen | SD |
| MINPP1 | SNV | Missense_Mutation | novel | c.100N>C | p.Glu34Gln | p.E34Q | Q9UNW1 | protein_coding | tolerated(0.2) | benign(0.088) | TCGA-HM-A4S6-01 | Cervix | cervical & endocervical cancer | Female | <65 | III/IV | Chemotherapy | cisplatin | CR |
| MINPP1 | SNV | Missense_Mutation | c.227N>A | p.Gly76Glu | p.G76E | Q9UNW1 | protein_coding | tolerated(0.51) | benign(0) | TCGA-A6-6653-01 | Colorectum | colon adenocarcinoma | Male | >=65 | I/II | Unknown | Unknown | SD | |
| MINPP1 | SNV | Missense_Mutation | novel | c.601C>T | p.His201Tyr | p.H201Y | Q9UNW1 | protein_coding | tolerated(1) | possibly_damaging(0.689) | TCGA-AZ-4315-01 | Colorectum | colon adenocarcinoma | Male | <65 | I/II | Unknown | Unknown | SD |
| MINPP1 | SNV | Missense_Mutation | novel | c.931N>C | p.Lys311Gln | p.K311Q | Q9UNW1 | protein_coding | tolerated(0.4) | benign(0.033) | TCGA-CA-6717-01 | Colorectum | colon adenocarcinoma | Male | <65 | I/II | Chemotherapy | oxaliplatin | CR |
| MINPP1 | SNV | Missense_Mutation | c.688N>T | p.Asp230Tyr | p.D230Y | Q9UNW1 | protein_coding | deleterious(0) | probably_damaging(0.937) | TCGA-CM-6163-01 | Colorectum | colon adenocarcinoma | Male | >=65 | I/II | Unknown | Unknown | SD | |
| MINPP1 | SNV | Missense_Mutation | novel | c.1247N>G | p.Ile416Arg | p.I416R | Q9UNW1 | protein_coding | deleterious(0) | possibly_damaging(0.599) | TCGA-AG-A002-01 | Colorectum | rectum adenocarcinoma | Male | <65 | I/II | Unknown | Unknown | SD |
| MINPP1 | SNV | Missense_Mutation | c.1106G>C | p.Gly369Ala | p.G369A | Q9UNW1 | protein_coding | deleterious(0) | possibly_damaging(0.841) | TCGA-F5-6465-01 | Colorectum | rectum adenocarcinoma | Female | <65 | I/II | Unknown | Unknown | SD |
| Page: 1 2 3 4 5 |
Top |
Related drugs of malignant transformation related genes |
| Identification of chemicals and drugs interact with genes involved in malignant transfromation |
| (DGIdb 4.0) |
| Entrez ID | Symbol | Category | Interaction Types | Drug Claim Name | Drug Name | PMIDs |
| Page: 1 |

Copyright 2023-Present -The University of Texas Health Science Center at Houston |