| Tissue | Expression Dynamics | Abbreviation |
| Cervix | 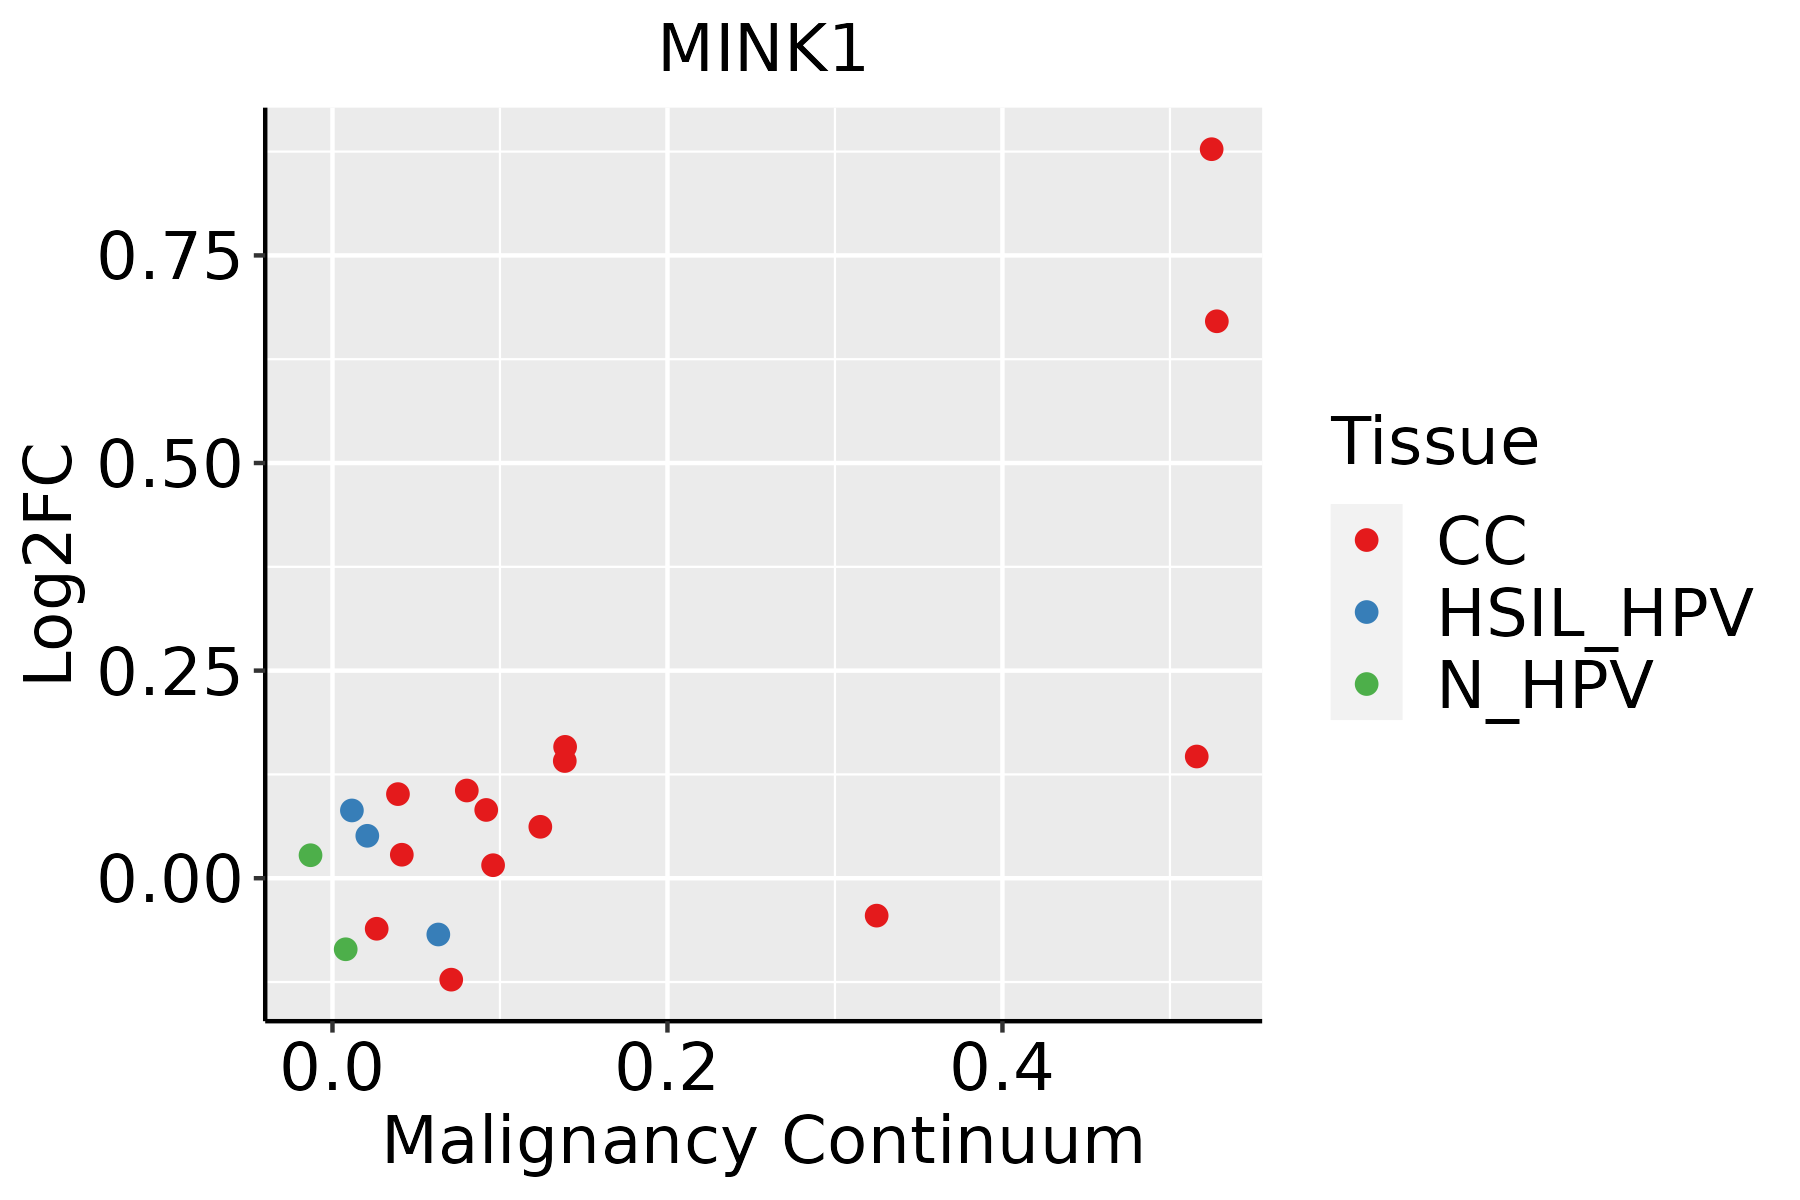 | CC: Cervix cancer |
| HSIL_HPV: HPV-infected high-grade squamous intraepithelial lesions |
| N_HPV: HPV-infected normal cervix |
| Esophagus | 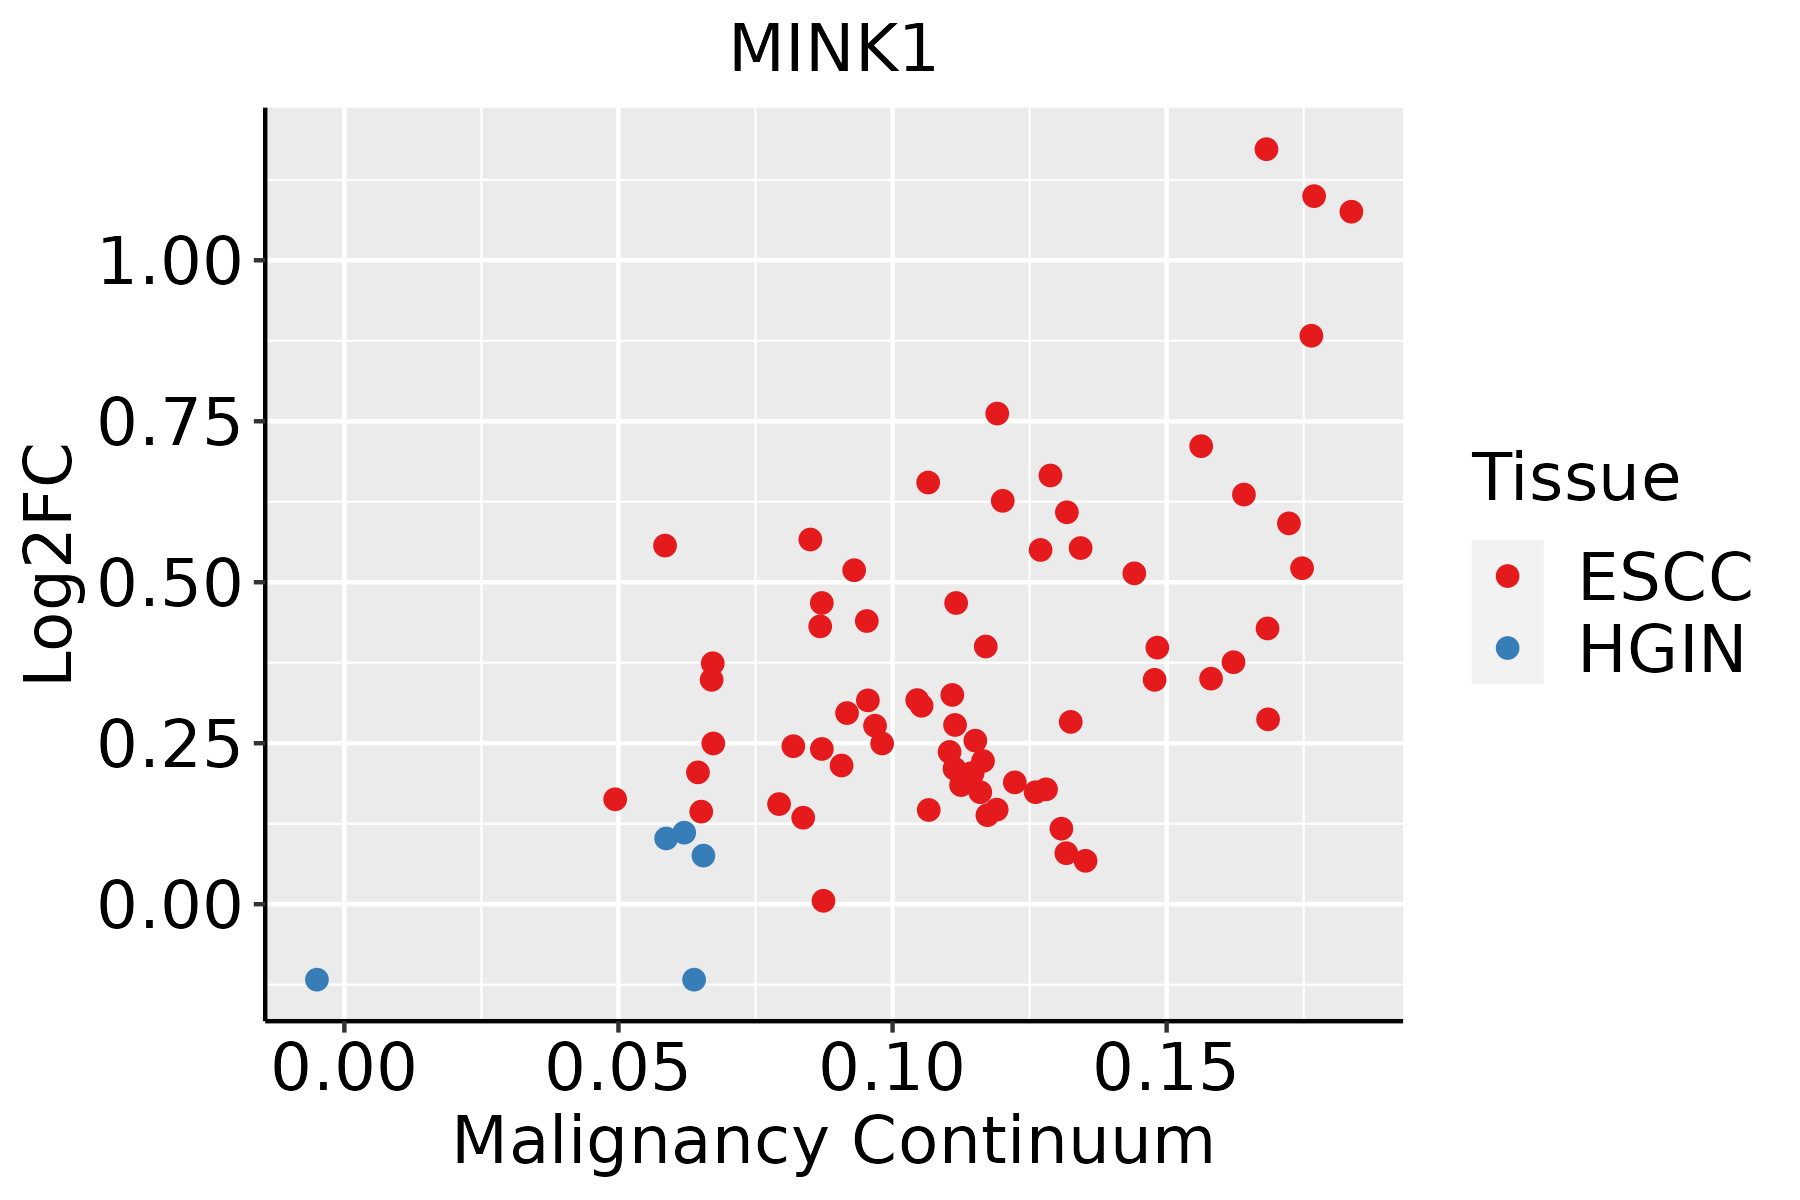 | ESCC: Esophageal squamous cell carcinoma |
| HGIN: High-grade intraepithelial neoplasias |
| LGIN: Low-grade intraepithelial neoplasias |
| Liver | 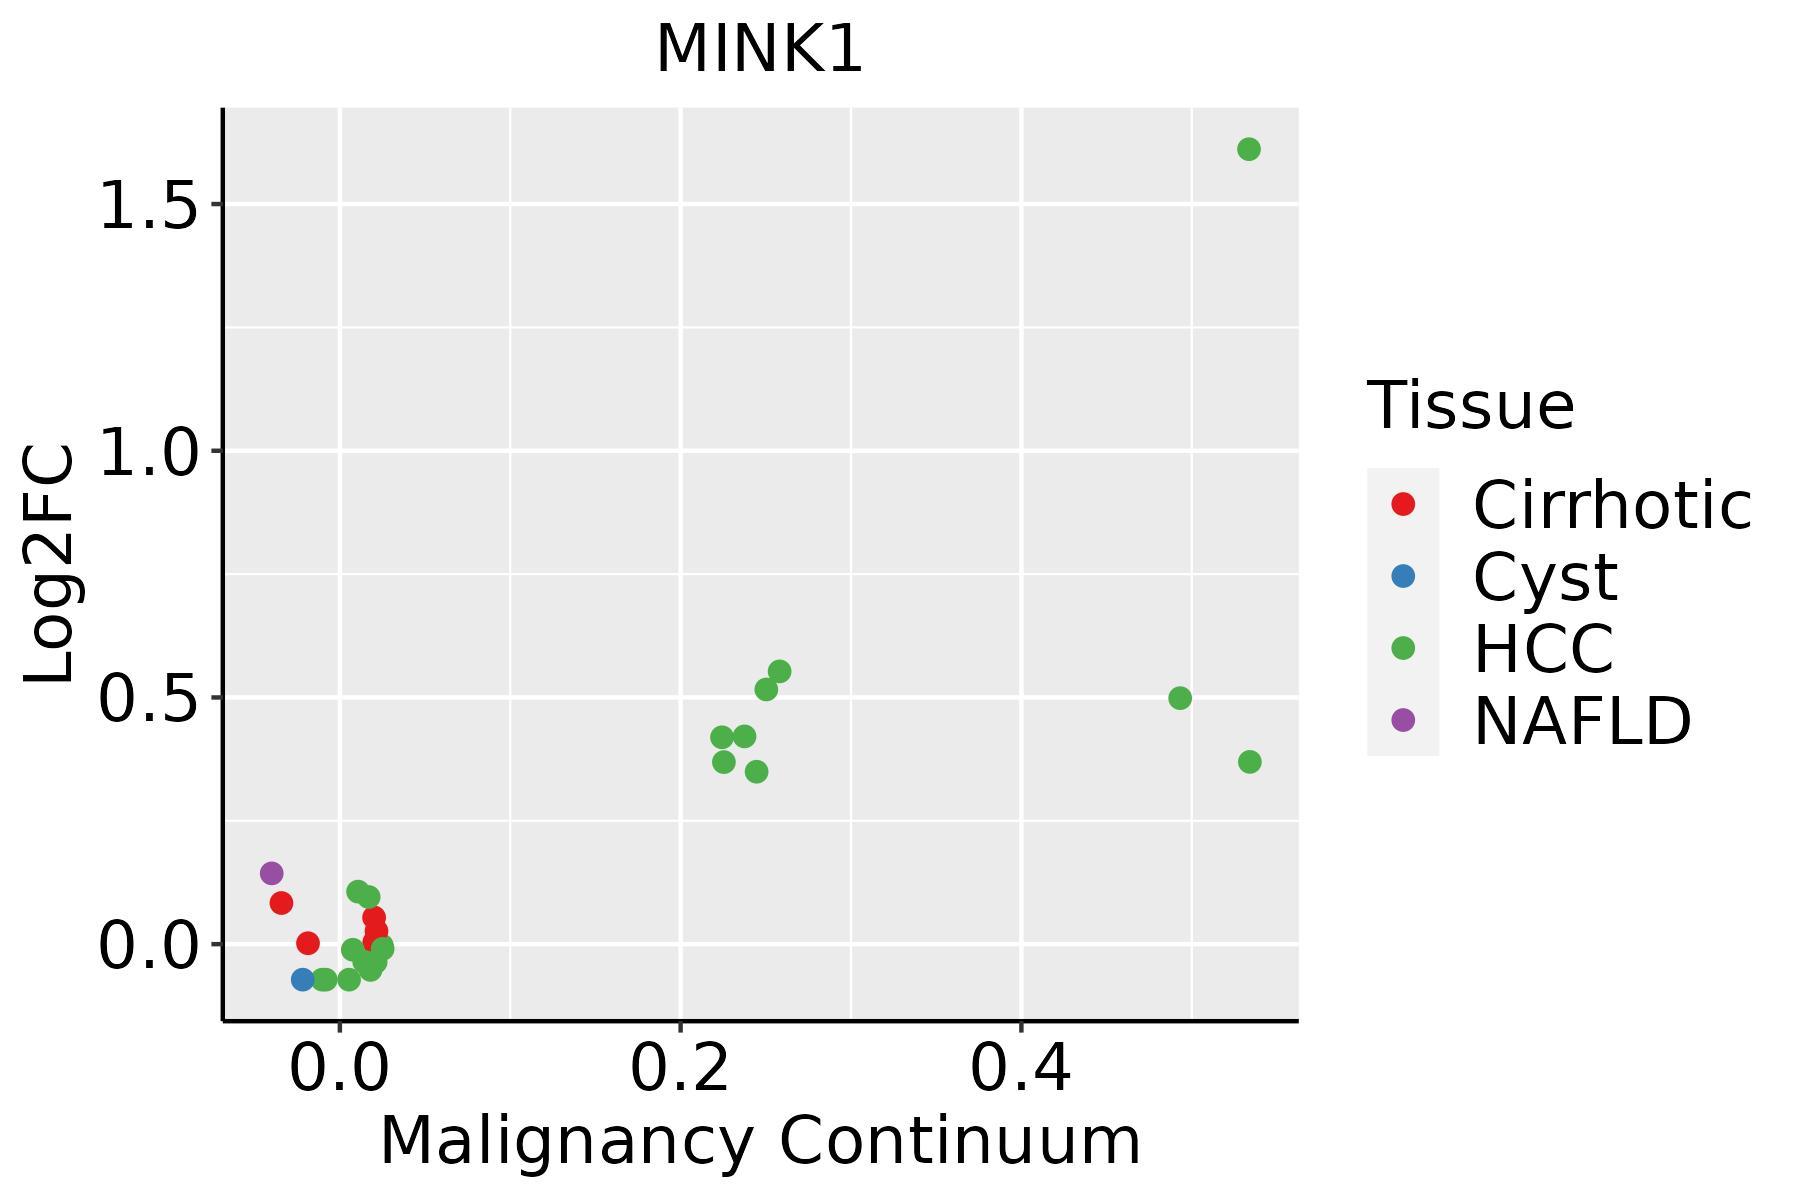 | HCC: Hepatocellular carcinoma |
| NAFLD: Non-alcoholic fatty liver disease |
| Oral Cavity | 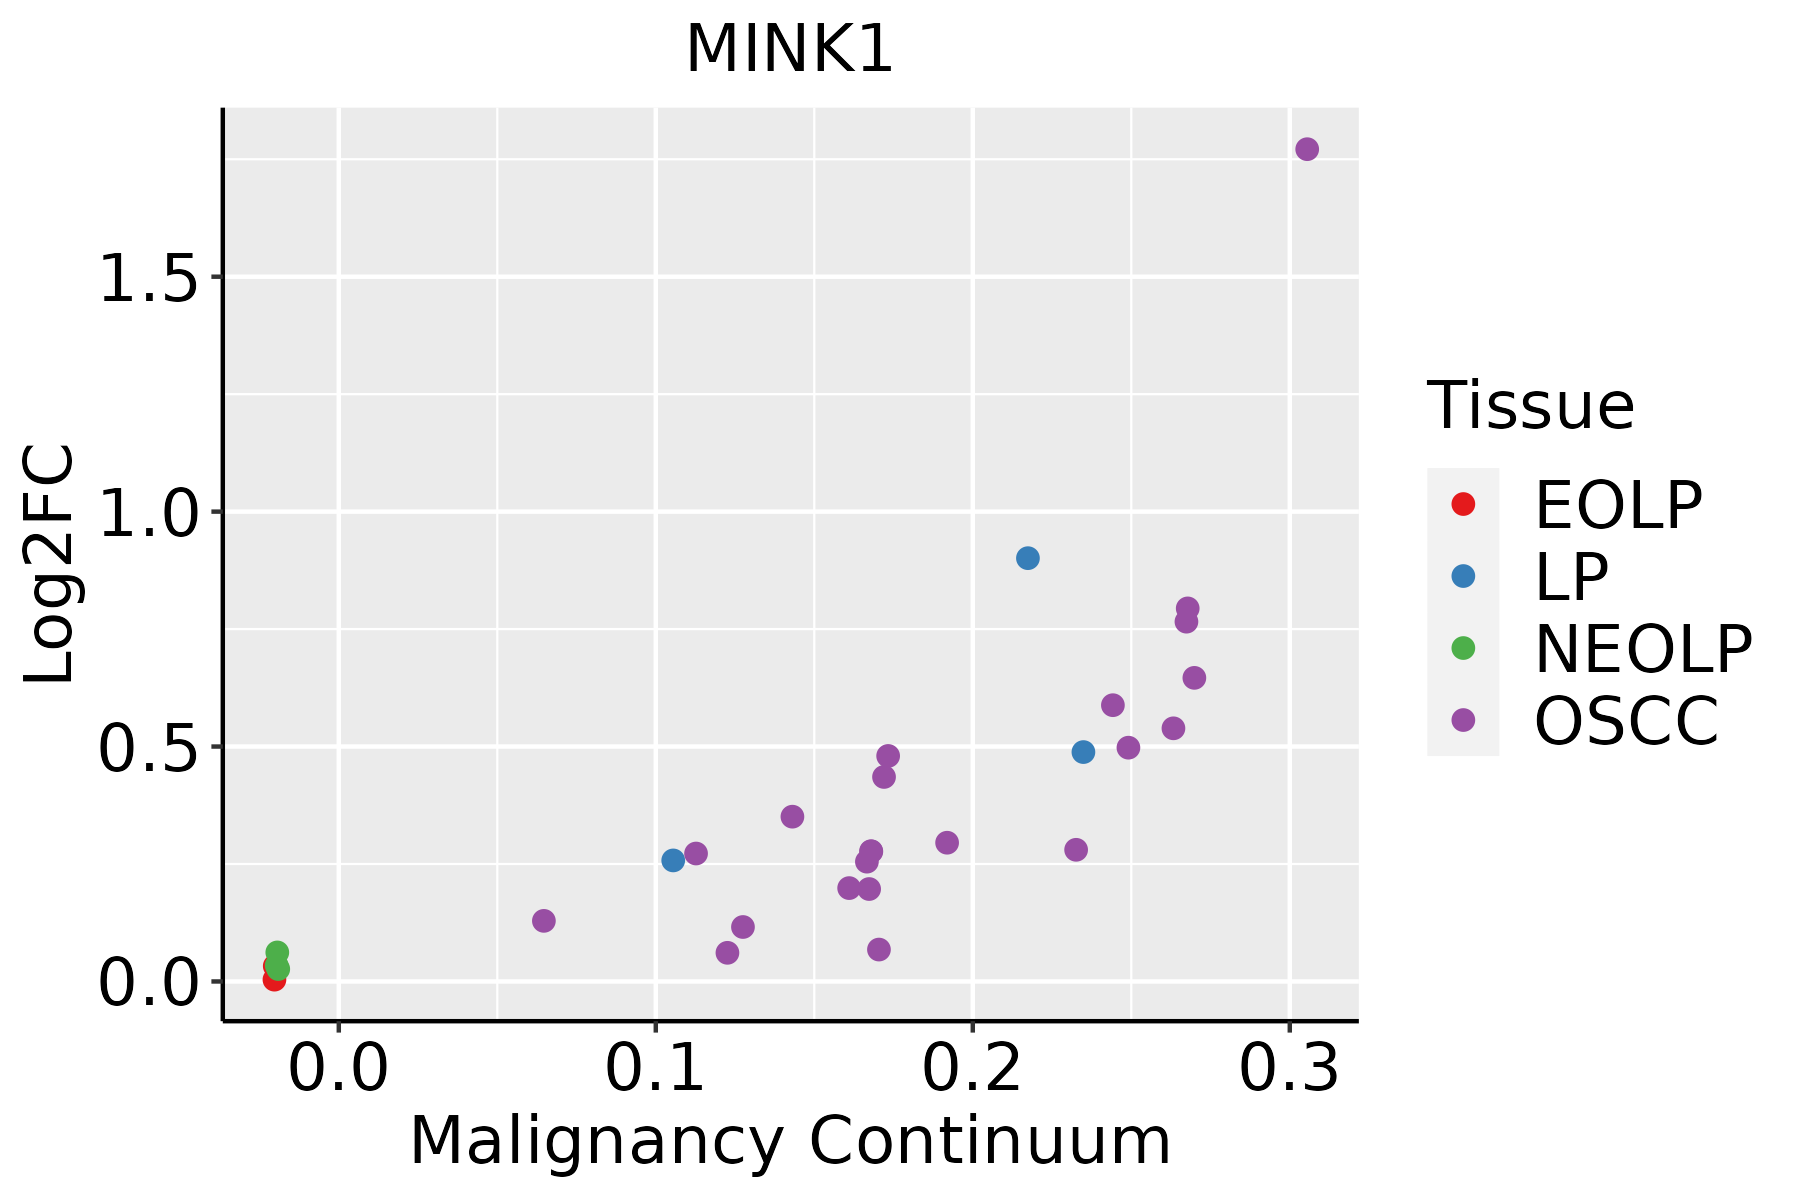 | EOLP: Erosive Oral lichen planus |
| LP: leukoplakia |
| NEOLP: Non-erosive oral lichen planus |
| OSCC: Oral squamous cell carcinoma |
| Skin |  | AK: Actinic keratosis |
| cSCC: Cutaneous squamous cell carcinoma |
| SCCIS:squamous cell carcinoma in situ |
| GO ID | Tissue | Disease Stage | Description | Gene Ratio | Bg Ratio | pvalue | p.adjust | Count |
| GO:001081010 | Cervix | CC | regulation of cell-substrate adhesion | 69/2311 | 221/18723 | 8.57e-14 | 5.69e-11 | 69 |
| GO:00315898 | Cervix | CC | cell-substrate adhesion | 96/2311 | 363/18723 | 1.48e-13 | 8.85e-11 | 96 |
| GO:002240710 | Cervix | CC | regulation of cell-cell adhesion | 103/2311 | 448/18723 | 1.78e-10 | 2.87e-08 | 103 |
| GO:00019528 | Cervix | CC | regulation of cell-matrix adhesion | 40/2311 | 128/18723 | 1.32e-08 | 1.04e-06 | 40 |
| GO:00071608 | Cervix | CC | cell-matrix adhesion | 60/2311 | 233/18723 | 1.58e-08 | 1.23e-06 | 60 |
| GO:00163587 | Cervix | CC | dendrite development | 58/2311 | 243/18723 | 4.52e-07 | 1.76e-05 | 58 |
| GO:00310988 | Cervix | CC | stress-activated protein kinase signaling cascade | 58/2311 | 247/18723 | 8.02e-07 | 2.89e-05 | 58 |
| GO:00514038 | Cervix | CC | stress-activated MAPK cascade | 55/2311 | 239/18723 | 2.96e-06 | 8.31e-05 | 55 |
| GO:00315328 | Cervix | CC | actin cytoskeleton reorganization | 31/2311 | 107/18723 | 3.34e-06 | 8.99e-05 | 31 |
| GO:00703027 | Cervix | CC | regulation of stress-activated protein kinase signaling cascade | 46/2311 | 195/18723 | 9.35e-06 | 2.11e-04 | 46 |
| GO:00434104 | Cervix | CC | positive regulation of MAPK cascade | 90/2311 | 480/18723 | 2.92e-05 | 4.83e-04 | 90 |
| GO:00328727 | Cervix | CC | regulation of stress-activated MAPK cascade | 44/2311 | 192/18723 | 3.09e-05 | 5.10e-04 | 44 |
| GO:00380664 | Cervix | CC | p38MAPK cascade | 17/2311 | 55/18723 | 2.25e-04 | 2.54e-03 | 17 |
| GO:00072545 | Cervix | CC | JNK cascade | 35/2311 | 167/18723 | 1.10e-03 | 9.09e-03 | 35 |
| GO:19007442 | Cervix | CC | regulation of p38MAPK cascade | 14/2311 | 47/18723 | 1.18e-03 | 9.56e-03 | 14 |
| GO:00463285 | Cervix | CC | regulation of JNK cascade | 28/2311 | 133/18723 | 3.06e-03 | 2.01e-02 | 28 |
| GO:00488135 | Cervix | CC | dendrite morphogenesis | 30/2311 | 146/18723 | 3.27e-03 | 2.13e-02 | 30 |
| GO:00703043 | Cervix | CC | positive regulation of stress-activated protein kinase signaling cascade | 27/2311 | 128/18723 | 3.49e-03 | 2.26e-02 | 27 |
| GO:003158919 | Esophagus | ESCC | cell-substrate adhesion | 221/8552 | 363/18723 | 3.06e-09 | 6.62e-08 | 221 |
| GO:001081020 | Esophagus | ESCC | regulation of cell-substrate adhesion | 144/8552 | 221/18723 | 3.55e-09 | 7.45e-08 | 144 |
| Hugo Symbol | Variant Class | Variant Classification | dbSNP RS | HGVSc | HGVSp | HGVSp Short | SWISSPROT | BIOTYPE | SIFT | PolyPhen | Tumor Sample Barcode | Tissue | Histology | Sex | Age | Stage | Therapy Types | Drugs | Outcome |
| MINK1 | SNV | Missense_Mutation | | c.187N>A | p.Glu63Lys | p.E63K | Q8N4C8 | protein_coding | deleterious(0) | probably_damaging(0.98) | TCGA-AC-A23H-01 | Breast | breast invasive carcinoma | Female | >=65 | I/II | Unknown | Unknown | PD |
| MINK1 | SNV | Missense_Mutation | | c.3134N>A | p.Arg1045Gln | p.R1045Q | Q8N4C8 | protein_coding | deleterious(0) | probably_damaging(0.971) | TCGA-AN-A046-01 | Breast | breast invasive carcinoma | Female | >=65 | I/II | Unknown | Unknown | SD |
| MINK1 | SNV | Missense_Mutation | | c.566T>A | p.Ile189Asn | p.I189N | Q8N4C8 | protein_coding | deleterious(0) | probably_damaging(0.991) | TCGA-AO-A12H-01 | Breast | breast invasive carcinoma | Female | >=65 | I/II | Hormone Therapy | arimidex | SD |
| MINK1 | SNV | Missense_Mutation | rs773979222 | c.2266N>A | p.Gly756Arg | p.G756R | Q8N4C8 | protein_coding | tolerated(0.24) | possibly_damaging(0.573) | TCGA-BH-A0DQ-01 | Breast | breast invasive carcinoma | Female | <65 | I/II | Chemotherapy | doxorubicin | SD |
| MINK1 | deletion | Frame_Shift_Del | novel | c.196delN | p.Ile66SerfsTer8 | p.I66Sfs*8 | Q8N4C8 | protein_coding | | | TCGA-A2-A0T2-01 | Breast | breast invasive carcinoma | Female | >=65 | III/IV | Chemotherapy | xeloda | PD |
| MINK1 | insertion | Frame_Shift_Ins | novel | c.2784_2785insT | p.Pro929SerfsTer8 | p.P929Sfs*8 | Q8N4C8 | protein_coding | | | TCGA-A7-A6VV-01 | Breast | breast invasive carcinoma | Female | <65 | I/II | Chemotherapy | cyclophosphamide | CR |
| MINK1 | insertion | Frame_Shift_Ins | novel | c.3050_3051insGGATCTACCAGCCTGGAGGCAGTGGGGACAGCATCCCC | p.Phe1018AspfsTer36 | p.F1018Dfs*36 | Q8N4C8 | protein_coding | | | TCGA-BH-A0AY-01 | Breast | breast invasive carcinoma | Female | <65 | I/II | Chemotherapy | | SD |
| MINK1 | deletion | Frame_Shift_Del | novel | c.416delN | p.Gly140ValfsTer10 | p.G140Vfs*10 | Q8N4C8 | protein_coding | | | TCGA-D8-A27V-01 | Breast | breast invasive carcinoma | Female | <65 | I/II | Hormone Therapy | tamoxiphen | SD |
| MINK1 | SNV | Missense_Mutation | novel | c.263N>T | p.Ala88Val | p.A88V | Q8N4C8 | protein_coding | deleterious(0.02) | probably_damaging(0.982) | TCGA-2W-A8YY-01 | Cervix | cervical & endocervical cancer | Female | <65 | I/II | Chemotherapy | cisplatin | CR |
| MINK1 | SNV | Missense_Mutation | rs747562269 | c.896N>A | p.Arg299His | p.R299H | Q8N4C8 | protein_coding | deleterious(0.05) | probably_damaging(0.96) | TCGA-2W-A8YY-01 | Cervix | cervical & endocervical cancer | Female | <65 | I/II | Chemotherapy | cisplatin | CR |
| Entrez ID | Symbol | Category | Interaction Types | Drug Claim Name | Drug Name | PMIDs |
| 50488 | MINK1 | DRUGGABLE GENOME, KINASE, ENZYME, SERINE THREONINE KINASE | | BAY-613606 | CHEMBL541400 | |
| 50488 | MINK1 | DRUGGABLE GENOME, KINASE, ENZYME, SERINE THREONINE KINASE | | PD-0166285 | PD-0166285 | |
| 50488 | MINK1 | DRUGGABLE GENOME, KINASE, ENZYME, SERINE THREONINE KINASE | | SB-242235 | SB-242235 | |
| 50488 | MINK1 | DRUGGABLE GENOME, KINASE, ENZYME, SERINE THREONINE KINASE | | ILORASERTIB | ILORASERTIB | |
| 50488 | MINK1 | DRUGGABLE GENOME, KINASE, ENZYME, SERINE THREONINE KINASE | | ERLOTINIB | ERLOTINIB | |
| 50488 | MINK1 | DRUGGABLE GENOME, KINASE, ENZYME, SERINE THREONINE KINASE | | CEDIRANIB | CEDIRANIB | |
| 50488 | MINK1 | DRUGGABLE GENOME, KINASE, ENZYME, SERINE THREONINE KINASE | | PF-562271 | PF-00562271 | |
| 50488 | MINK1 | DRUGGABLE GENOME, KINASE, ENZYME, SERINE THREONINE KINASE | | DOVITINIB | DOVITINIB | |
| 50488 | MINK1 | DRUGGABLE GENOME, KINASE, ENZYME, SERINE THREONINE KINASE | | SNS-314 | SNS-314 | |
| 50488 | MINK1 | DRUGGABLE GENOME, KINASE, ENZYME, SERINE THREONINE KINASE | | TOZASERTIB | TOZASERTIB | |


