
|
|||||
|
 | |
| |
| |
| |
| |
| |
|
Gene: MINDY2 |
Gene summary for MINDY2 |
| Gene information | Species | Human | Gene symbol | MINDY2 | Gene ID | 54629 |
| Gene name | MINDY lysine 48 deubiquitinase 2 | |
| Gene Alias | FAM63B | |
| Cytomap | 15q21.3-q22.1 | |
| Gene Type | protein-coding | GO ID | GO:0006464 | UniProtAcc | Q8NBR6 |
Top |
Malignant transformation analysis |
| Identification of the aberrant gene expression in precancerous and cancerous lesions by comparing the gene expression of stem-like cells in diseased tissues with normal stem cells |
| Entrez ID | Symbol | Replicates | Species | Organ | Tissue | Adj P-value | Log2FC | Malignancy |
| 54629 | MINDY2 | HTA11_347_2000001011 | Human | Colorectum | AD | 1.34e-09 | 5.55e-01 | -0.1954 |
| 54629 | MINDY2 | HTA11_99999970781_79442 | Human | Colorectum | MSS | 1.63e-22 | -3.77e-01 | 0.294 |
| 54629 | MINDY2 | HTA11_99999965104_69814 | Human | Colorectum | MSS | 1.62e-05 | -3.77e-01 | 0.281 |
| 54629 | MINDY2 | HTA11_99999971662_82457 | Human | Colorectum | MSS | 4.78e-17 | -3.77e-01 | 0.3859 |
| 54629 | MINDY2 | HTA11_99999973899_84307 | Human | Colorectum | MSS | 8.68e-04 | -3.77e-01 | 0.2585 |
| 54629 | MINDY2 | HTA11_99999974143_84620 | Human | Colorectum | MSS | 2.11e-21 | -3.77e-01 | 0.3005 |
| 54629 | MINDY2 | A015-C-203 | Human | Colorectum | FAP | 4.55e-11 | -1.93e-01 | -0.1294 |
| 54629 | MINDY2 | A001-C-108 | Human | Colorectum | FAP | 3.86e-04 | -3.28e-02 | -0.0272 |
| 54629 | MINDY2 | A002-C-205 | Human | Colorectum | FAP | 1.96e-06 | -1.54e-01 | -0.1236 |
| 54629 | MINDY2 | A015-C-006 | Human | Colorectum | FAP | 6.55e-03 | -1.25e-01 | -0.0994 |
| 54629 | MINDY2 | A015-C-106 | Human | Colorectum | FAP | 2.85e-04 | -1.10e-01 | -0.0511 |
| 54629 | MINDY2 | A002-C-114 | Human | Colorectum | FAP | 1.10e-04 | -1.02e-01 | -0.1561 |
| 54629 | MINDY2 | A015-C-104 | Human | Colorectum | FAP | 2.94e-12 | -5.10e-02 | -0.1899 |
| 54629 | MINDY2 | A001-C-014 | Human | Colorectum | FAP | 6.88e-04 | -1.30e-01 | 0.0135 |
| 54629 | MINDY2 | A002-C-016 | Human | Colorectum | FAP | 3.65e-10 | -1.98e-01 | 0.0521 |
| 54629 | MINDY2 | A002-C-116 | Human | Colorectum | FAP | 6.75e-12 | -2.11e-01 | -0.0452 |
| 54629 | MINDY2 | A014-C-008 | Human | Colorectum | FAP | 8.59e-04 | -1.95e-01 | -0.191 |
| 54629 | MINDY2 | A018-E-020 | Human | Colorectum | FAP | 1.66e-05 | -1.66e-01 | -0.2034 |
| 54629 | MINDY2 | F034 | Human | Colorectum | FAP | 1.89e-06 | -1.43e-01 | -0.0665 |
| 54629 | MINDY2 | CRC-1-8810 | Human | Colorectum | CRC | 1.08e-03 | -1.87e-01 | 0.6257 |
| Page: 1 2 3 |
| Tissue | Expression Dynamics | Abbreviation |
| Colorectum (GSE201348) | 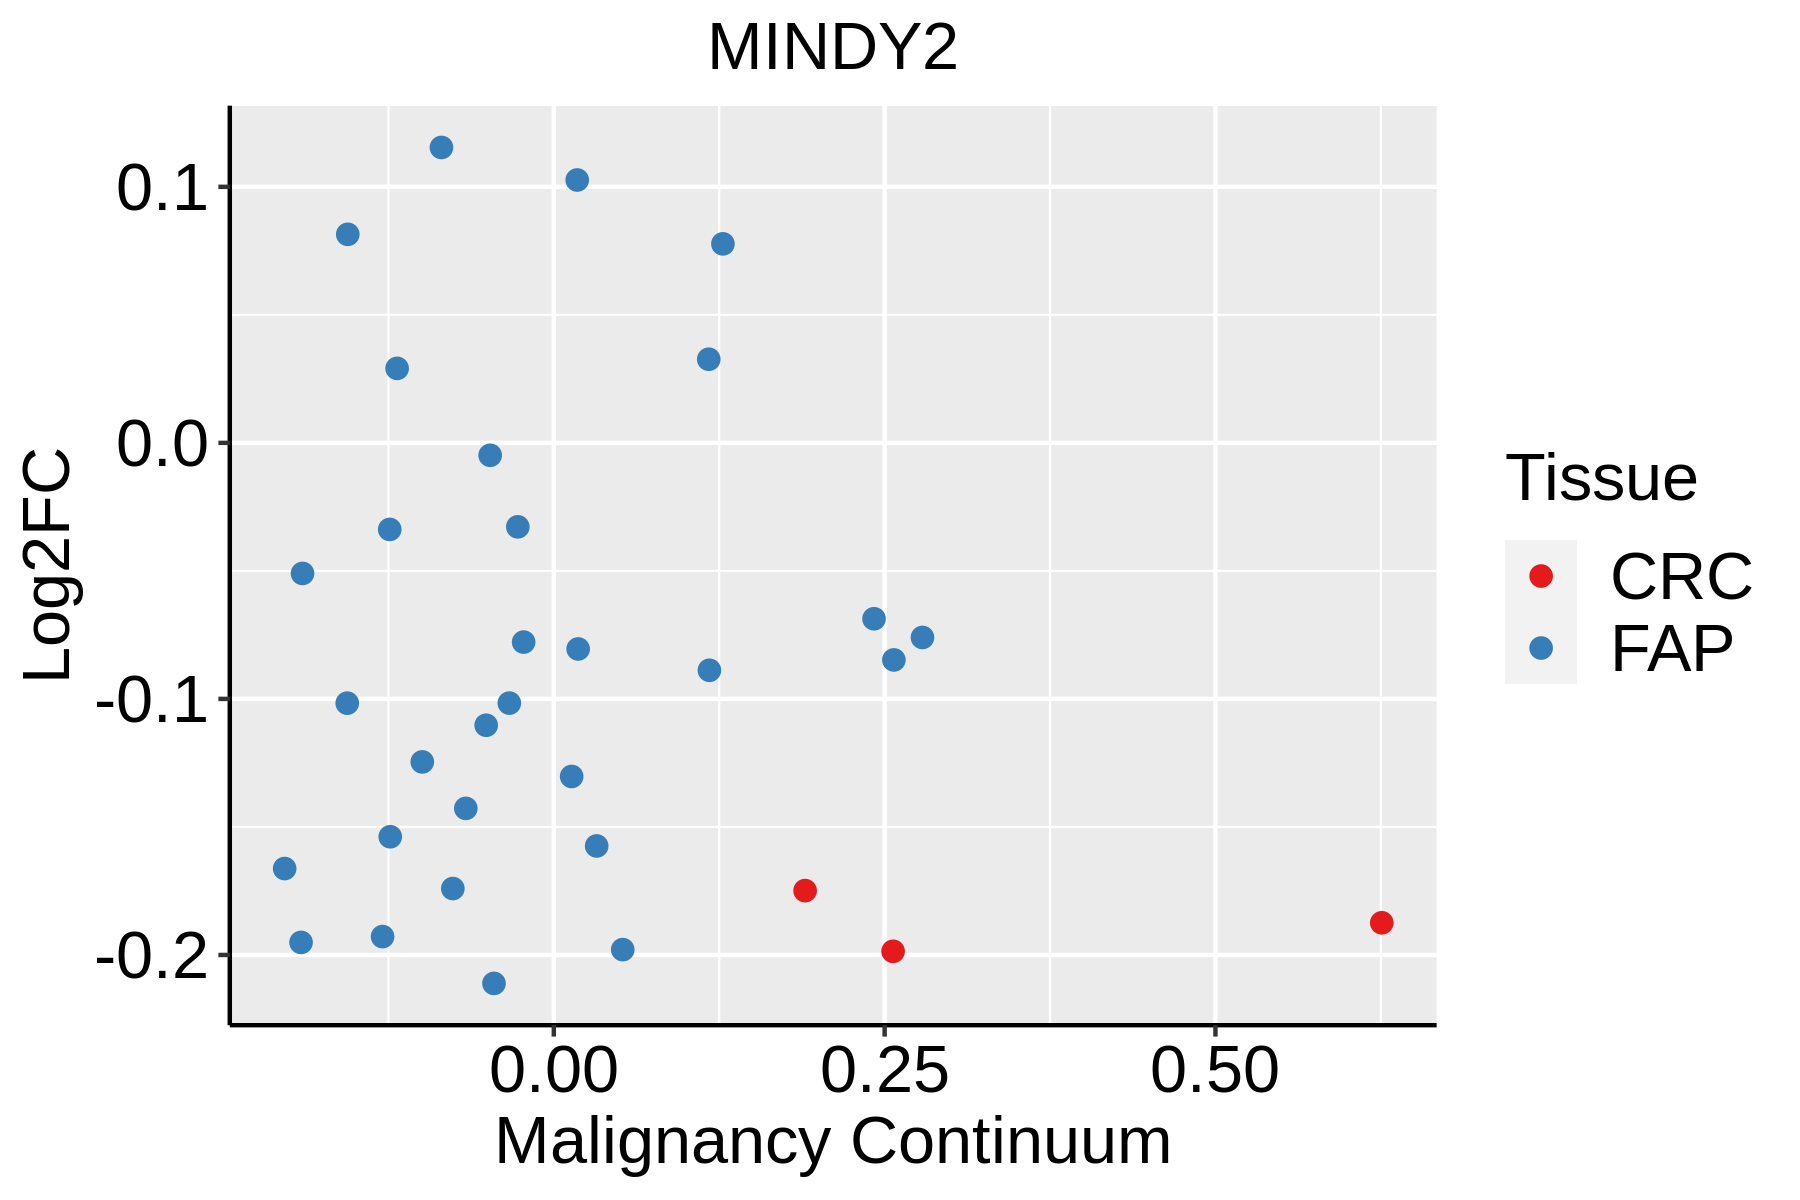 | FAP: Familial adenomatous polyposis |
| CRC: Colorectal cancer | ||
| Colorectum (HTA11) |  | AD: Adenomas |
| SER: Sessile serrated lesions | ||
| MSI-H: Microsatellite-high colorectal cancer | ||
| MSS: Microsatellite stable colorectal cancer | ||
| Esophagus | 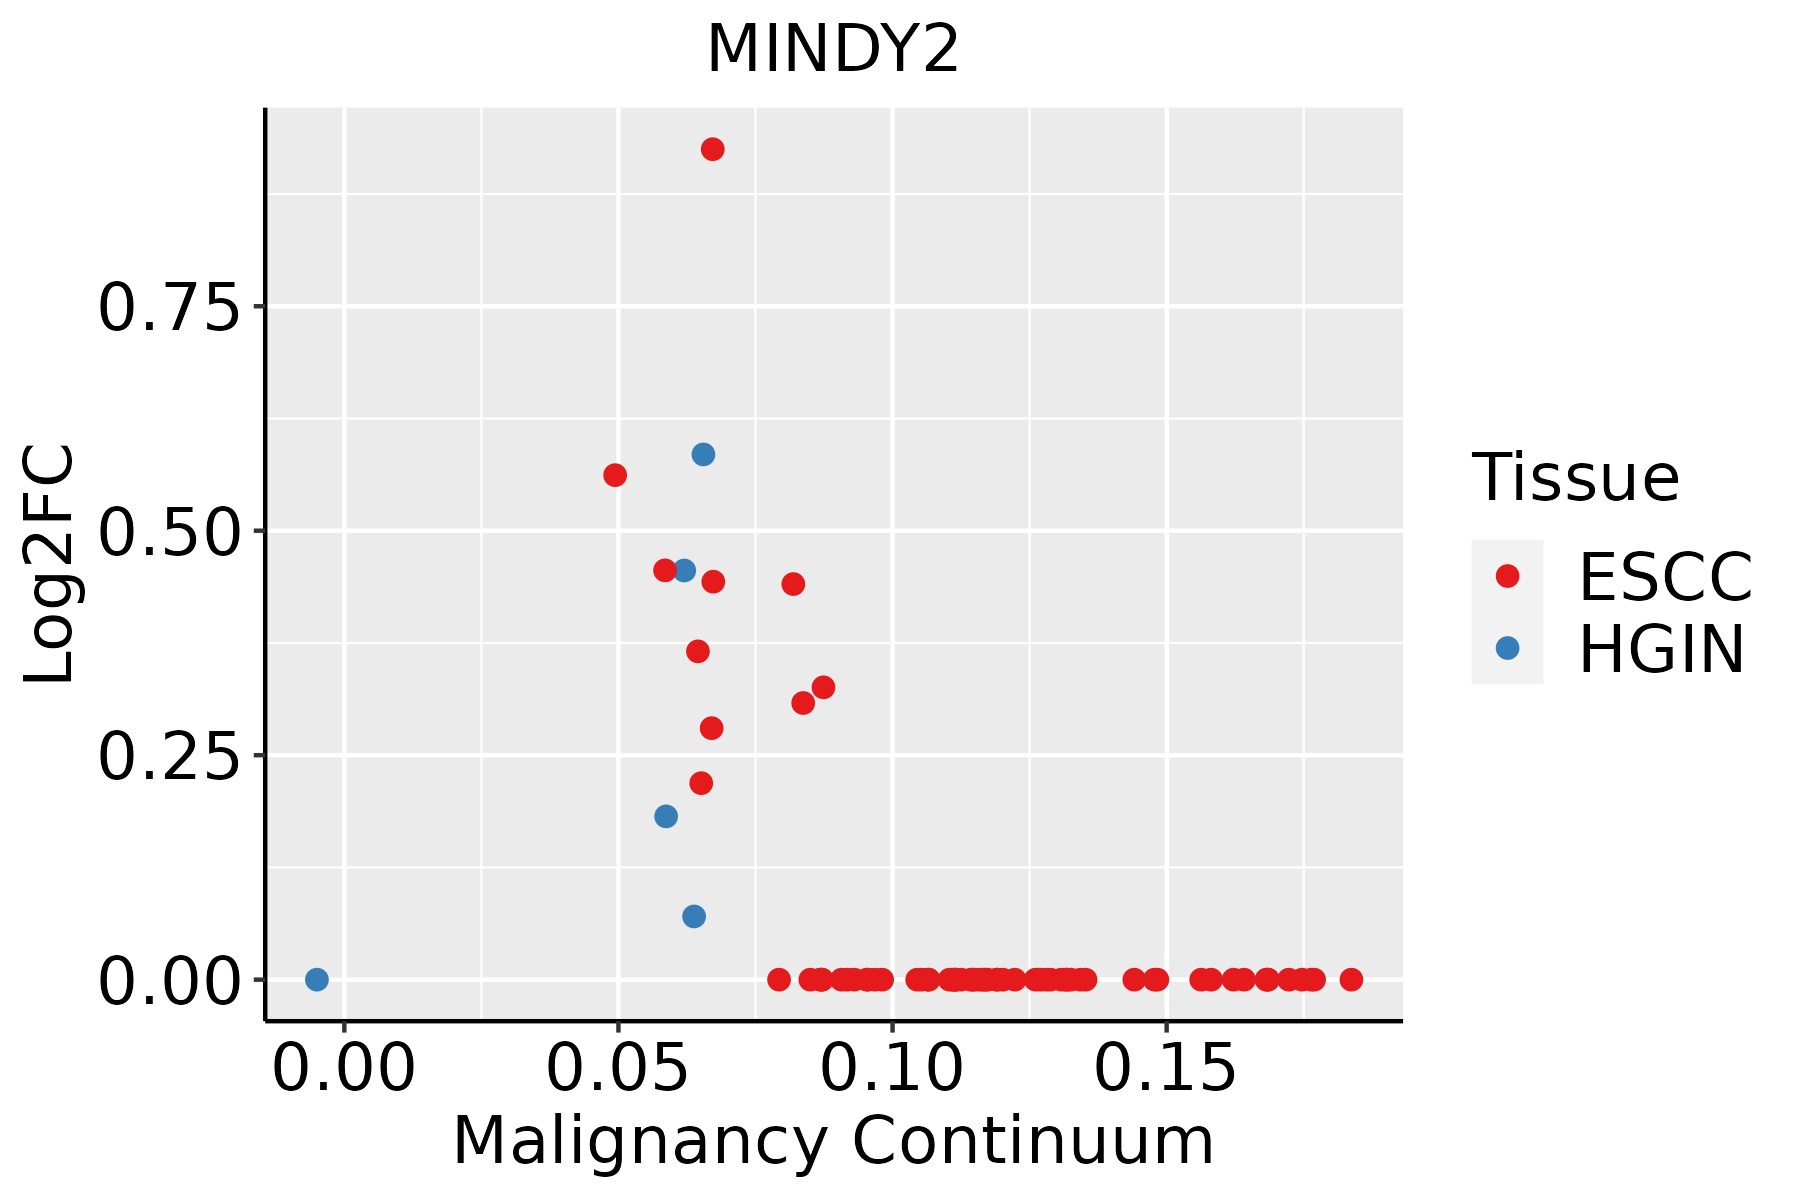 | ESCC: Esophageal squamous cell carcinoma |
| HGIN: High-grade intraepithelial neoplasias | ||
| LGIN: Low-grade intraepithelial neoplasias | ||
| Liver | 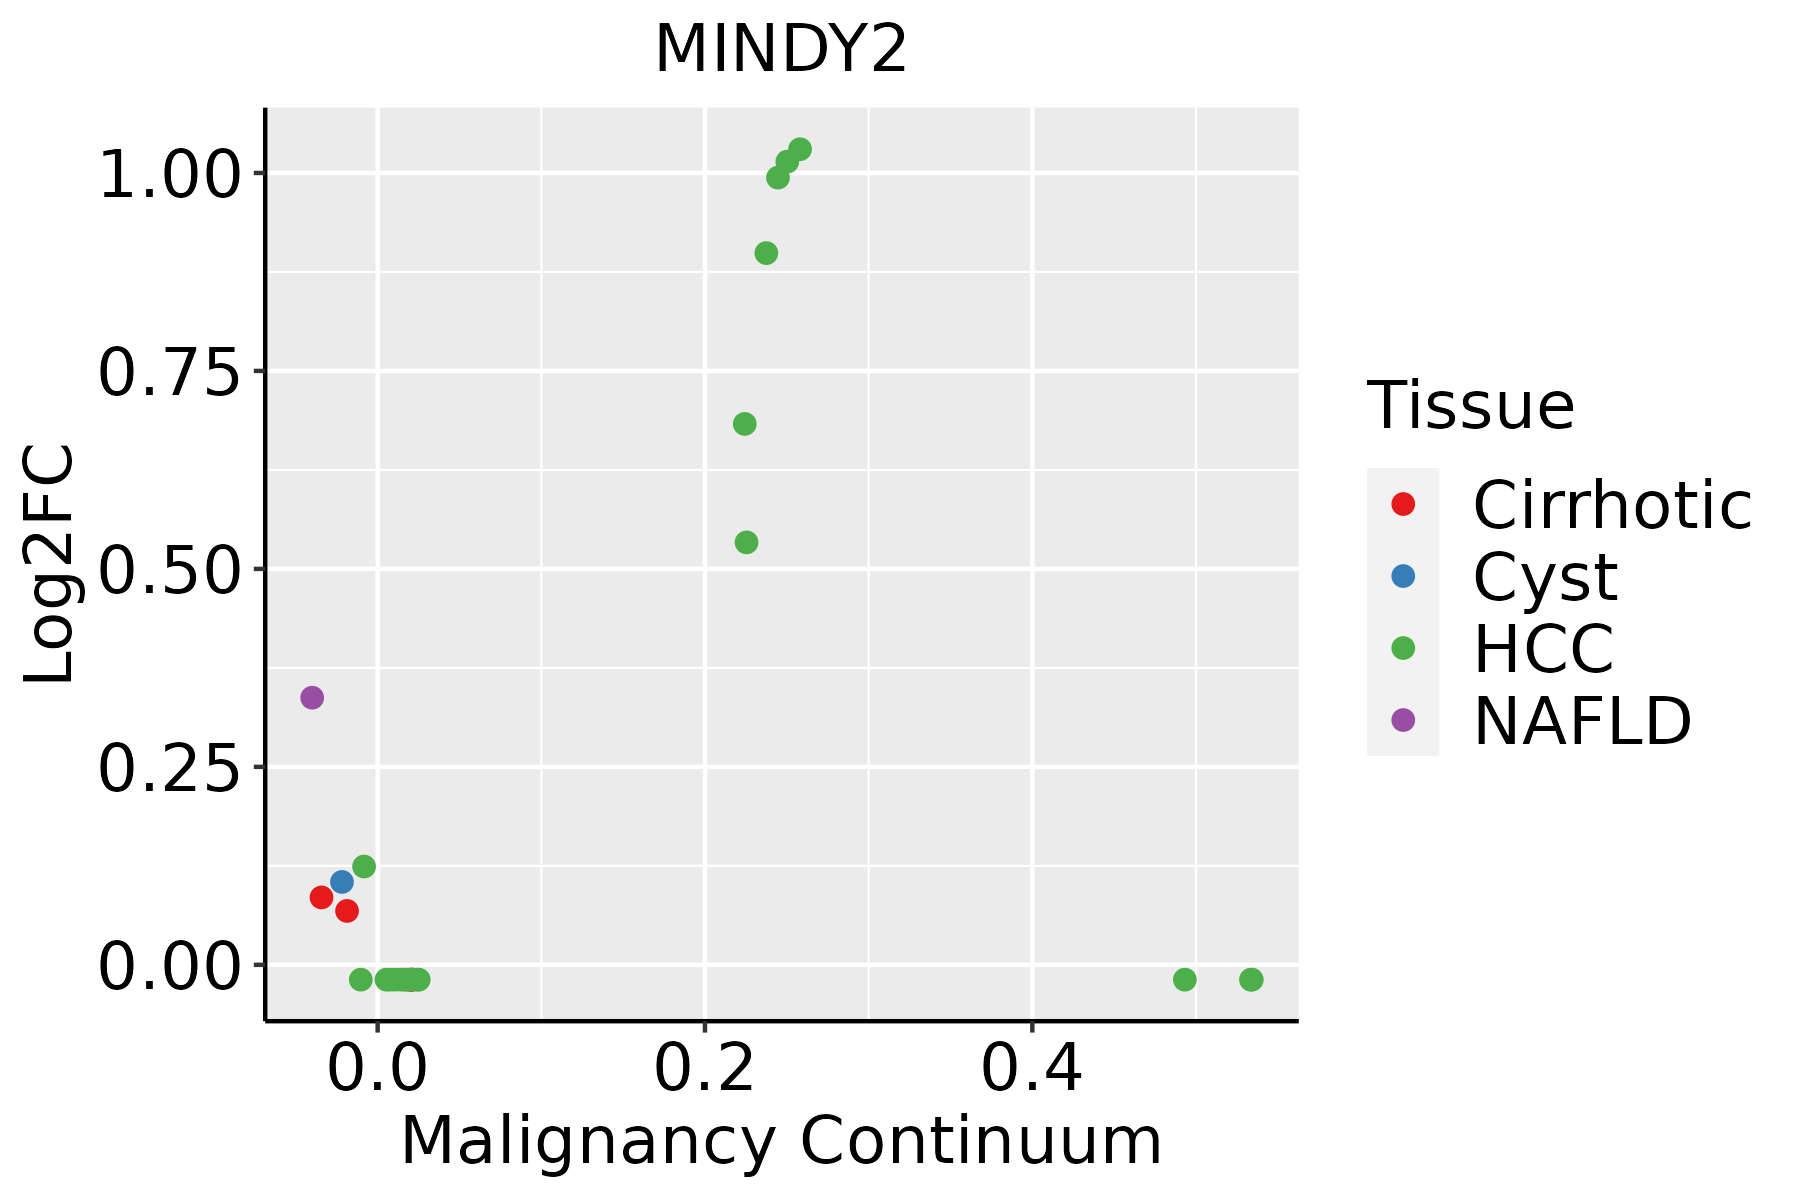 | HCC: Hepatocellular carcinoma |
| NAFLD: Non-alcoholic fatty liver disease | ||
| Thyroid | 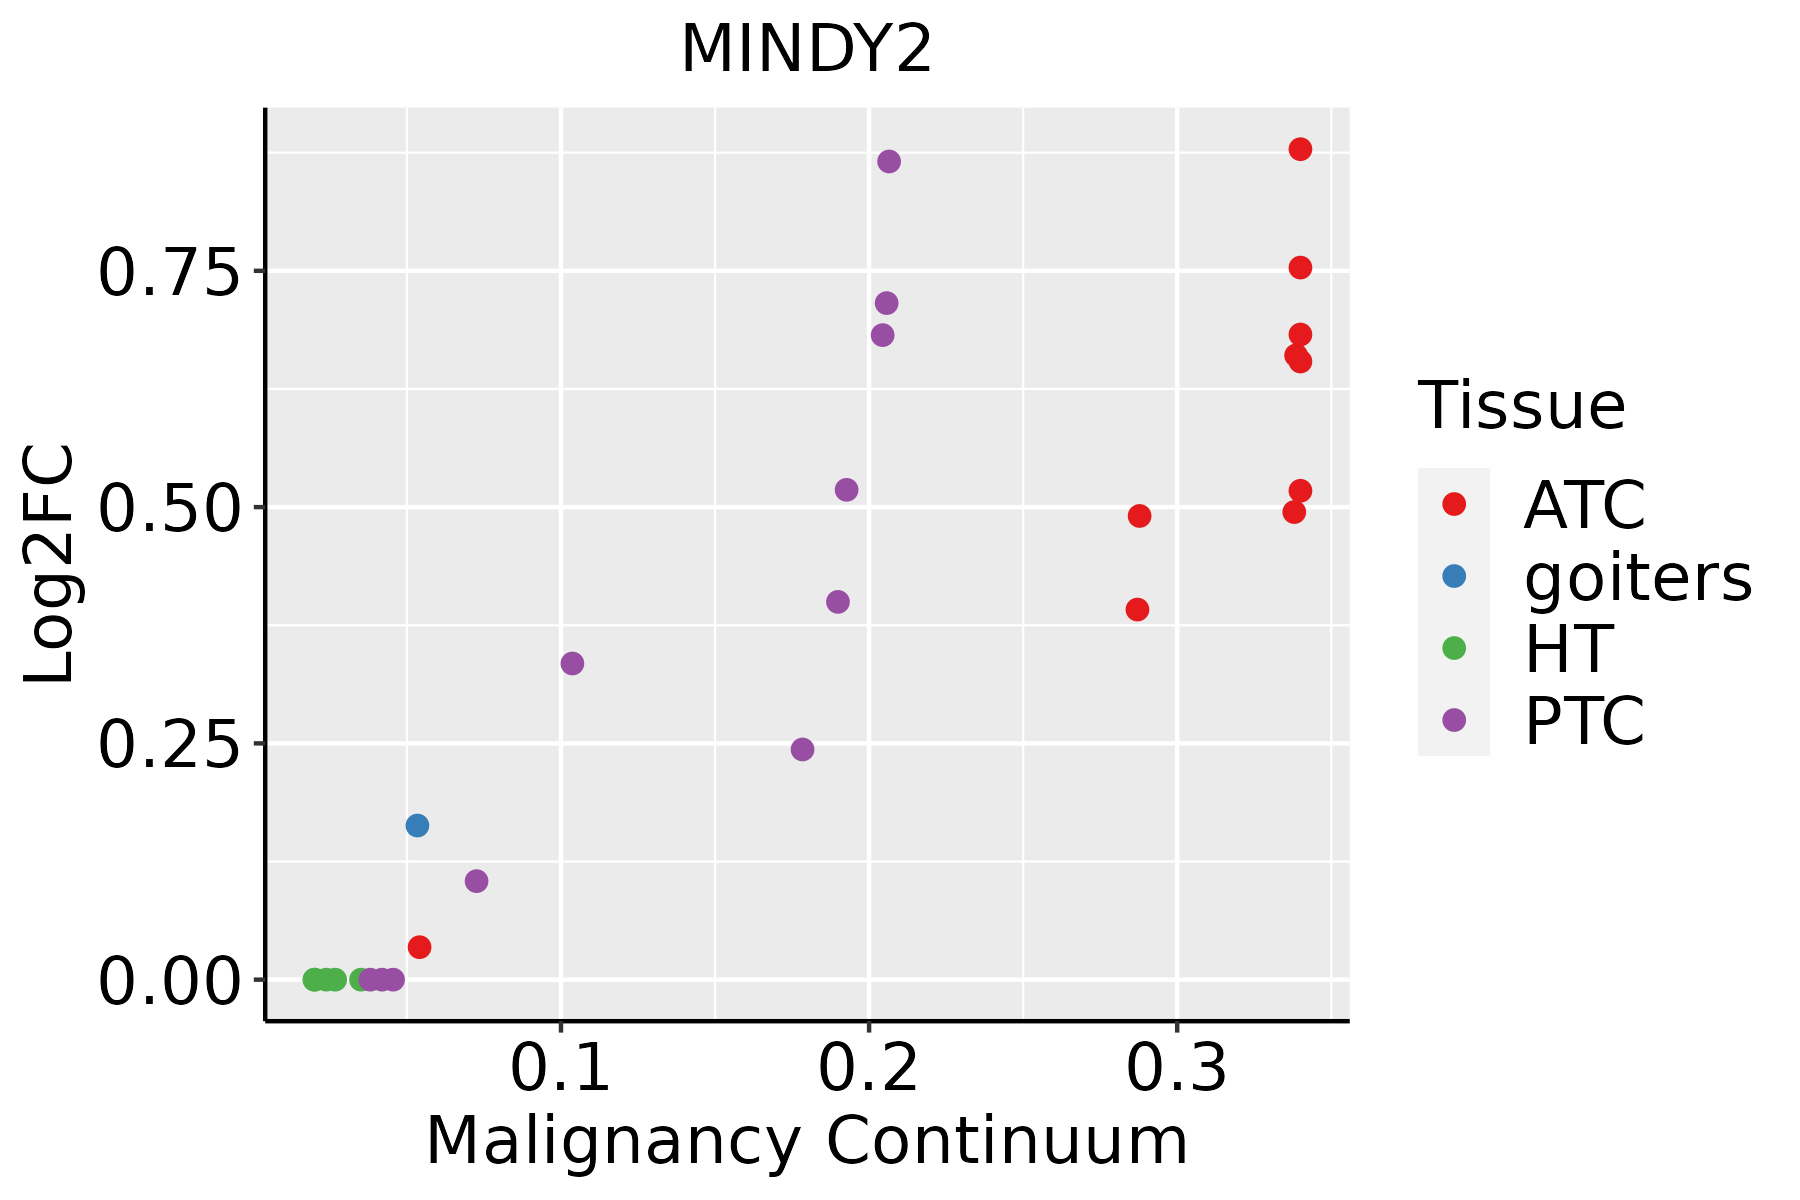 | ATC: Anaplastic thyroid cancer |
| HT: Hashimoto's thyroiditis | ||
| PTC: Papillary thyroid cancer |
| ∗log2FC in expression of this searched gene in stem-like cells from each diseased tissue sample relative to stem-like cells in normal samples in each tissue plotted against the malignancy continuum. Samples are colored based on if they are from different disease stage. |
Top |
Malignant transformation related pathway analysis |
| Find out the enriched GO biological processes and KEGG pathways involved in transition from healthy to precancer to cancer |
| Tissue | Disease Stage | Enriched GO biological Processes |
| Colorectum | AD |  |
| Colorectum | SER |  |
| Colorectum | MSS |  |
| Colorectum | MSI-H |  |
| Colorectum | FAP |  |
| ∗Top 15 enriched GO BP terms are showed in the bar plot of each disease state in each tissue. Each row represents a significant GO biological process which is colored according to the -log10(p.adjust). |
| Page: 1 2 3 4 5 6 7 8 9 |
| GO ID | Tissue | Disease Stage | Description | Gene Ratio | Bg Ratio | pvalue | p.adjust | Count |
| GO:0071108 | Colorectum | MSS | protein K48-linked deubiquitination | 13/3467 | 35/18723 | 7.38e-03 | 4.68e-02 | 13 |
| GO:00706463 | Esophagus | HGIN | protein modification by small protein removal | 34/2587 | 157/18723 | 4.68e-03 | 4.02e-02 | 34 |
| GO:007064612 | Esophagus | ESCC | protein modification by small protein removal | 95/8552 | 157/18723 | 1.25e-04 | 8.56e-04 | 95 |
| GO:00165793 | Esophagus | ESCC | protein deubiquitination | 79/8552 | 139/18723 | 5.23e-03 | 1.97e-02 | 79 |
| GO:0070646 | Liver | NAFLD | protein modification by small protein removal | 29/1882 | 157/18723 | 9.11e-04 | 1.09e-02 | 29 |
| GO:0016579 | Liver | NAFLD | protein deubiquitination | 26/1882 | 139/18723 | 1.35e-03 | 1.52e-02 | 26 |
| GO:00711082 | Liver | NAFLD | protein K48-linked deubiquitination | 9/1882 | 35/18723 | 6.47e-03 | 4.69e-02 | 9 |
| GO:00706461 | Liver | HCC | protein modification by small protein removal | 91/7958 | 157/18723 | 6.50e-05 | 5.92e-04 | 91 |
| GO:00165791 | Liver | HCC | protein deubiquitination | 78/7958 | 139/18723 | 8.13e-04 | 4.87e-03 | 78 |
| GO:00711081 | Liver | HCC | protein K48-linked deubiquitination | 23/7958 | 35/18723 | 4.72e-03 | 2.02e-02 | 23 |
| GO:00706465 | Thyroid | PTC | protein modification by small protein removal | 71/5968 | 157/18723 | 3.03e-04 | 2.12e-03 | 71 |
| GO:00165794 | Thyroid | PTC | protein deubiquitination | 59/5968 | 139/18723 | 5.50e-03 | 2.50e-02 | 59 |
| GO:007064613 | Thyroid | ATC | protein modification by small protein removal | 71/6293 | 157/18723 | 1.59e-03 | 7.99e-03 | 71 |
| Page: 1 |
| Pathway ID | Tissue | Disease Stage | Description | Gene Ratio | Bg Ratio | pvalue | p.adjust | qvalue | Count |
| Page: 1 |
Top |
Cell-cell communication analysis |
| Identification of potential cell-cell interactions between two cell types and their ligand-receptor pairs for different disease states |
| Ligand | Receptor | LRpair | Pathway | Tissue | Disease Stage |
| Page: 1 |
Top |
Single-cell gene regulatory network inference analysis |
| Find out the significant the regulons (TFs) and the target genes of each regulon across cell types for different disease states |
| TF | Cell Type | Tissue | Disease Stage | Target Gene | RSS | Regulon Activity |
| ∗The dot plots of a searched regulon are shown for all cell subpopulations in each disease state of each tissue based on the regulon specific score inferred using pySCENIC and by calculating the average expression. |
| Page: 1 |
Top |
Somatic mutation of malignant transformation related genes |
| Annotation of somatic variants for genes involved in malignant transformation |
| Hugo Symbol | Variant Class | Variant Classification | dbSNP RS | HGVSc | HGVSp | HGVSp Short | SWISSPROT | BIOTYPE | SIFT | PolyPhen | Tumor Sample Barcode | Tissue | Histology | Sex | Age | Stage | Therapy Types | Drugs | Outcome |
| MINDY2 | SNV | Missense_Mutation | novel | c.344C>T | p.Ala115Val | p.A115V | Q8NBR6 | protein_coding | deleterious_low_confidence(0) | benign(0.037) | TCGA-BH-A0E0-01 | Breast | breast invasive carcinoma | Female | <65 | III/IV | Chemotherapy | docetaxel | SD |
| MINDY2 | deletion | Frame_Shift_Del | novel | c.878delN | p.Glu293GlyfsTer3 | p.E293Gfs*3 | Q8NBR6 | protein_coding | TCGA-D8-A27V-01 | Breast | breast invasive carcinoma | Female | <65 | I/II | Hormone Therapy | tamoxiphen | SD | ||
| MINDY2 | SNV | Missense_Mutation | rs764573238 | c.1795N>T | p.Arg599Cys | p.R599C | Q8NBR6 | protein_coding | deleterious(0) | probably_damaging(0.996) | TCGA-A6-6654-01 | Colorectum | colon adenocarcinoma | Female | >=65 | III/IV | Chemotherapy | oxaliplatin | SD |
| MINDY2 | SNV | Missense_Mutation | c.148N>A | p.Gly50Ser | p.G50S | Q8NBR6 | protein_coding | deleterious_low_confidence(0.03) | benign(0.001) | TCGA-AM-5821-01 | Colorectum | colon adenocarcinoma | Female | >=65 | I/II | Unknown | Unknown | SD | |
| MINDY2 | SNV | Missense_Mutation | c.149G>A | p.Gly50Asp | p.G50D | Q8NBR6 | protein_coding | deleterious_low_confidence(0.02) | benign(0.027) | TCGA-CK-4951-01 | Colorectum | colon adenocarcinoma | Female | >=65 | I/II | Unknown | Unknown | PD | |
| MINDY2 | SNV | Missense_Mutation | c.577A>G | p.Ser193Gly | p.S193G | Q8NBR6 | protein_coding | tolerated_low_confidence(0.07) | benign(0.373) | TCGA-F4-6570-01 | Colorectum | colon adenocarcinoma | Female | >=65 | I/II | Unknown | Unknown | SD | |
| MINDY2 | SNV | Missense_Mutation | novel | c.154N>G | p.Asn52Asp | p.N52D | Q8NBR6 | protein_coding | tolerated_low_confidence(0.37) | benign(0) | TCGA-G4-6294-01 | Colorectum | colon adenocarcinoma | Male | >=65 | III/IV | Chemotherapy | fluorouracil | PD |
| MINDY2 | SNV | Missense_Mutation | c.794N>T | p.Pro265Leu | p.P265L | Q8NBR6 | protein_coding | deleterious(0) | probably_damaging(1) | TCGA-WS-AB45-01 | Colorectum | colon adenocarcinoma | Female | <65 | I/II | Unknown | Unknown | SD | |
| MINDY2 | SNV | Missense_Mutation | c.564N>A | p.Ser188Arg | p.S188R | Q8NBR6 | protein_coding | deleterious_low_confidence(0) | possibly_damaging(0.723) | TCGA-AG-A002-01 | Colorectum | rectum adenocarcinoma | Male | <65 | I/II | Unknown | Unknown | SD | |
| MINDY2 | insertion | In_Frame_Ins | novel | c.1098_1099insAAG | p.Tyr366_His367insLys | p.Y366_H367insK | Q8NBR6 | protein_coding | TCGA-AM-5820-01 | Colorectum | colon adenocarcinoma | Female | <65 | I/II | Unknown | Unknown | SD |
| Page: 1 2 3 4 5 |
Top |
Related drugs of malignant transformation related genes |
| Identification of chemicals and drugs interact with genes involved in malignant transfromation |
| (DGIdb 4.0) |
| Entrez ID | Symbol | Category | Interaction Types | Drug Claim Name | Drug Name | PMIDs |
| Page: 1 |

Copyright 2023-Present -The University of Texas Health Science Center at Houston |