
|
|||||
|
 | |
| |
| |
| |
| |
| |
|
Gene: MIIP |
Gene summary for MIIP |
| Gene information | Species | Human | Gene symbol | MIIP | Gene ID | 60672 |
| Gene name | migration and invasion inhibitory protein | |
| Gene Alias | IIP45 | |
| Cytomap | 1p36.22 | |
| Gene Type | protein-coding | GO ID | GO:0000086 | UniProtAcc | Q5JXC2 |
Top |
Malignant transformation analysis |
| Identification of the aberrant gene expression in precancerous and cancerous lesions by comparing the gene expression of stem-like cells in diseased tissues with normal stem cells |
| Entrez ID | Symbol | Replicates | Species | Organ | Tissue | Adj P-value | Log2FC | Malignancy |
| 60672 | MIIP | LZE4T | Human | Esophagus | ESCC | 3.20e-04 | 1.19e-01 | 0.0811 |
| 60672 | MIIP | LZE7T | Human | Esophagus | ESCC | 1.20e-10 | 5.72e-01 | 0.0667 |
| 60672 | MIIP | LZE8T | Human | Esophagus | ESCC | 5.75e-03 | 1.34e-01 | 0.067 |
| 60672 | MIIP | LZE20T | Human | Esophagus | ESCC | 8.44e-05 | 1.09e-01 | 0.0662 |
| 60672 | MIIP | LZE24T | Human | Esophagus | ESCC | 1.02e-19 | 5.06e-01 | 0.0596 |
| 60672 | MIIP | LZE21T | Human | Esophagus | ESCC | 2.24e-06 | 3.54e-01 | 0.0655 |
| 60672 | MIIP | LZE6T | Human | Esophagus | ESCC | 4.14e-07 | 3.49e-01 | 0.0845 |
| 60672 | MIIP | P1T-E | Human | Esophagus | ESCC | 3.88e-05 | 2.08e-01 | 0.0875 |
| 60672 | MIIP | P2T-E | Human | Esophagus | ESCC | 1.78e-26 | 4.03e-01 | 0.1177 |
| 60672 | MIIP | P4T-E | Human | Esophagus | ESCC | 1.50e-17 | 4.37e-01 | 0.1323 |
| 60672 | MIIP | P5T-E | Human | Esophagus | ESCC | 1.78e-28 | 4.36e-01 | 0.1327 |
| 60672 | MIIP | P8T-E | Human | Esophagus | ESCC | 1.38e-17 | 2.99e-01 | 0.0889 |
| 60672 | MIIP | P9T-E | Human | Esophagus | ESCC | 2.20e-11 | 2.32e-01 | 0.1131 |
| 60672 | MIIP | P10T-E | Human | Esophagus | ESCC | 7.18e-31 | 4.37e-01 | 0.116 |
| 60672 | MIIP | P11T-E | Human | Esophagus | ESCC | 1.10e-12 | 5.63e-01 | 0.1426 |
| 60672 | MIIP | P12T-E | Human | Esophagus | ESCC | 7.41e-21 | 3.17e-01 | 0.1122 |
| 60672 | MIIP | P15T-E | Human | Esophagus | ESCC | 4.18e-18 | 3.43e-01 | 0.1149 |
| 60672 | MIIP | P16T-E | Human | Esophagus | ESCC | 6.51e-18 | 3.68e-01 | 0.1153 |
| 60672 | MIIP | P17T-E | Human | Esophagus | ESCC | 1.26e-15 | 5.52e-01 | 0.1278 |
| 60672 | MIIP | P19T-E | Human | Esophagus | ESCC | 3.48e-15 | 8.23e-01 | 0.1662 |
| Page: 1 2 3 4 5 |
| Tissue | Expression Dynamics | Abbreviation |
| Esophagus | 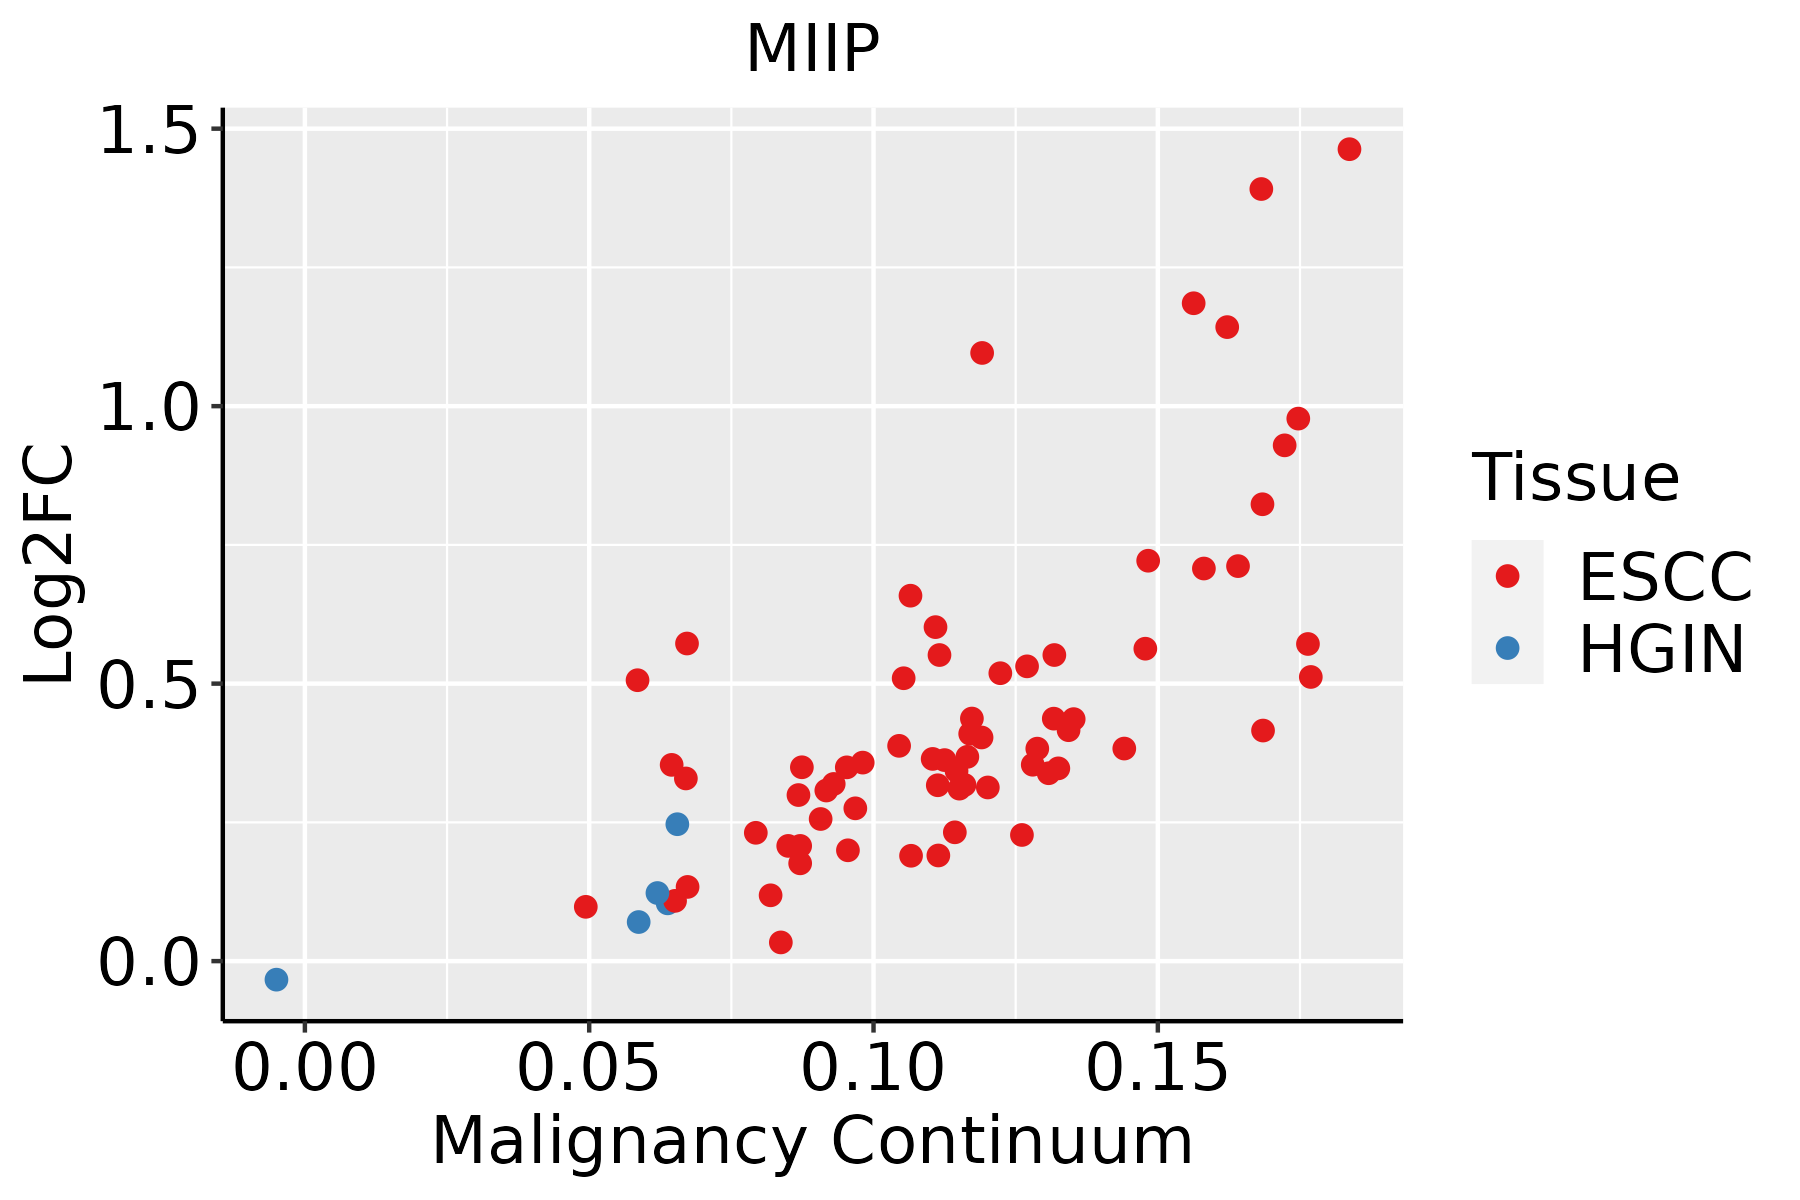 | ESCC: Esophageal squamous cell carcinoma |
| HGIN: High-grade intraepithelial neoplasias | ||
| LGIN: Low-grade intraepithelial neoplasias | ||
| Liver | 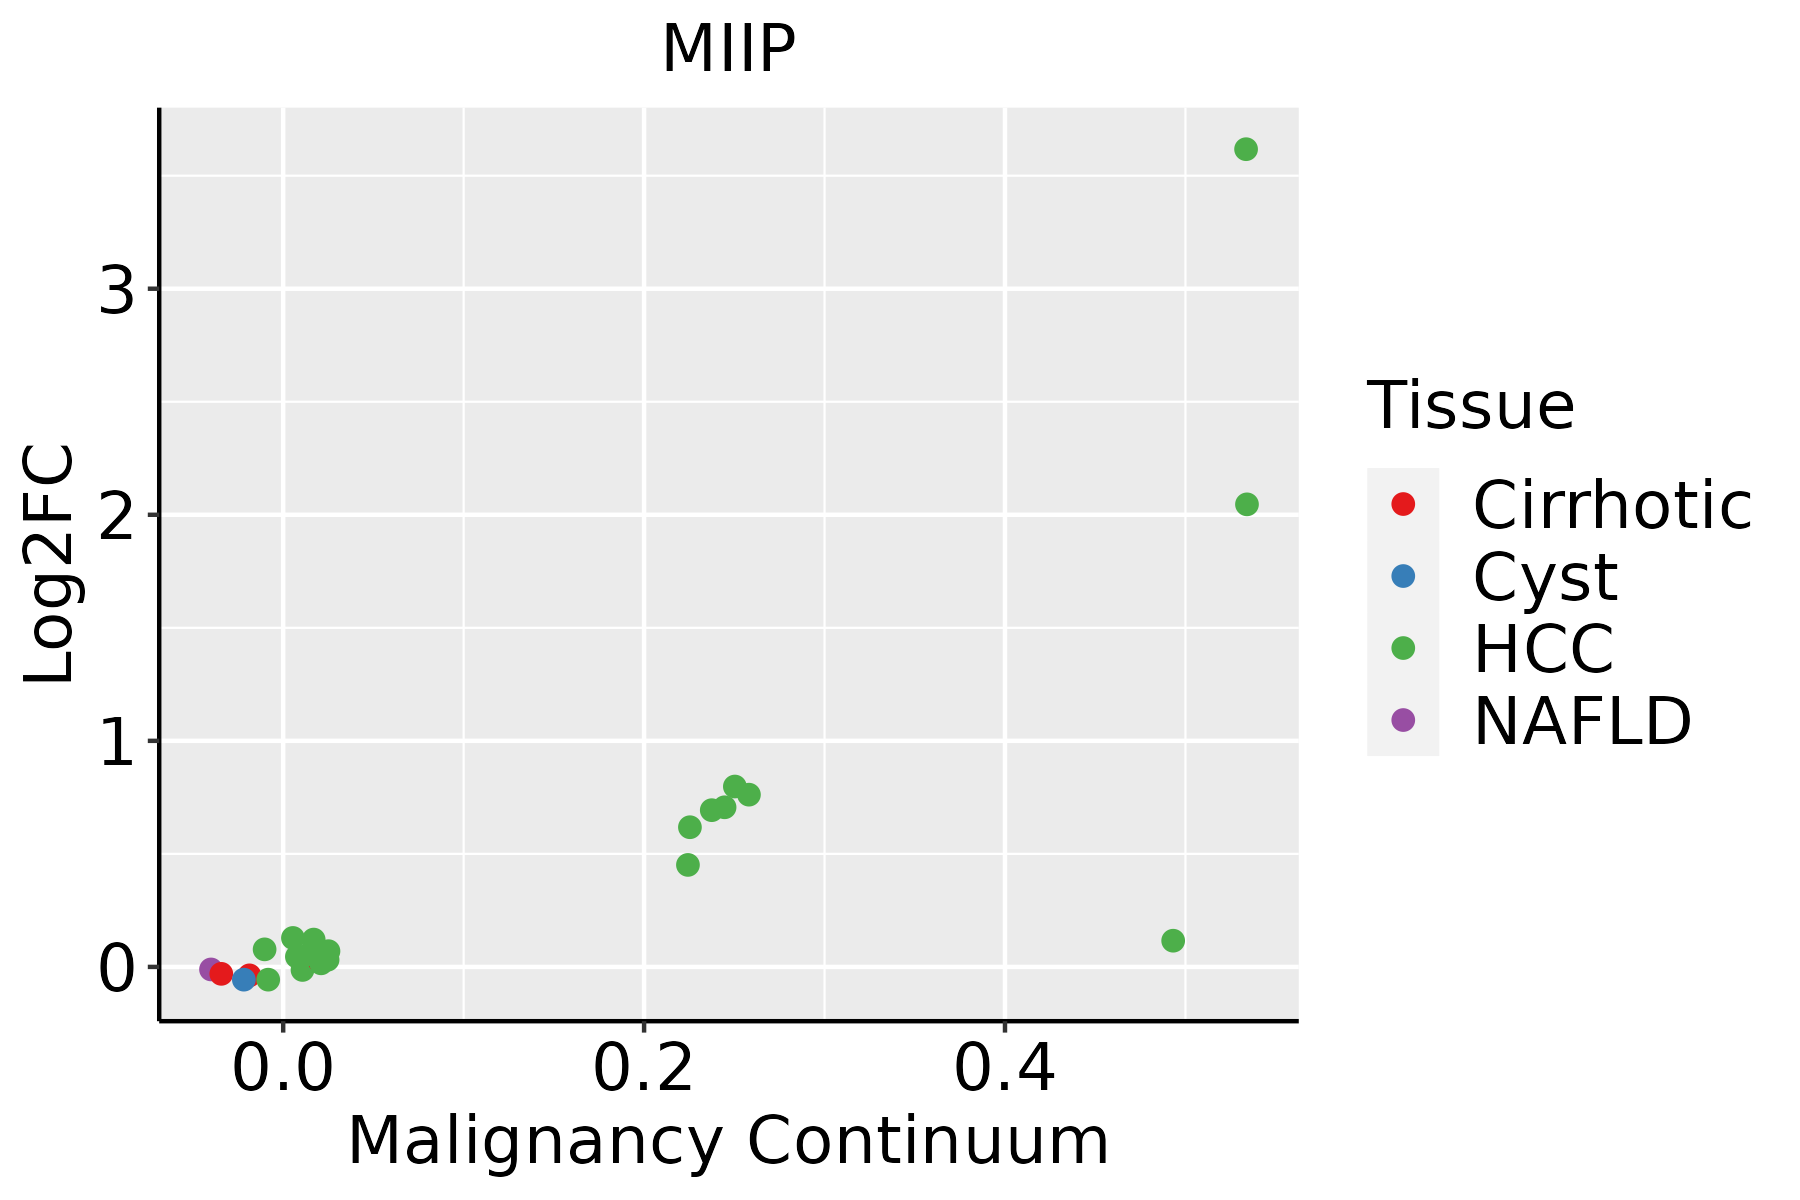 | HCC: Hepatocellular carcinoma |
| NAFLD: Non-alcoholic fatty liver disease | ||
| Oral Cavity | 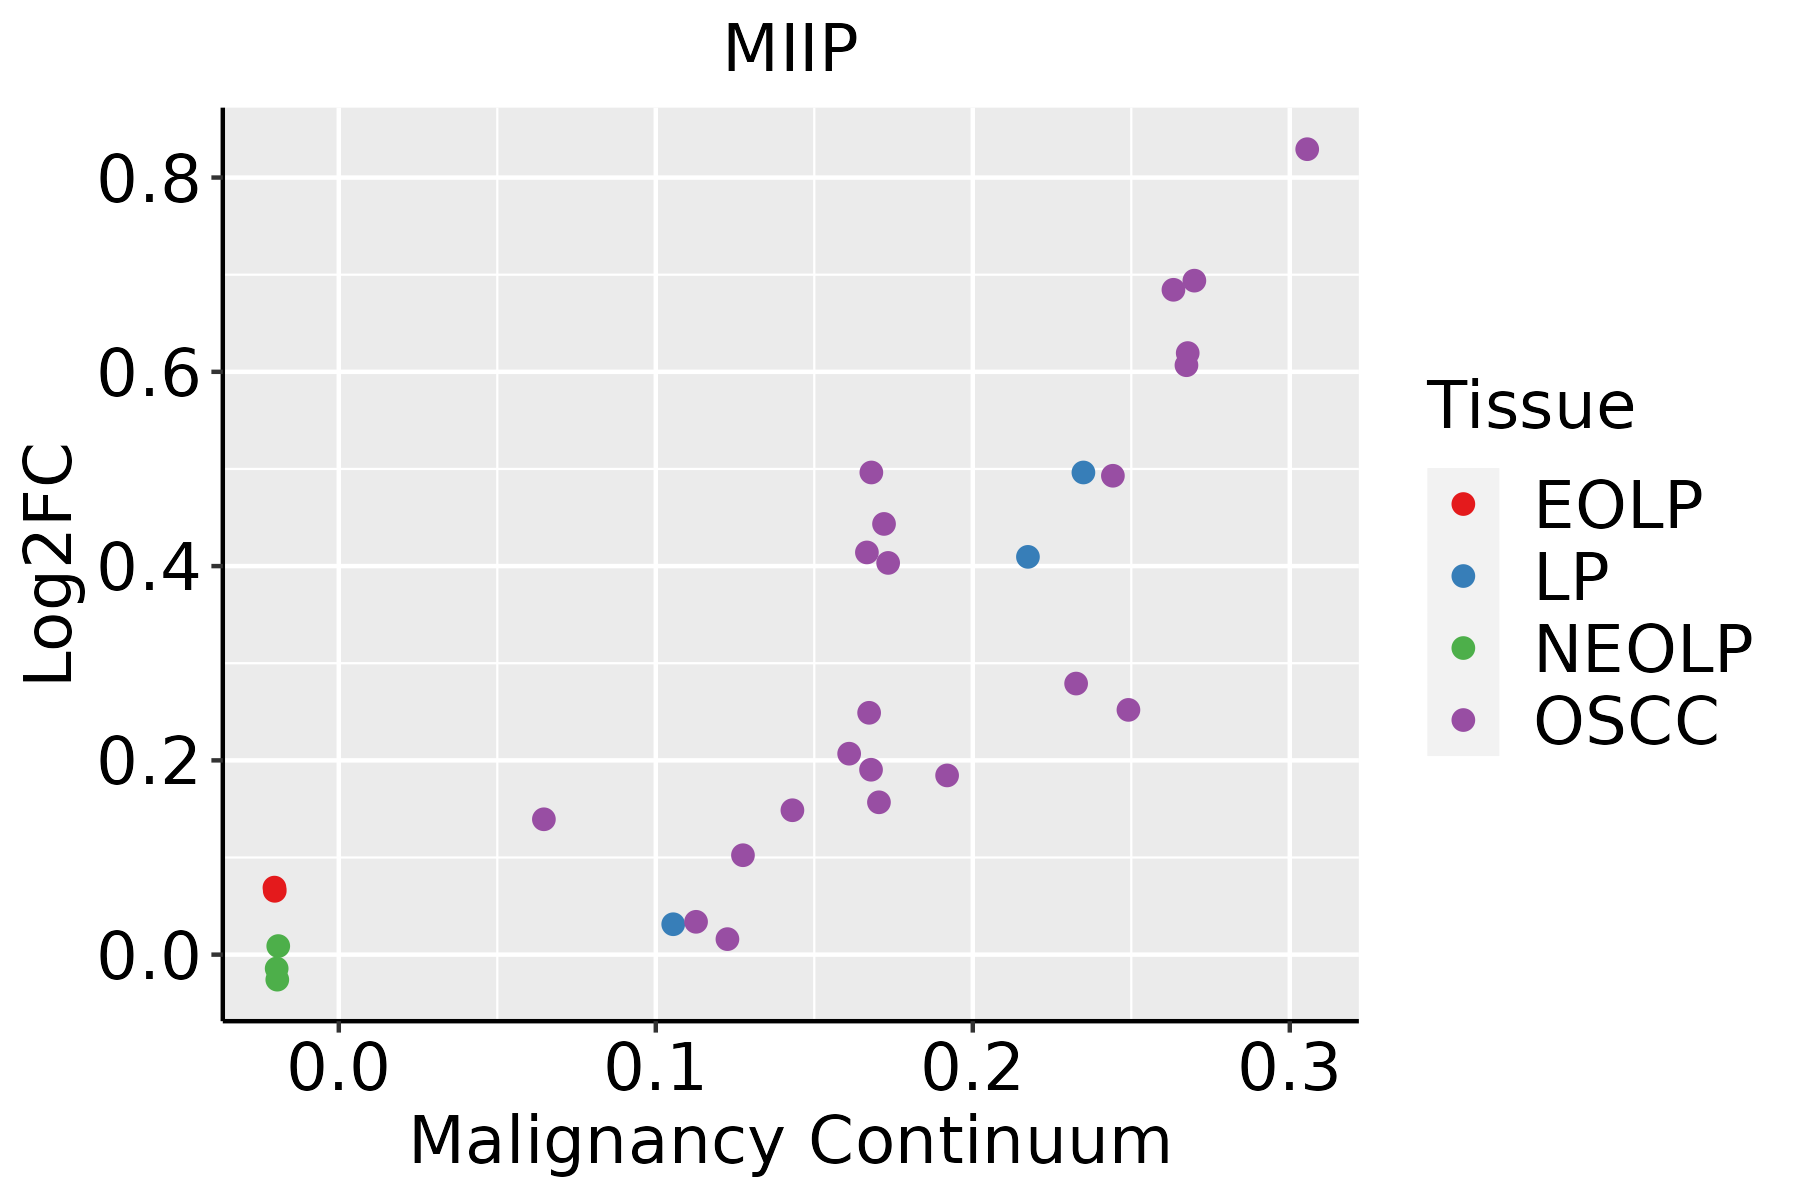 | EOLP: Erosive Oral lichen planus |
| LP: leukoplakia | ||
| NEOLP: Non-erosive oral lichen planus | ||
| OSCC: Oral squamous cell carcinoma | ||
| Skin | 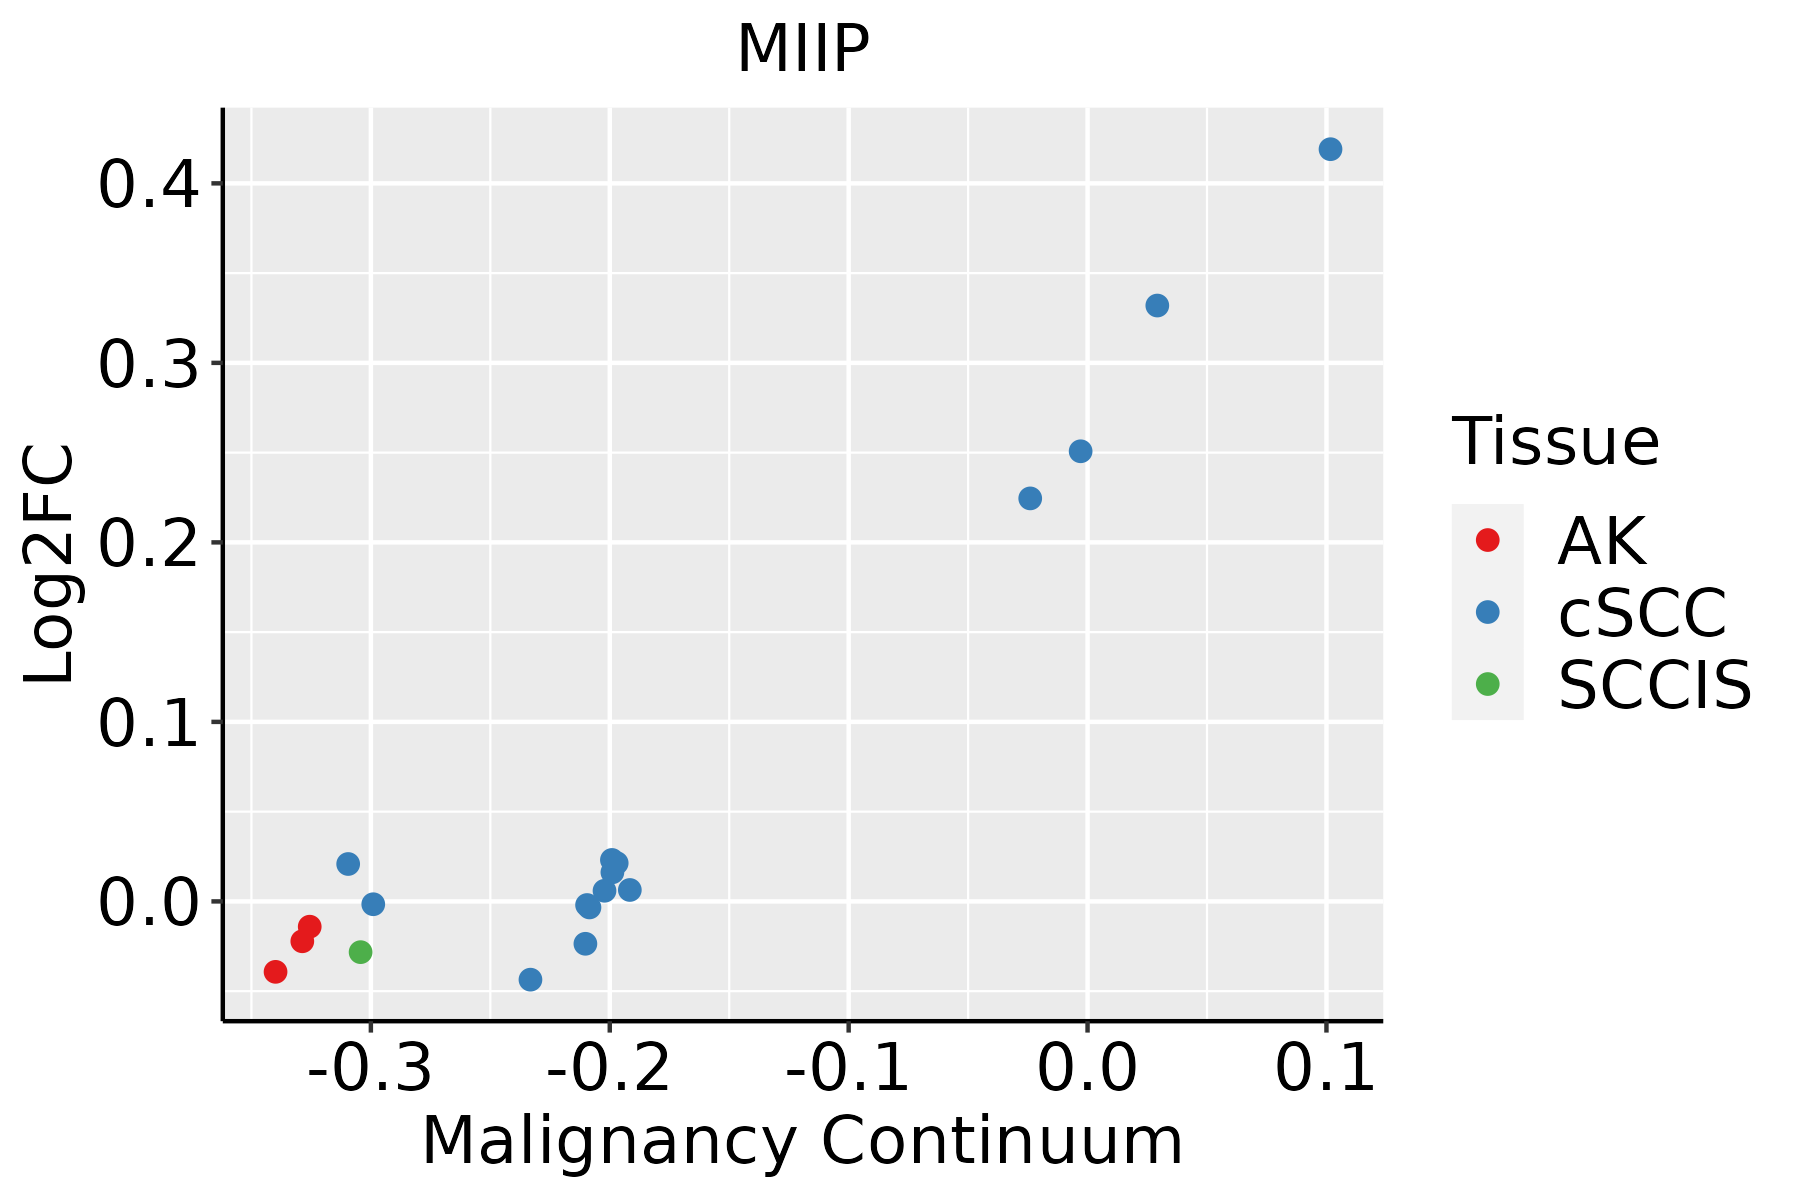 | AK: Actinic keratosis |
| cSCC: Cutaneous squamous cell carcinoma | ||
| SCCIS:squamous cell carcinoma in situ |
| ∗log2FC in expression of this searched gene in stem-like cells from each diseased tissue sample relative to stem-like cells in normal samples in each tissue plotted against the malignancy continuum. Samples are colored based on if they are from different disease stage. |
Top |
Malignant transformation related pathway analysis |
| Find out the enriched GO biological processes and KEGG pathways involved in transition from healthy to precancer to cancer |
| Tissue | Disease Stage | Enriched GO biological Processes |
| Colorectum | AD |  |
| Colorectum | SER |  |
| Colorectum | MSS |  |
| Colorectum | MSI-H |  |
| Colorectum | FAP |  |
| ∗Top 15 enriched GO BP terms are showed in the bar plot of each disease state in each tissue. Each row represents a significant GO biological process which is colored according to the -log10(p.adjust). |
| Page: 1 2 3 4 5 6 7 8 9 |
| GO ID | Tissue | Disease Stage | Description | Gene Ratio | Bg Ratio | pvalue | p.adjust | Count |
| GO:004477216 | Esophagus | ESCC | mitotic cell cycle phase transition | 281/8552 | 424/18723 | 4.63e-18 | 4.45e-16 | 281 |
| GO:000734615 | Esophagus | ESCC | regulation of mitotic cell cycle | 293/8552 | 457/18723 | 8.00e-16 | 5.64e-14 | 293 |
| GO:190198713 | Esophagus | ESCC | regulation of cell cycle phase transition | 242/8552 | 390/18723 | 3.86e-11 | 1.26e-09 | 242 |
| GO:190199013 | Esophagus | ESCC | regulation of mitotic cell cycle phase transition | 191/8552 | 299/18723 | 1.35e-10 | 3.94e-09 | 191 |
| GO:00457865 | Esophagus | ESCC | negative regulation of cell cycle | 236/8552 | 385/18723 | 3.62e-10 | 9.93e-09 | 236 |
| GO:00448394 | Esophagus | ESCC | cell cycle G2/M phase transition | 103/8552 | 148/18723 | 3.09e-09 | 6.67e-08 | 103 |
| GO:00000864 | Esophagus | ESCC | G2/M transition of mitotic cell cycle | 96/8552 | 137/18723 | 6.00e-09 | 1.23e-07 | 96 |
| GO:00109484 | Esophagus | ESCC | negative regulation of cell cycle process | 177/8552 | 294/18723 | 3.26e-07 | 4.59e-06 | 177 |
| GO:19019883 | Esophagus | ESCC | negative regulation of cell cycle phase transition | 151/8552 | 249/18723 | 1.28e-06 | 1.57e-05 | 151 |
| GO:004593013 | Esophagus | ESCC | negative regulation of mitotic cell cycle | 143/8552 | 235/18723 | 1.84e-06 | 2.15e-05 | 143 |
| GO:190199113 | Esophagus | ESCC | negative regulation of mitotic cell cycle phase transition | 112/8552 | 179/18723 | 3.69e-06 | 4.03e-05 | 112 |
| GO:00103891 | Esophagus | ESCC | regulation of G2/M transition of mitotic cell cycle | 64/8552 | 94/18723 | 9.21e-06 | 8.82e-05 | 64 |
| GO:19027491 | Esophagus | ESCC | regulation of cell cycle G2/M phase transition | 68/8552 | 102/18723 | 1.48e-05 | 1.33e-04 | 68 |
| GO:00109721 | Esophagus | ESCC | negative regulation of G2/M transition of mitotic cell cycle | 41/8552 | 60/18723 | 3.25e-04 | 1.91e-03 | 41 |
| GO:19027501 | Esophagus | ESCC | negative regulation of cell cycle G2/M phase transition | 42/8552 | 62/18723 | 3.69e-04 | 2.14e-03 | 42 |
| GO:00447722 | Liver | HCC | mitotic cell cycle phase transition | 240/7958 | 424/18723 | 2.47e-09 | 6.84e-08 | 240 |
| GO:000734611 | Liver | HCC | regulation of mitotic cell cycle | 255/7958 | 457/18723 | 4.96e-09 | 1.30e-07 | 255 |
| GO:19019901 | Liver | HCC | regulation of mitotic cell cycle phase transition | 167/7958 | 299/18723 | 1.96e-06 | 2.71e-05 | 167 |
| GO:19019871 | Liver | HCC | regulation of cell cycle phase transition | 211/7958 | 390/18723 | 2.11e-06 | 2.89e-05 | 211 |
| GO:0045786 | Liver | HCC | negative regulation of cell cycle | 204/7958 | 385/18723 | 1.84e-05 | 1.99e-04 | 204 |
| Page: 1 2 3 4 |
| Pathway ID | Tissue | Disease Stage | Description | Gene Ratio | Bg Ratio | pvalue | p.adjust | qvalue | Count |
| Page: 1 |
Top |
Cell-cell communication analysis |
| Identification of potential cell-cell interactions between two cell types and their ligand-receptor pairs for different disease states |
| Ligand | Receptor | LRpair | Pathway | Tissue | Disease Stage |
| Page: 1 |
Top |
Single-cell gene regulatory network inference analysis |
| Find out the significant the regulons (TFs) and the target genes of each regulon across cell types for different disease states |
| TF | Cell Type | Tissue | Disease Stage | Target Gene | RSS | Regulon Activity |
| ∗The dot plots of a searched regulon are shown for all cell subpopulations in each disease state of each tissue based on the regulon specific score inferred using pySCENIC and by calculating the average expression. |
| Page: 1 |
Top |
Somatic mutation of malignant transformation related genes |
| Annotation of somatic variants for genes involved in malignant transformation |
| Hugo Symbol | Variant Class | Variant Classification | dbSNP RS | HGVSc | HGVSp | HGVSp Short | SWISSPROT | BIOTYPE | SIFT | PolyPhen | Tumor Sample Barcode | Tissue | Histology | Sex | Age | Stage | Therapy Types | Drugs | Outcome |
| MIIP | SNV | Missense_Mutation | c.397N>A | p.Asp133Asn | p.D133N | Q5JXC2 | protein_coding | tolerated(0.19) | benign(0.342) | TCGA-A2-A0EQ-01 | Breast | breast invasive carcinoma | Female | <65 | I/II | Chemotherapy | adriamycin | SD | |
| MIIP | SNV | Missense_Mutation | novel | c.574A>C | p.Thr192Pro | p.T192P | Q5JXC2 | protein_coding | deleterious(0) | possibly_damaging(0.731) | TCGA-A2-A1G4-01 | Breast | breast invasive carcinoma | Female | >=65 | III/IV | Chemotherapy | adriamycin | SD |
| MIIP | SNV | Missense_Mutation | rs779477951 | c.616N>T | p.Arg206Trp | p.R206W | Q5JXC2 | protein_coding | deleterious(0) | probably_damaging(0.999) | TCGA-E2-A150-01 | Breast | breast invasive carcinoma | Female | <65 | I/II | Chemotherapy | doxorubicin | SD |
| MIIP | insertion | Nonsense_Mutation | novel | c.248_249insGAGATCGAGACCATCCTGGCTAACACGGTGAAAC | p.Asp83GlufsTer11 | p.D83Efs*11 | Q5JXC2 | protein_coding | TCGA-AN-A04C-01 | Breast | breast invasive carcinoma | Female | <65 | I/II | Unknown | Unknown | SD | ||
| MIIP | SNV | Missense_Mutation | c.1047N>C | p.Gln349His | p.Q349H | Q5JXC2 | protein_coding | tolerated(0.19) | possibly_damaging(0.834) | TCGA-EK-A3GK-01 | Cervix | cervical & endocervical cancer | Female | <65 | I/II | Unknown | Unknown | SD | |
| MIIP | SNV | Missense_Mutation | c.232G>A | p.Asp78Asn | p.D78N | Q5JXC2 | protein_coding | deleterious(0.02) | possibly_damaging(0.55) | TCGA-AA-3864-01 | Colorectum | colon adenocarcinoma | Male | >=65 | I/II | Unknown | Unknown | SD | |
| MIIP | SNV | Missense_Mutation | rs541833150 | c.898N>T | p.Arg300Trp | p.R300W | Q5JXC2 | protein_coding | deleterious(0) | probably_damaging(0.942) | TCGA-AD-6888-01 | Colorectum | colon adenocarcinoma | Male | >=65 | III/IV | Unknown | Unknown | PD |
| MIIP | SNV | Missense_Mutation | rs779477951 | c.616C>T | p.Arg206Trp | p.R206W | Q5JXC2 | protein_coding | deleterious(0) | probably_damaging(0.999) | TCGA-AZ-4315-01 | Colorectum | colon adenocarcinoma | Male | <65 | I/II | Unknown | Unknown | SD |
| MIIP | SNV | Missense_Mutation | c.875C>T | p.Pro292Leu | p.P292L | Q5JXC2 | protein_coding | deleterious(0) | possibly_damaging(0.645) | TCGA-CK-4951-01 | Colorectum | colon adenocarcinoma | Female | >=65 | I/II | Unknown | Unknown | PD | |
| MIIP | SNV | Missense_Mutation | novel | c.311N>G | p.Glu104Gly | p.E104G | Q5JXC2 | protein_coding | tolerated(0.21) | benign(0.022) | TCGA-F4-6808-01 | Colorectum | colon adenocarcinoma | Female | <65 | I/II | Unknown | Unknown | SD |
| Page: 1 2 3 4 |
Top |
Related drugs of malignant transformation related genes |
| Identification of chemicals and drugs interact with genes involved in malignant transfromation |
| (DGIdb 4.0) |
| Entrez ID | Symbol | Category | Interaction Types | Drug Claim Name | Drug Name | PMIDs |
| Page: 1 |

Copyright 2023-Present -The University of Texas Health Science Center at Houston |