
|
|||||
|
 | |
| |
| |
| |
| |
| |
|
Gene: MIGA1 |
Gene summary for MIGA1 |
| Gene information | Species | Human | Gene symbol | MIGA1 | Gene ID | 374986 |
| Gene name | mitoguardin 1 | |
| Gene Alias | FAM73A | |
| Cytomap | 1p31.1 | |
| Gene Type | protein-coding | GO ID | GO:0006996 | UniProtAcc | B4DK63 |
Top |
Malignant transformation analysis |
| Identification of the aberrant gene expression in precancerous and cancerous lesions by comparing the gene expression of stem-like cells in diseased tissues with normal stem cells |
| Entrez ID | Symbol | Replicates | Species | Organ | Tissue | Adj P-value | Log2FC | Malignancy |
| 374986 | MIGA1 | HCC1 | Human | Liver | HCC | 9.60e-29 | 4.78e+00 | 0.5336 |
| 374986 | MIGA1 | HCC2 | Human | Liver | HCC | 2.56e-42 | 4.38e+00 | 0.5341 |
| 374986 | MIGA1 | HCC5 | Human | Liver | HCC | 2.98e-39 | 2.89e+00 | 0.4932 |
| 374986 | MIGA1 | S014 | Human | Liver | HCC | 1.31e-12 | 4.23e-01 | 0.2254 |
| 374986 | MIGA1 | S015 | Human | Liver | HCC | 7.46e-20 | 8.78e-01 | 0.2375 |
| 374986 | MIGA1 | S016 | Human | Liver | HCC | 2.10e-16 | 5.17e-01 | 0.2243 |
| 374986 | MIGA1 | S027 | Human | Liver | HCC | 9.05e-09 | 5.68e-01 | 0.2446 |
| 374986 | MIGA1 | S028 | Human | Liver | HCC | 2.28e-16 | 6.18e-01 | 0.2503 |
| 374986 | MIGA1 | S029 | Human | Liver | HCC | 3.88e-14 | 4.63e-01 | 0.2581 |
| 374986 | MIGA1 | male-WTA | Human | Thyroid | PTC | 7.89e-12 | 2.21e-02 | 0.1037 |
| 374986 | MIGA1 | PTC01 | Human | Thyroid | PTC | 2.34e-12 | 1.68e-01 | 0.1899 |
| 374986 | MIGA1 | PTC03 | Human | Thyroid | PTC | 7.99e-05 | 1.01e-01 | 0.1784 |
| 374986 | MIGA1 | PTC04 | Human | Thyroid | PTC | 2.80e-19 | 2.84e-01 | 0.1927 |
| 374986 | MIGA1 | PTC05 | Human | Thyroid | PTC | 5.32e-22 | 6.64e-01 | 0.2065 |
| 374986 | MIGA1 | PTC06 | Human | Thyroid | PTC | 3.08e-33 | 6.68e-01 | 0.2057 |
| 374986 | MIGA1 | PTC07 | Human | Thyroid | PTC | 9.66e-37 | 6.24e-01 | 0.2044 |
| 374986 | MIGA1 | ATC11 | Human | Thyroid | ATC | 1.47e-05 | 4.44e-01 | 0.3386 |
| 374986 | MIGA1 | ATC12 | Human | Thyroid | ATC | 2.02e-21 | 4.34e-01 | 0.34 |
| 374986 | MIGA1 | ATC13 | Human | Thyroid | ATC | 1.65e-37 | 7.38e-01 | 0.34 |
| 374986 | MIGA1 | ATC2 | Human | Thyroid | ATC | 4.52e-13 | 8.66e-01 | 0.34 |
| Page: 1 2 |
| Tissue | Expression Dynamics | Abbreviation |
| Liver |  | HCC: Hepatocellular carcinoma |
| NAFLD: Non-alcoholic fatty liver disease | ||
| Thyroid | 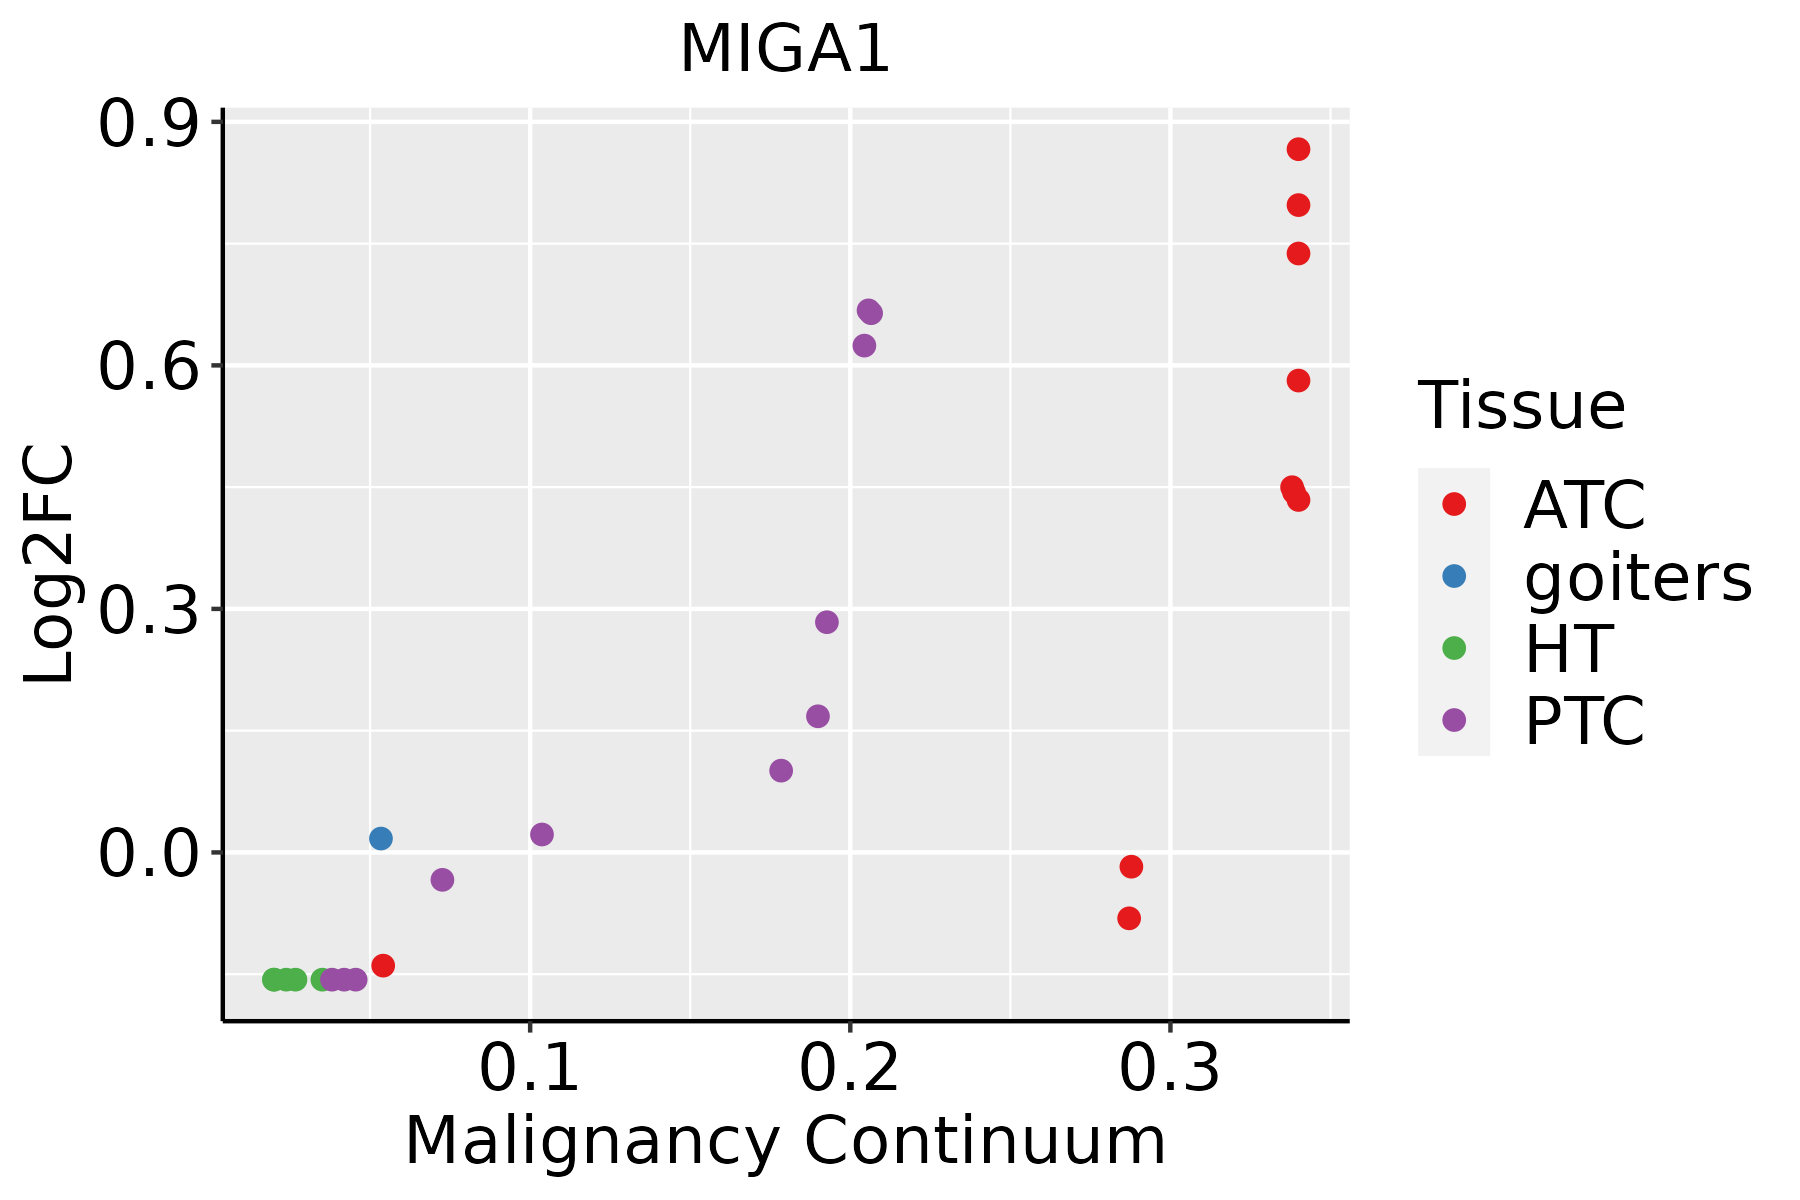 | ATC: Anaplastic thyroid cancer |
| HT: Hashimoto's thyroiditis | ||
| PTC: Papillary thyroid cancer |
| ∗log2FC in expression of this searched gene in stem-like cells from each diseased tissue sample relative to stem-like cells in normal samples in each tissue plotted against the malignancy continuum. Samples are colored based on if they are from different disease stage. |
Top |
Malignant transformation related pathway analysis |
| Find out the enriched GO biological processes and KEGG pathways involved in transition from healthy to precancer to cancer |
| Tissue | Disease Stage | Enriched GO biological Processes |
| Colorectum | AD |  |
| Colorectum | SER |  |
| Colorectum | MSS |  |
| Colorectum | MSI-H |  |
| Colorectum | FAP |  |
| ∗Top 15 enriched GO BP terms are showed in the bar plot of each disease state in each tissue. Each row represents a significant GO biological process which is colored according to the -log10(p.adjust). |
| Page: 1 2 3 4 5 6 7 8 9 |
| GO ID | Tissue | Disease Stage | Description | Gene Ratio | Bg Ratio | pvalue | p.adjust | Count |
| GO:004828411 | Liver | HCC | organelle fusion | 84/7958 | 141/18723 | 3.13e-05 | 3.20e-04 | 84 |
| GO:0008053 | Liver | HCC | mitochondrial fusion | 19/7958 | 27/18723 | 3.18e-03 | 1.47e-02 | 19 |
| GO:00482846 | Thyroid | PTC | organelle fusion | 71/5968 | 141/18723 | 3.68e-06 | 4.70e-05 | 71 |
| GO:00080534 | Thyroid | PTC | mitochondrial fusion | 15/5968 | 27/18723 | 9.19e-03 | 3.79e-02 | 15 |
| GO:004828413 | Thyroid | ATC | organelle fusion | 71/6293 | 141/18723 | 2.83e-05 | 2.38e-04 | 71 |
| Page: 1 |
| Pathway ID | Tissue | Disease Stage | Description | Gene Ratio | Bg Ratio | pvalue | p.adjust | qvalue | Count |
| Page: 1 |
Top |
Cell-cell communication analysis |
| Identification of potential cell-cell interactions between two cell types and their ligand-receptor pairs for different disease states |
| Ligand | Receptor | LRpair | Pathway | Tissue | Disease Stage |
| Page: 1 |
Top |
Single-cell gene regulatory network inference analysis |
| Find out the significant the regulons (TFs) and the target genes of each regulon across cell types for different disease states |
| TF | Cell Type | Tissue | Disease Stage | Target Gene | RSS | Regulon Activity |
| ∗The dot plots of a searched regulon are shown for all cell subpopulations in each disease state of each tissue based on the regulon specific score inferred using pySCENIC and by calculating the average expression. |
| Page: 1 |
Top |
Somatic mutation of malignant transformation related genes |
| Annotation of somatic variants for genes involved in malignant transformation |
| Hugo Symbol | Variant Class | Variant Classification | dbSNP RS | HGVSc | HGVSp | HGVSp Short | SWISSPROT | BIOTYPE | SIFT | PolyPhen | Tumor Sample Barcode | Tissue | Histology | Sex | Age | Stage | Therapy Types | Drugs | Outcome |
| MIGA1 | SNV | Missense_Mutation | c.442N>G | p.Gln148Glu | p.Q148E | protein_coding | tolerated(0.26) | possibly_damaging(0.688) | TCGA-AN-A0XW-01 | Breast | breast invasive carcinoma | Female | <65 | III/IV | Unknown | Unknown | SD | ||
| MIGA1 | SNV | Missense_Mutation | c.586N>T | p.Ile196Phe | p.I196F | protein_coding | tolerated(0.28) | benign(0.255) | TCGA-BH-A0HA-01 | Breast | breast invasive carcinoma | Female | <65 | I/II | Unknown | Unknown | SD | ||
| MIGA1 | SNV | Missense_Mutation | novel | c.235N>T | p.Thr79Ser | p.T79S | protein_coding | tolerated(0.06) | benign(0.047) | TCGA-EA-A410-01 | Cervix | cervical & endocervical cancer | Female | <65 | I/II | Unknown | Unknown | SD | |
| MIGA1 | SNV | Missense_Mutation | rs752875500 | c.68N>T | p.Gly23Val | p.G23V | protein_coding | deleterious_low_confidence(0) | benign(0.037) | TCGA-EK-A2GZ-01 | Cervix | cervical & endocervical cancer | Female | <65 | III/IV | Unknown | Unknown | SD | |
| MIGA1 | SNV | Missense_Mutation | c.41N>T | p.Ala14Val | p.A14V | protein_coding | deleterious_low_confidence(0) | benign(0.003) | TCGA-EK-A2PI-01 | Cervix | cervical & endocervical cancer | Female | <65 | III/IV | Unknown | Unknown | SD | ||
| MIGA1 | insertion | Frame_Shift_Ins | novel | c.1316_1317insT | p.Leu441PhefsTer9 | p.L441Ffs*9 | protein_coding | TCGA-EA-A3HS-01 | Cervix | cervical & endocervical cancer | Female | <65 | I/II | Unknown | Unknown | SD | |||
| MIGA1 | SNV | Missense_Mutation | c.1717N>T | p.Asp573Tyr | p.D573Y | protein_coding | deleterious(0) | probably_damaging(1) | TCGA-AA-3688-01 | Colorectum | colon adenocarcinoma | Male | >=65 | III/IV | Unknown | Unknown | SD | ||
| MIGA1 | SNV | Missense_Mutation | c.1854N>A | p.Ser618Arg | p.S618R | protein_coding | tolerated(0.25) | benign(0.119) | TCGA-AD-6895-01 | Colorectum | colon adenocarcinoma | Male | >=65 | III/IV | Unknown | Unknown | SD | ||
| MIGA1 | SNV | Missense_Mutation | c.169C>A | p.Leu57Met | p.L57M | protein_coding | tolerated(0.05) | possibly_damaging(0.813) | TCGA-AM-5821-01 | Colorectum | colon adenocarcinoma | Female | >=65 | I/II | Unknown | Unknown | SD | ||
| MIGA1 | SNV | Missense_Mutation | rs766210952 | c.290N>A | p.Arg97His | p.R97H | protein_coding | tolerated(0.08) | benign(0.249) | TCGA-CA-6717-01 | Colorectum | colon adenocarcinoma | Male | <65 | I/II | Chemotherapy | oxaliplatin | CR |
| Page: 1 2 3 4 5 6 7 8 |
Top |
Related drugs of malignant transformation related genes |
| Identification of chemicals and drugs interact with genes involved in malignant transfromation |
| (DGIdb 4.0) |
| Entrez ID | Symbol | Category | Interaction Types | Drug Claim Name | Drug Name | PMIDs |
| Page: 1 |

Copyright 2023-Present -The University of Texas Health Science Center at Houston |