
|
|||||
|
 | |
| |
| |
| |
| |
| |
|
Gene: MIF4GD |
Gene summary for MIF4GD |
| Gene information | Species | Human | Gene symbol | MIF4GD | Gene ID | 57409 |
| Gene name | MIF4G domain containing | |
| Gene Alias | AD023 | |
| Cytomap | 17q25.1 | |
| Gene Type | protein-coding | GO ID | GO:0006412 | UniProtAcc | A0A0S2Z5S7 |
Top |
Malignant transformation analysis |
| Identification of the aberrant gene expression in precancerous and cancerous lesions by comparing the gene expression of stem-like cells in diseased tissues with normal stem cells |
| Entrez ID | Symbol | Replicates | Species | Organ | Tissue | Adj P-value | Log2FC | Malignancy |
| 57409 | MIF4GD | LZE4T | Human | Esophagus | ESCC | 1.34e-02 | 1.54e-01 | 0.0811 |
| 57409 | MIF4GD | LZE7T | Human | Esophagus | ESCC | 4.93e-04 | 2.96e-01 | 0.0667 |
| 57409 | MIF4GD | LZE21D1 | Human | Esophagus | HGIN | 2.31e-02 | 2.59e-01 | 0.0632 |
| 57409 | MIF4GD | LZE22T | Human | Esophagus | ESCC | 1.59e-05 | 4.27e-01 | 0.068 |
| 57409 | MIF4GD | LZE24T | Human | Esophagus | ESCC | 9.25e-24 | 6.21e-01 | 0.0596 |
| 57409 | MIF4GD | LZE21T | Human | Esophagus | ESCC | 1.56e-04 | 3.27e-01 | 0.0655 |
| 57409 | MIF4GD | LZE6T | Human | Esophagus | ESCC | 3.87e-04 | 2.58e-01 | 0.0845 |
| 57409 | MIF4GD | P1T-E | Human | Esophagus | ESCC | 3.49e-06 | 2.57e-01 | 0.0875 |
| 57409 | MIF4GD | P2T-E | Human | Esophagus | ESCC | 1.64e-19 | 2.88e-01 | 0.1177 |
| 57409 | MIF4GD | P4T-E | Human | Esophagus | ESCC | 6.61e-15 | 3.71e-01 | 0.1323 |
| 57409 | MIF4GD | P5T-E | Human | Esophagus | ESCC | 3.32e-03 | 9.84e-02 | 0.1327 |
| 57409 | MIF4GD | P8T-E | Human | Esophagus | ESCC | 1.52e-14 | 2.45e-01 | 0.0889 |
| 57409 | MIF4GD | P9T-E | Human | Esophagus | ESCC | 8.89e-08 | 1.77e-01 | 0.1131 |
| 57409 | MIF4GD | P10T-E | Human | Esophagus | ESCC | 1.67e-08 | 2.35e-01 | 0.116 |
| 57409 | MIF4GD | P11T-E | Human | Esophagus | ESCC | 2.93e-10 | 4.15e-01 | 0.1426 |
| 57409 | MIF4GD | P12T-E | Human | Esophagus | ESCC | 1.72e-33 | 6.29e-01 | 0.1122 |
| 57409 | MIF4GD | P15T-E | Human | Esophagus | ESCC | 3.66e-13 | 2.93e-01 | 0.1149 |
| 57409 | MIF4GD | P16T-E | Human | Esophagus | ESCC | 6.25e-13 | 2.82e-01 | 0.1153 |
| 57409 | MIF4GD | P17T-E | Human | Esophagus | ESCC | 1.97e-06 | 3.06e-01 | 0.1278 |
| 57409 | MIF4GD | P19T-E | Human | Esophagus | ESCC | 1.46e-10 | 5.60e-01 | 0.1662 |
| Page: 1 2 3 4 5 |
| Tissue | Expression Dynamics | Abbreviation |
| Esophagus | 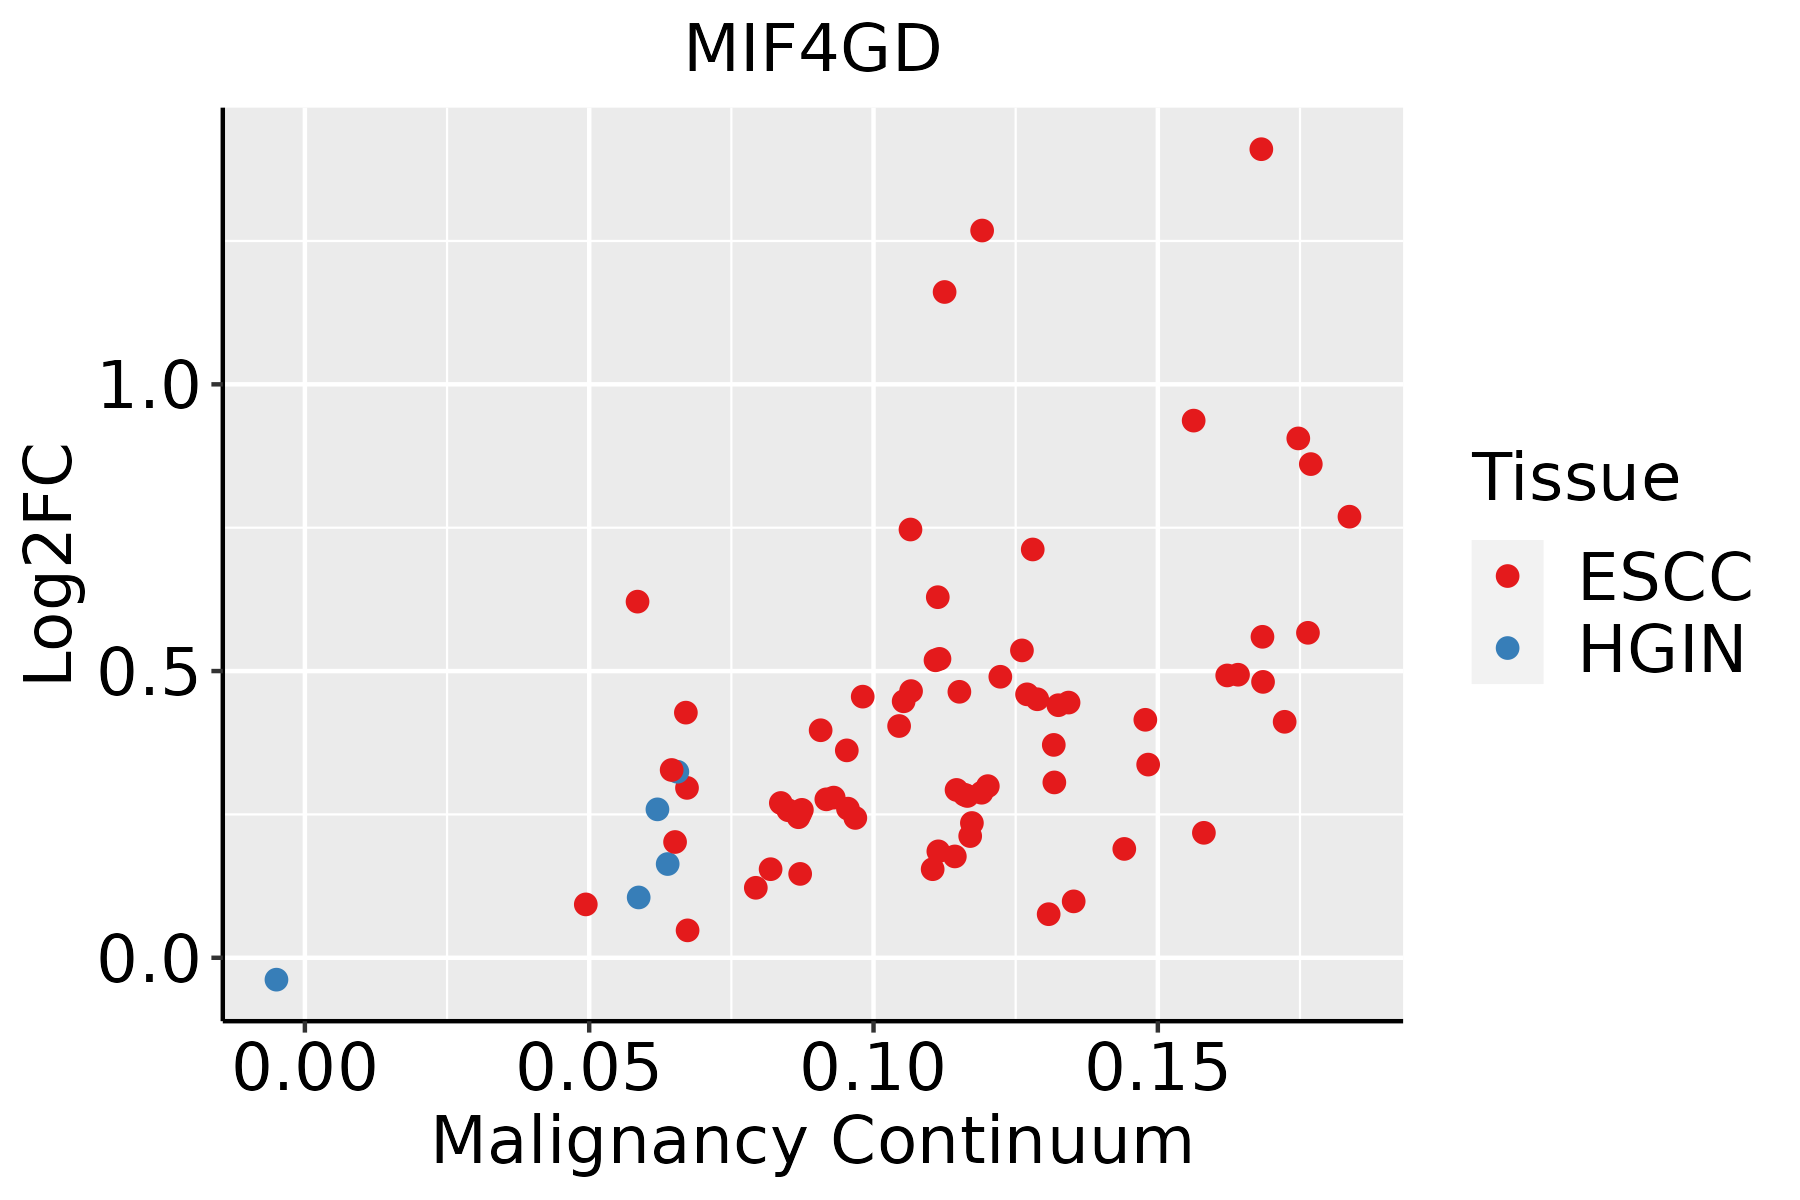 | ESCC: Esophageal squamous cell carcinoma |
| HGIN: High-grade intraepithelial neoplasias | ||
| LGIN: Low-grade intraepithelial neoplasias | ||
| Liver | 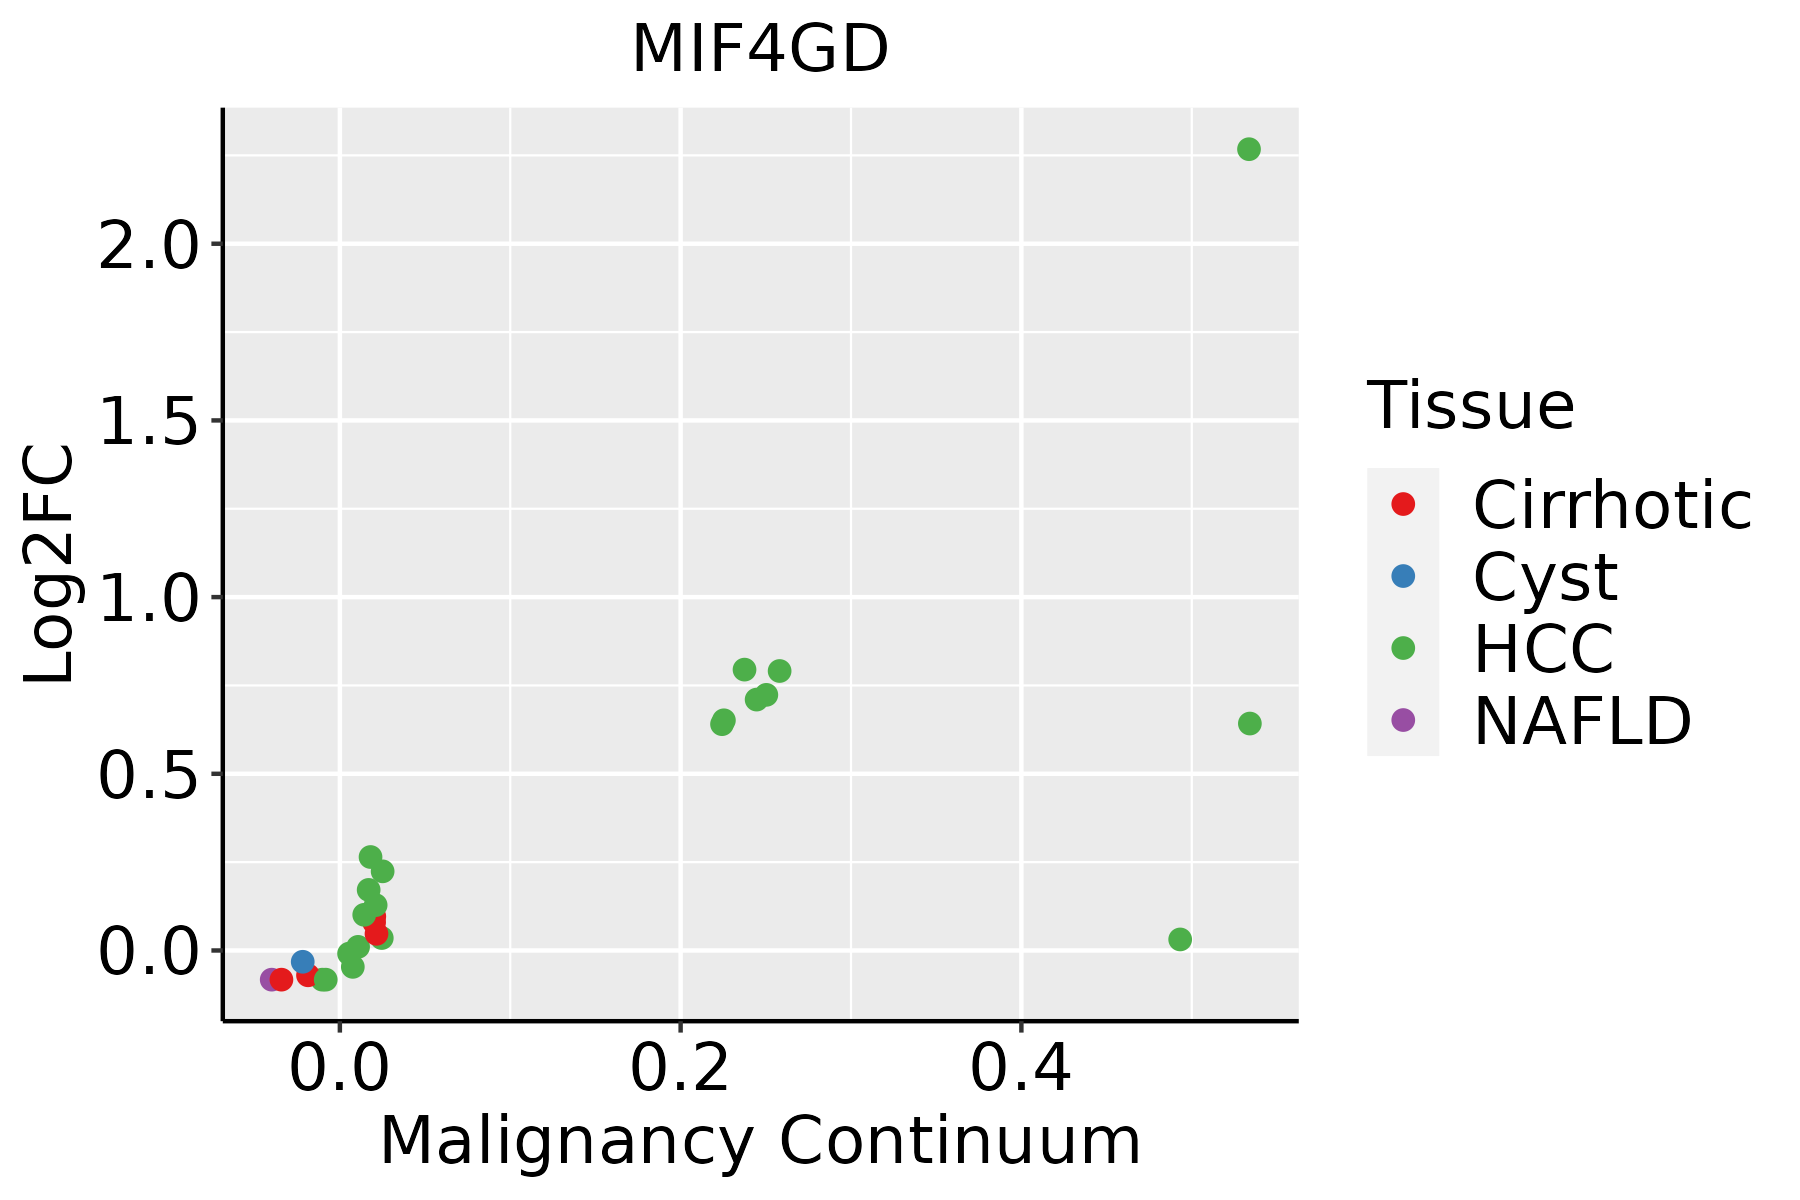 | HCC: Hepatocellular carcinoma |
| NAFLD: Non-alcoholic fatty liver disease | ||
| Oral Cavity | 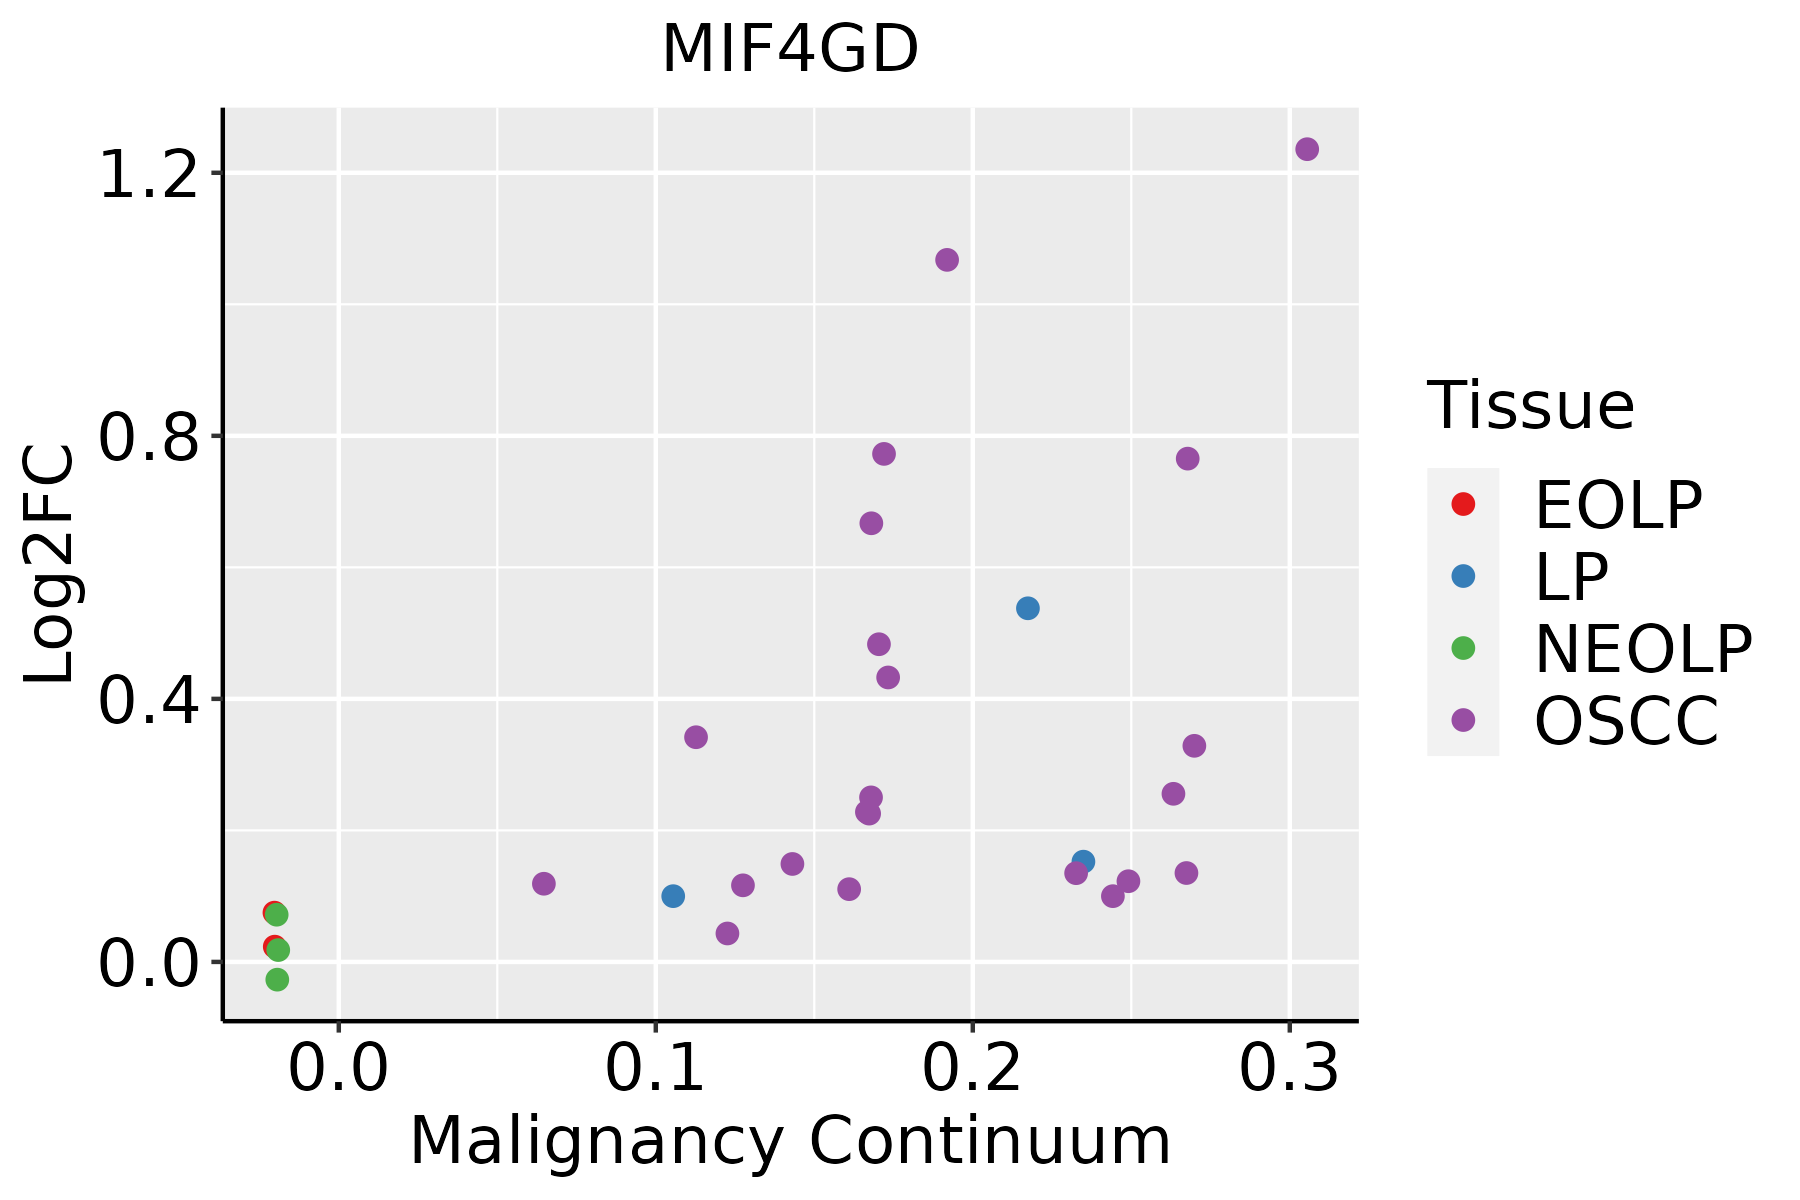 | EOLP: Erosive Oral lichen planus |
| LP: leukoplakia | ||
| NEOLP: Non-erosive oral lichen planus | ||
| OSCC: Oral squamous cell carcinoma |
| ∗log2FC in expression of this searched gene in stem-like cells from each diseased tissue sample relative to stem-like cells in normal samples in each tissue plotted against the malignancy continuum. Samples are colored based on if they are from different disease stage. |
Top |
Malignant transformation related pathway analysis |
| Find out the enriched GO biological processes and KEGG pathways involved in transition from healthy to precancer to cancer |
| Tissue | Disease Stage | Enriched GO biological Processes |
| Colorectum | AD |  |
| Colorectum | SER |  |
| Colorectum | MSS |  |
| Colorectum | MSI-H |  |
| Colorectum | FAP |  |
| ∗Top 15 enriched GO BP terms are showed in the bar plot of each disease state in each tissue. Each row represents a significant GO biological process which is colored according to the -log10(p.adjust). |
| Page: 1 2 3 4 5 6 7 8 9 |
| GO ID | Tissue | Disease Stage | Description | Gene Ratio | Bg Ratio | pvalue | p.adjust | Count |
| GO:000641727 | Esophagus | HGIN | regulation of translation | 139/2587 | 468/18723 | 1.46e-19 | 7.98e-17 | 139 |
| GO:000641320 | Esophagus | HGIN | translational initiation | 55/2587 | 118/18723 | 7.33e-18 | 2.31e-15 | 55 |
| GO:004572720 | Esophagus | HGIN | positive regulation of translation | 49/2587 | 136/18723 | 5.88e-11 | 6.30e-09 | 49 |
| GO:000644610 | Esophagus | HGIN | regulation of translational initiation | 34/2587 | 79/18723 | 2.09e-10 | 1.97e-08 | 34 |
| GO:003425020 | Esophagus | HGIN | positive regulation of cellular amide metabolic process | 53/2587 | 162/18723 | 6.01e-10 | 5.15e-08 | 53 |
| GO:0006413110 | Esophagus | ESCC | translational initiation | 100/8552 | 118/18723 | 1.16e-18 | 1.25e-16 | 100 |
| GO:0006417111 | Esophagus | ESCC | regulation of translation | 304/8552 | 468/18723 | 1.53e-17 | 1.33e-15 | 304 |
| GO:0045727111 | Esophagus | ESCC | positive regulation of translation | 107/8552 | 136/18723 | 2.79e-15 | 1.68e-13 | 107 |
| GO:0034250111 | Esophagus | ESCC | positive regulation of cellular amide metabolic process | 123/8552 | 162/18723 | 3.32e-15 | 1.93e-13 | 123 |
| GO:000644617 | Esophagus | ESCC | regulation of translational initiation | 65/8552 | 79/18723 | 2.04e-11 | 7.07e-10 | 65 |
| GO:000641312 | Liver | Cirrhotic | translational initiation | 76/4634 | 118/18723 | 8.36e-20 | 2.18e-17 | 76 |
| GO:000641712 | Liver | Cirrhotic | regulation of translation | 194/4634 | 468/18723 | 7.28e-16 | 8.79e-14 | 194 |
| GO:00457277 | Liver | Cirrhotic | positive regulation of translation | 71/4634 | 136/18723 | 4.99e-12 | 3.52e-10 | 71 |
| GO:000644612 | Liver | Cirrhotic | regulation of translational initiation | 48/4634 | 79/18723 | 1.14e-11 | 7.14e-10 | 48 |
| GO:003425012 | Liver | Cirrhotic | positive regulation of cellular amide metabolic process | 78/4634 | 162/18723 | 8.62e-11 | 4.66e-09 | 78 |
| GO:000641722 | Liver | HCC | regulation of translation | 287/7958 | 468/18723 | 8.79e-17 | 8.08e-15 | 287 |
| GO:000641322 | Liver | HCC | translational initiation | 94/7958 | 118/18723 | 1.39e-16 | 1.24e-14 | 94 |
| GO:004572712 | Liver | HCC | positive regulation of translation | 97/7958 | 136/18723 | 8.51e-12 | 3.55e-10 | 97 |
| GO:003425022 | Liver | HCC | positive regulation of cellular amide metabolic process | 110/7958 | 162/18723 | 5.14e-11 | 1.92e-09 | 110 |
| GO:000644622 | Liver | HCC | regulation of translational initiation | 62/7958 | 79/18723 | 6.85e-11 | 2.48e-09 | 62 |
| Page: 1 2 |
| Pathway ID | Tissue | Disease Stage | Description | Gene Ratio | Bg Ratio | pvalue | p.adjust | qvalue | Count |
| Page: 1 |
Top |
Cell-cell communication analysis |
| Identification of potential cell-cell interactions between two cell types and their ligand-receptor pairs for different disease states |
| Ligand | Receptor | LRpair | Pathway | Tissue | Disease Stage |
| Page: 1 |
Top |
Single-cell gene regulatory network inference analysis |
| Find out the significant the regulons (TFs) and the target genes of each regulon across cell types for different disease states |
| TF | Cell Type | Tissue | Disease Stage | Target Gene | RSS | Regulon Activity |
| ∗The dot plots of a searched regulon are shown for all cell subpopulations in each disease state of each tissue based on the regulon specific score inferred using pySCENIC and by calculating the average expression. |
| Page: 1 |
Top |
Somatic mutation of malignant transformation related genes |
| Annotation of somatic variants for genes involved in malignant transformation |
| Hugo Symbol | Variant Class | Variant Classification | dbSNP RS | HGVSc | HGVSp | HGVSp Short | SWISSPROT | BIOTYPE | SIFT | PolyPhen | Tumor Sample Barcode | Tissue | Histology | Sex | Age | Stage | Therapy Types | Drugs | Outcome |
| MIF4GD | SNV | Missense_Mutation | novel | c.257N>G | p.Ser86Cys | p.S86C | A9UHW6 | protein_coding | deleterious(0) | probably_damaging(0.995) | TCGA-5L-AAT1-01 | Breast | breast invasive carcinoma | Female | <65 | III/IV | Hormone Therapy | letrozol | SD |
| MIF4GD | SNV | Missense_Mutation | c.38N>A | p.Ser13Tyr | p.S13Y | A9UHW6 | protein_coding | deleterious_low_confidence(0) | possibly_damaging(0.713) | TCGA-A8-A09A-01 | Breast | breast invasive carcinoma | Female | <65 | I/II | Hormone Therapy | tamoxiphen | SD | |
| MIF4GD | SNV | Missense_Mutation | c.130N>A | p.Glu44Lys | p.E44K | A9UHW6 | protein_coding | tolerated_low_confidence(0.4) | benign(0) | TCGA-AC-A23H-01 | Breast | breast invasive carcinoma | Female | >=65 | I/II | Unknown | Unknown | PD | |
| MIF4GD | insertion | Nonsense_Mutation | novel | c.36_37insGCAACGTAATTCTTGAACTGGAAGACAAGC | p.Gln12_Ser13insAlaThrTerPheLeuAsnTrpLysThrSer | p.Q12_S13insAT*FLNWKTS | A9UHW6 | protein_coding | TCGA-A8-A085-01 | Breast | breast invasive carcinoma | Male | <65 | I/II | Hormone Therapy | tamoxiphen | SD | ||
| MIF4GD | insertion | Nonsense_Mutation | novel | c.718_719insCTGGCCATTTTCCCTCCTAAATGGTAGTCCTACCAAG | p.Ile240ThrfsTer7 | p.I240Tfs*7 | A9UHW6 | protein_coding | TCGA-AO-A0J9-01 | Breast | breast invasive carcinoma | Female | <65 | III/IV | Chemotherapy | cyclophosphamide | PD | ||
| MIF4GD | SNV | Missense_Mutation | c.245N>G | p.Ile82Ser | p.I82S | A9UHW6 | protein_coding | deleterious(0) | possibly_damaging(0.652) | TCGA-AA-3977-01 | Colorectum | colon adenocarcinoma | Male | >=65 | I/II | Unknown | Unknown | SD | |
| MIF4GD | SNV | Missense_Mutation | rs777781853 | c.139G>A | p.Val47Ile | p.V47I | A9UHW6 | protein_coding | tolerated_low_confidence(0.55) | benign(0) | TCGA-AZ-6600-01 | Colorectum | colon adenocarcinoma | Male | <65 | III/IV | Chemotherapy | cpt-11 | PD |
| MIF4GD | SNV | Missense_Mutation | rs557030914 | c.698A>G | p.Gln233Arg | p.Q233R | A9UHW6 | protein_coding | tolerated(1) | benign(0.003) | TCGA-CM-5861-01 | Colorectum | colon adenocarcinoma | Female | <65 | I/II | Unknown | Unknown | PD |
| MIF4GD | SNV | Missense_Mutation | c.516C>A | p.Asp172Glu | p.D172E | A9UHW6 | protein_coding | tolerated(0.09) | benign(0.373) | TCGA-F4-6570-01 | Colorectum | colon adenocarcinoma | Female | >=65 | I/II | Unknown | Unknown | SD | |
| MIF4GD | SNV | Missense_Mutation | c.53N>T | p.Thr18Ile | p.T18I | A9UHW6 | protein_coding | deleterious_low_confidence(0.02) | benign(0.042) | TCGA-AG-A002-01 | Colorectum | rectum adenocarcinoma | Male | <65 | I/II | Unknown | Unknown | SD |
| Page: 1 2 3 |
Top |
Related drugs of malignant transformation related genes |
| Identification of chemicals and drugs interact with genes involved in malignant transfromation |
| (DGIdb 4.0) |
| Entrez ID | Symbol | Category | Interaction Types | Drug Claim Name | Drug Name | PMIDs |
| Page: 1 |

Copyright 2023-Present -The University of Texas Health Science Center at Houston |