
|
|||||
|
 | |
| |
| |
| |
| |
| |
|
Gene: MIF |
Gene summary for MIF |
| Gene information | Species | Human | Gene symbol | MIF | Gene ID | 4282 |
| Gene name | macrophage migration inhibitory factor | |
| Gene Alias | GIF | |
| Cytomap | 22q11.23 | |
| Gene Type | protein-coding | GO ID | GO:0000165 | UniProtAcc | I4AY87 |
Top |
Malignant transformation analysis |
| Identification of the aberrant gene expression in precancerous and cancerous lesions by comparing the gene expression of stem-like cells in diseased tissues with normal stem cells |
| Entrez ID | Symbol | Replicates | Species | Organ | Tissue | Adj P-value | Log2FC | Malignancy |
| 4282 | MIF | GSM4909281 | Human | Breast | IDC | 1.08e-77 | 6.83e-01 | 0.21 |
| 4282 | MIF | GSM4909285 | Human | Breast | IDC | 3.07e-22 | -3.93e-01 | 0.21 |
| 4282 | MIF | GSM4909286 | Human | Breast | IDC | 8.78e-17 | 4.21e-01 | 0.1081 |
| 4282 | MIF | GSM4909287 | Human | Breast | IDC | 1.14e-64 | 6.20e-01 | 0.2057 |
| 4282 | MIF | GSM4909288 | Human | Breast | IDC | 1.58e-02 | -2.18e-01 | 0.0988 |
| 4282 | MIF | GSM4909289 | Human | Breast | IDC | 8.47e-24 | 6.06e-01 | 0.1064 |
| 4282 | MIF | GSM4909290 | Human | Breast | IDC | 6.70e-79 | 7.59e-01 | 0.2096 |
| 4282 | MIF | GSM4909291 | Human | Breast | IDC | 8.23e-96 | 9.02e-01 | 0.1753 |
| 4282 | MIF | GSM4909292 | Human | Breast | IDC | 1.56e-10 | 4.37e-01 | 0.1236 |
| 4282 | MIF | GSM4909293 | Human | Breast | IDC | 8.84e-15 | -2.18e-01 | 0.1581 |
| 4282 | MIF | GSM4909294 | Human | Breast | IDC | 5.48e-12 | 1.47e-01 | 0.2022 |
| 4282 | MIF | GSM4909296 | Human | Breast | IDC | 2.28e-100 | 7.95e-01 | 0.1524 |
| 4282 | MIF | GSM4909297 | Human | Breast | IDC | 4.42e-22 | 9.80e-02 | 0.1517 |
| 4282 | MIF | GSM4909298 | Human | Breast | IDC | 1.16e-07 | 3.32e-01 | 0.1551 |
| 4282 | MIF | GSM4909300 | Human | Breast | IDC | 1.08e-14 | 4.42e-01 | 0.0334 |
| 4282 | MIF | GSM4909301 | Human | Breast | IDC | 1.40e-12 | 3.11e-01 | 0.1577 |
| 4282 | MIF | GSM4909302 | Human | Breast | IDC | 1.21e-18 | 2.14e-01 | 0.1545 |
| 4282 | MIF | GSM4909305 | Human | Breast | IDC | 4.92e-06 | 2.89e-01 | 0.0436 |
| 4282 | MIF | GSM4909306 | Human | Breast | IDC | 4.10e-81 | 7.13e-01 | 0.1564 |
| 4282 | MIF | GSM4909307 | Human | Breast | IDC | 6.23e-27 | 4.11e-01 | 0.1569 |
| Page: 1 2 3 4 5 6 7 8 9 10 11 12 13 14 15 16 17 18 |
| Tissue | Expression Dynamics | Abbreviation |
| Breast | 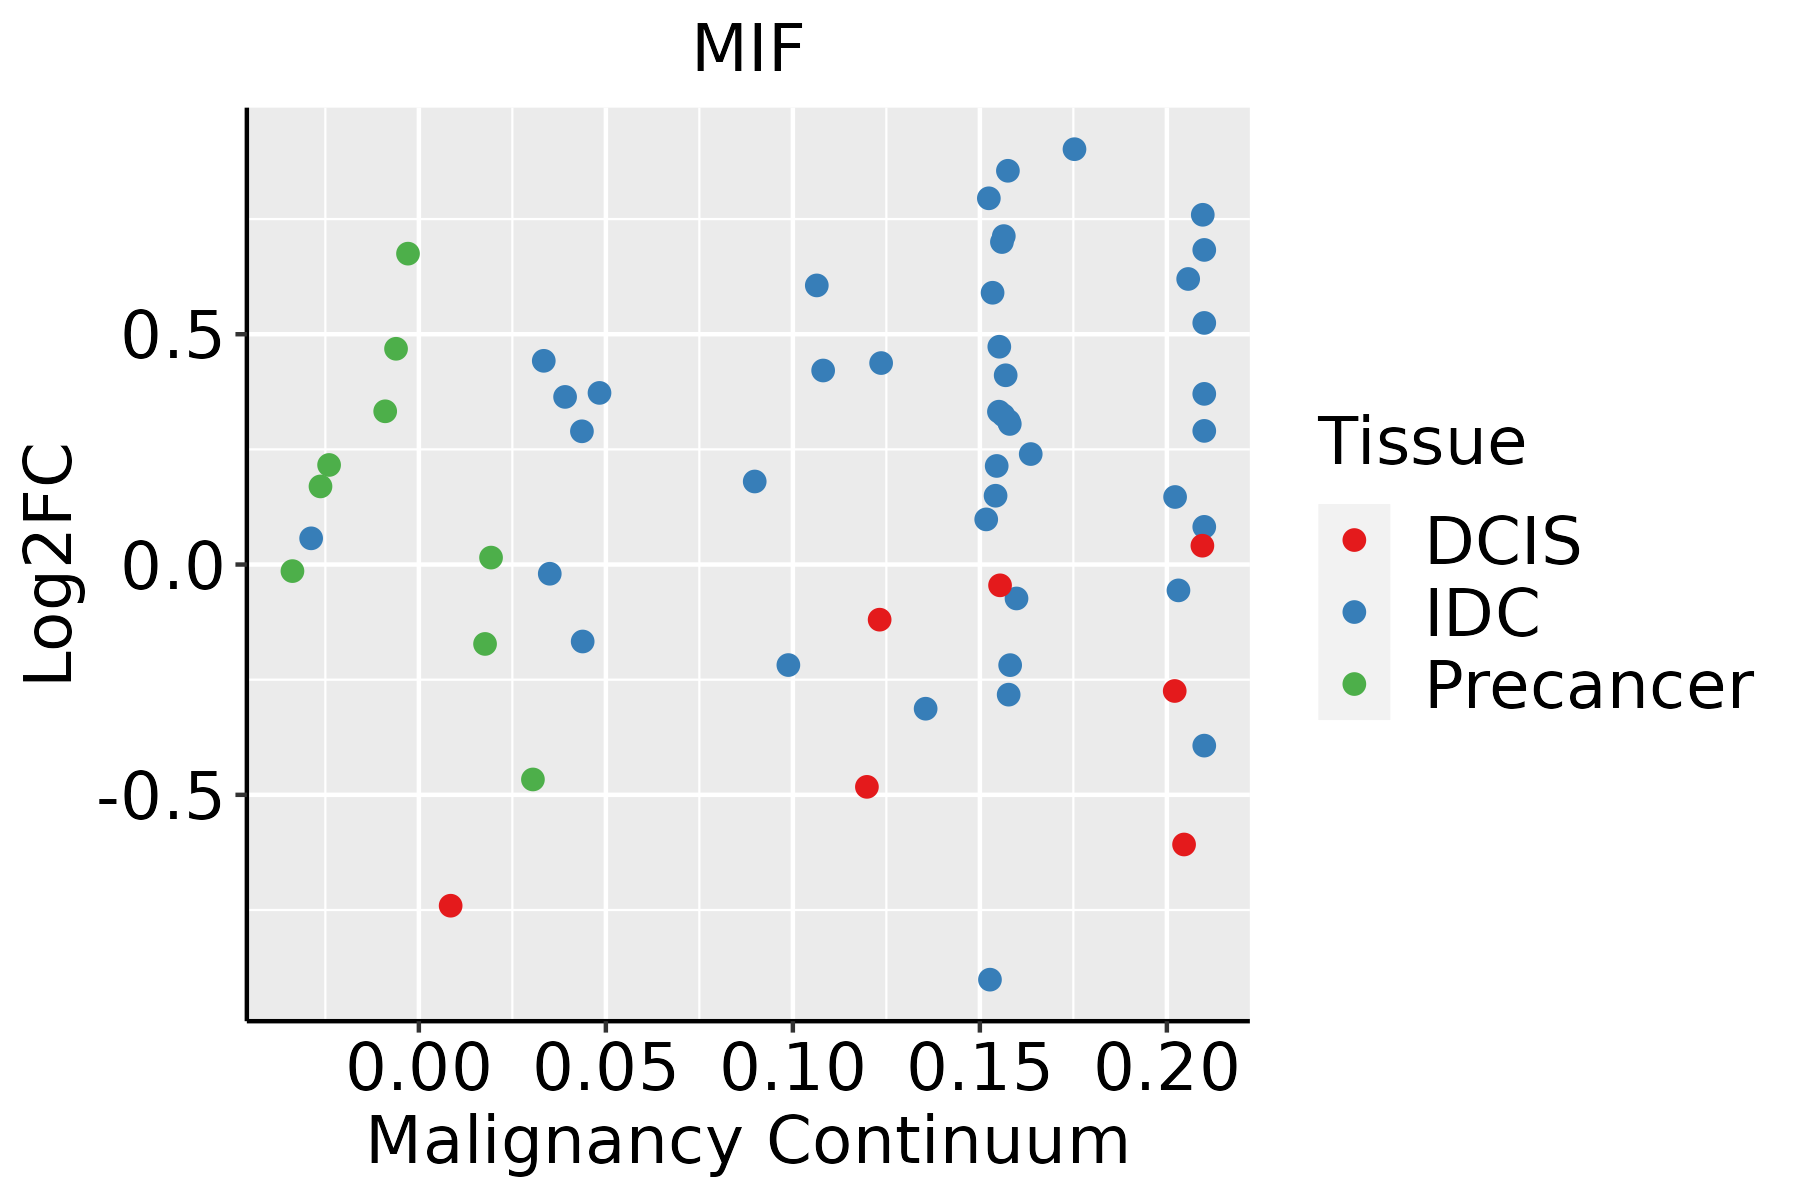 | IDC: Invasive ductal carcinoma |
| DCIS: Ductal carcinoma in situ | ||
| Precancer(BRCA1-mut): Precancerous lesion from BRCA1 mutation carriers | ||
| Cervix | 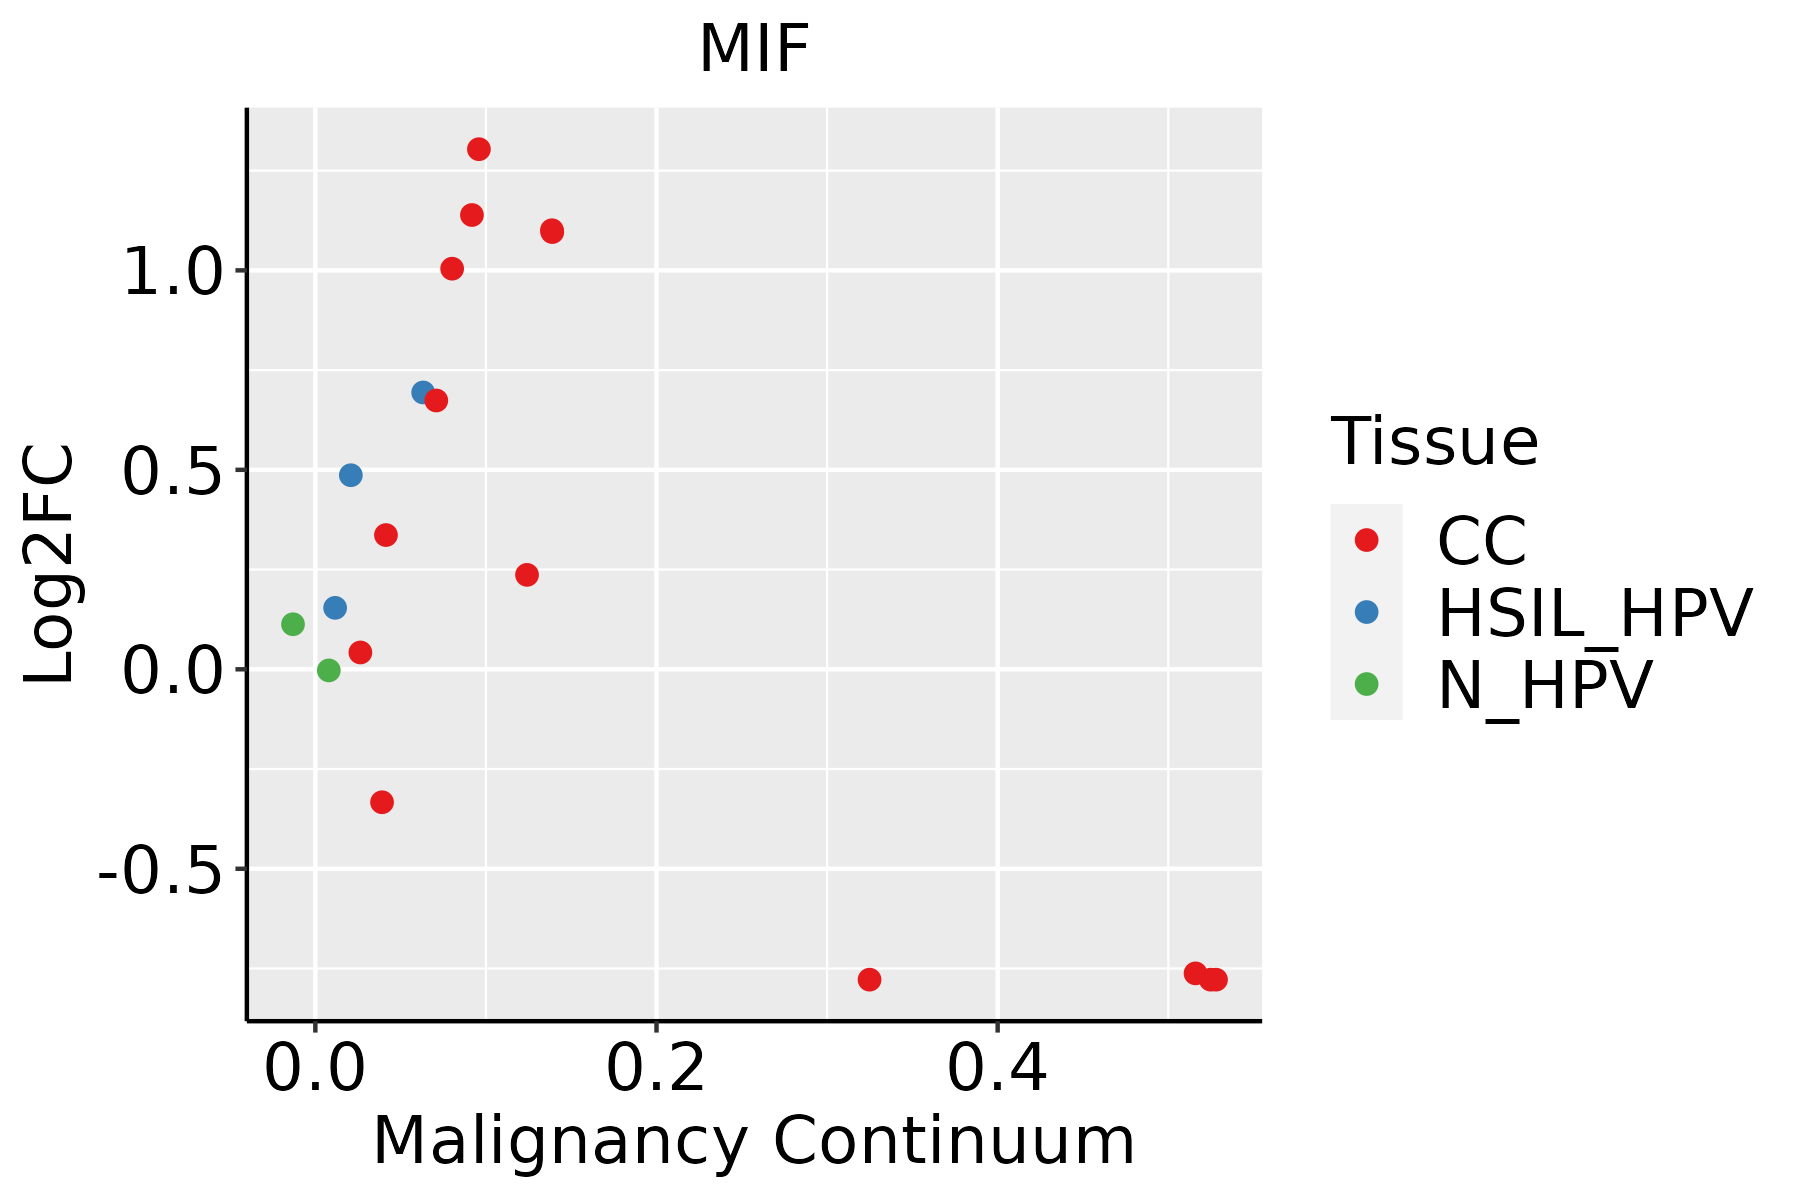 | CC: Cervix cancer |
| HSIL_HPV: HPV-infected high-grade squamous intraepithelial lesions | ||
| N_HPV: HPV-infected normal cervix | ||
| Endometrium |  | AEH: Atypical endometrial hyperplasia |
| EEC: Endometrioid Cancer | ||
| Esophagus |  | ESCC: Esophageal squamous cell carcinoma |
| HGIN: High-grade intraepithelial neoplasias | ||
| LGIN: Low-grade intraepithelial neoplasias | ||
| GC |  | CAG: Chronic atrophic gastritis |
| CAG with IM: Chronic atrophic gastritis with intestinal metaplasia | ||
| CSG: Chronic superficial gastritis | ||
| GC: Gastric cancer | ||
| SIM: Severe intestinal metaplasia | ||
| WIM: Wild intestinal metaplasia | ||
| Liver |  | HCC: Hepatocellular carcinoma |
| NAFLD: Non-alcoholic fatty liver disease | ||
| Lung |  | AAH: Atypical adenomatous hyperplasia |
| AIS: Adenocarcinoma in situ | ||
| IAC: Invasive lung adenocarcinoma | ||
| MIA: Minimally invasive adenocarcinoma | ||
| Oral Cavity | 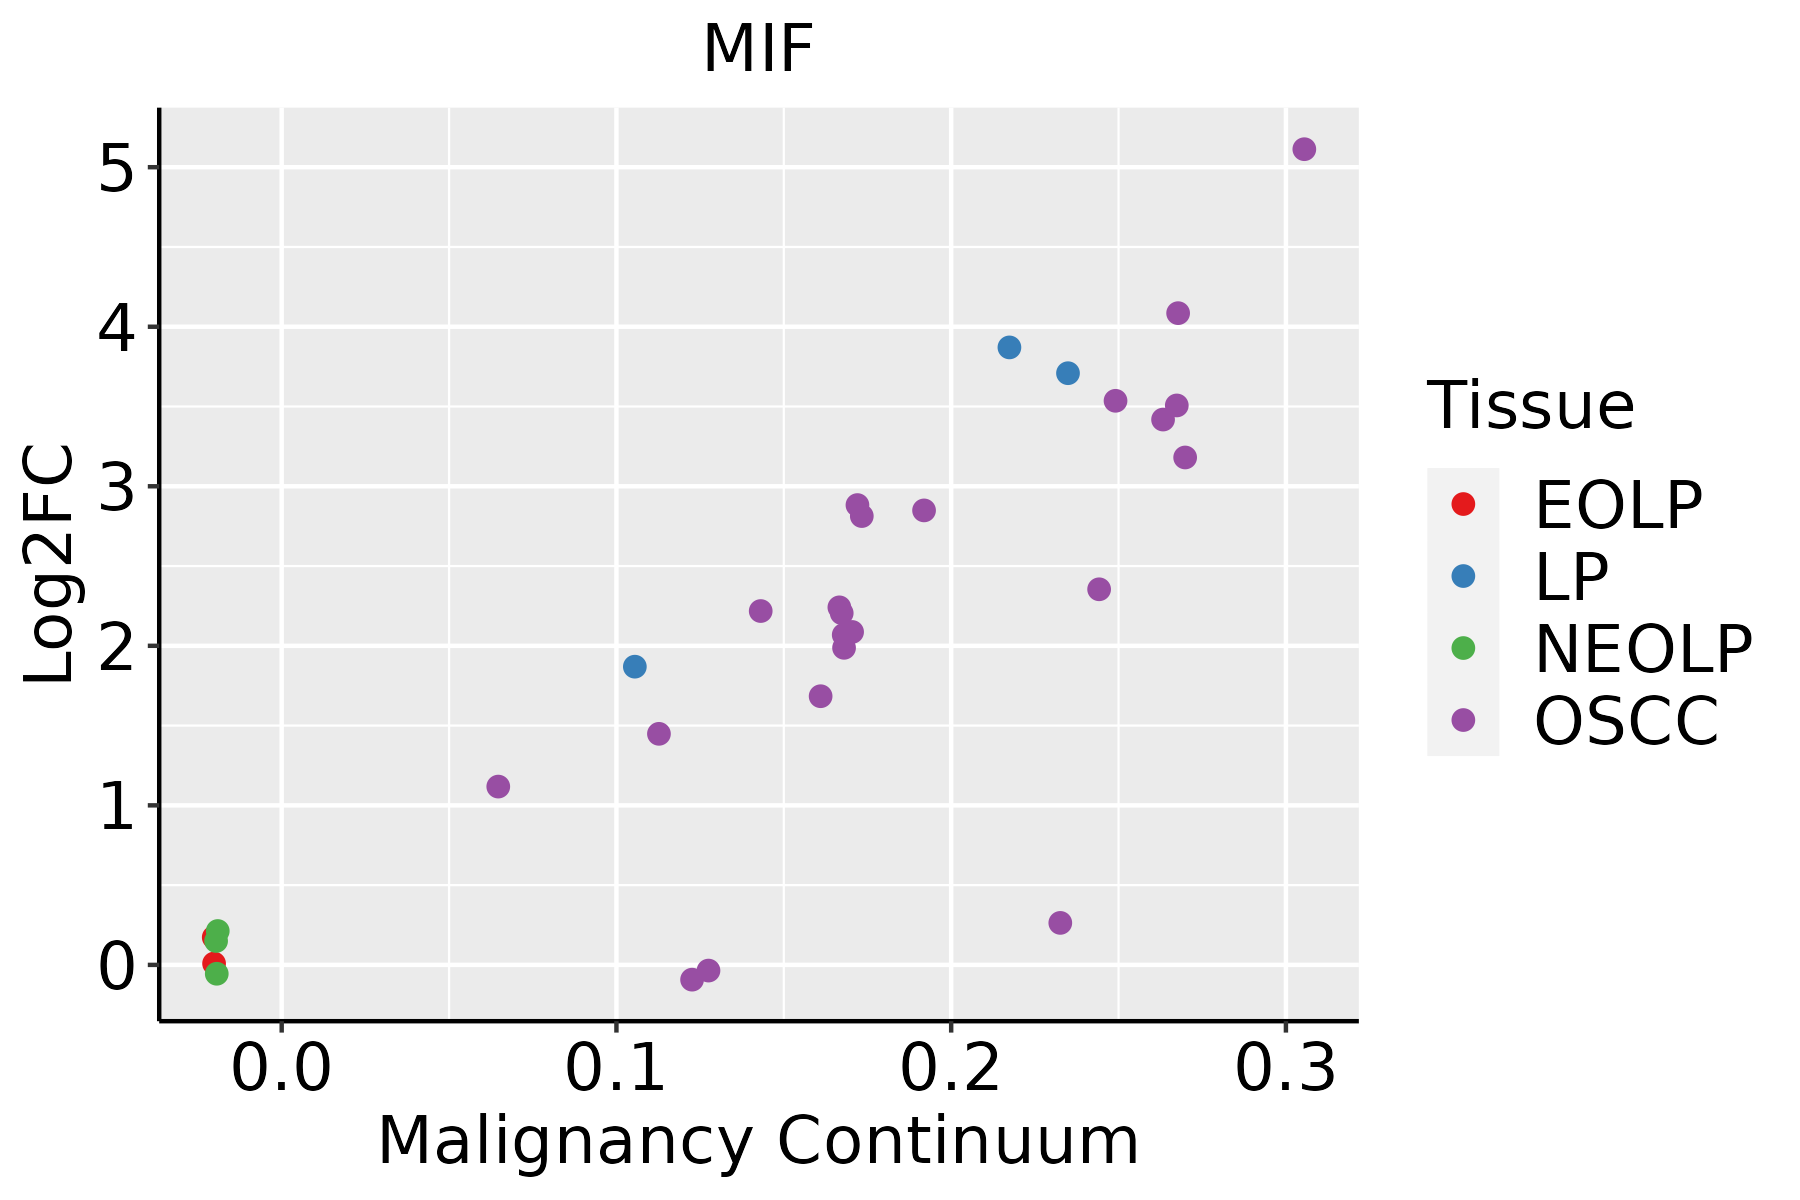 | EOLP: Erosive Oral lichen planus |
| LP: leukoplakia | ||
| NEOLP: Non-erosive oral lichen planus | ||
| OSCC: Oral squamous cell carcinoma | ||
| Prostate |  | BPH: Benign Prostatic Hyperplasia |
| Skin | 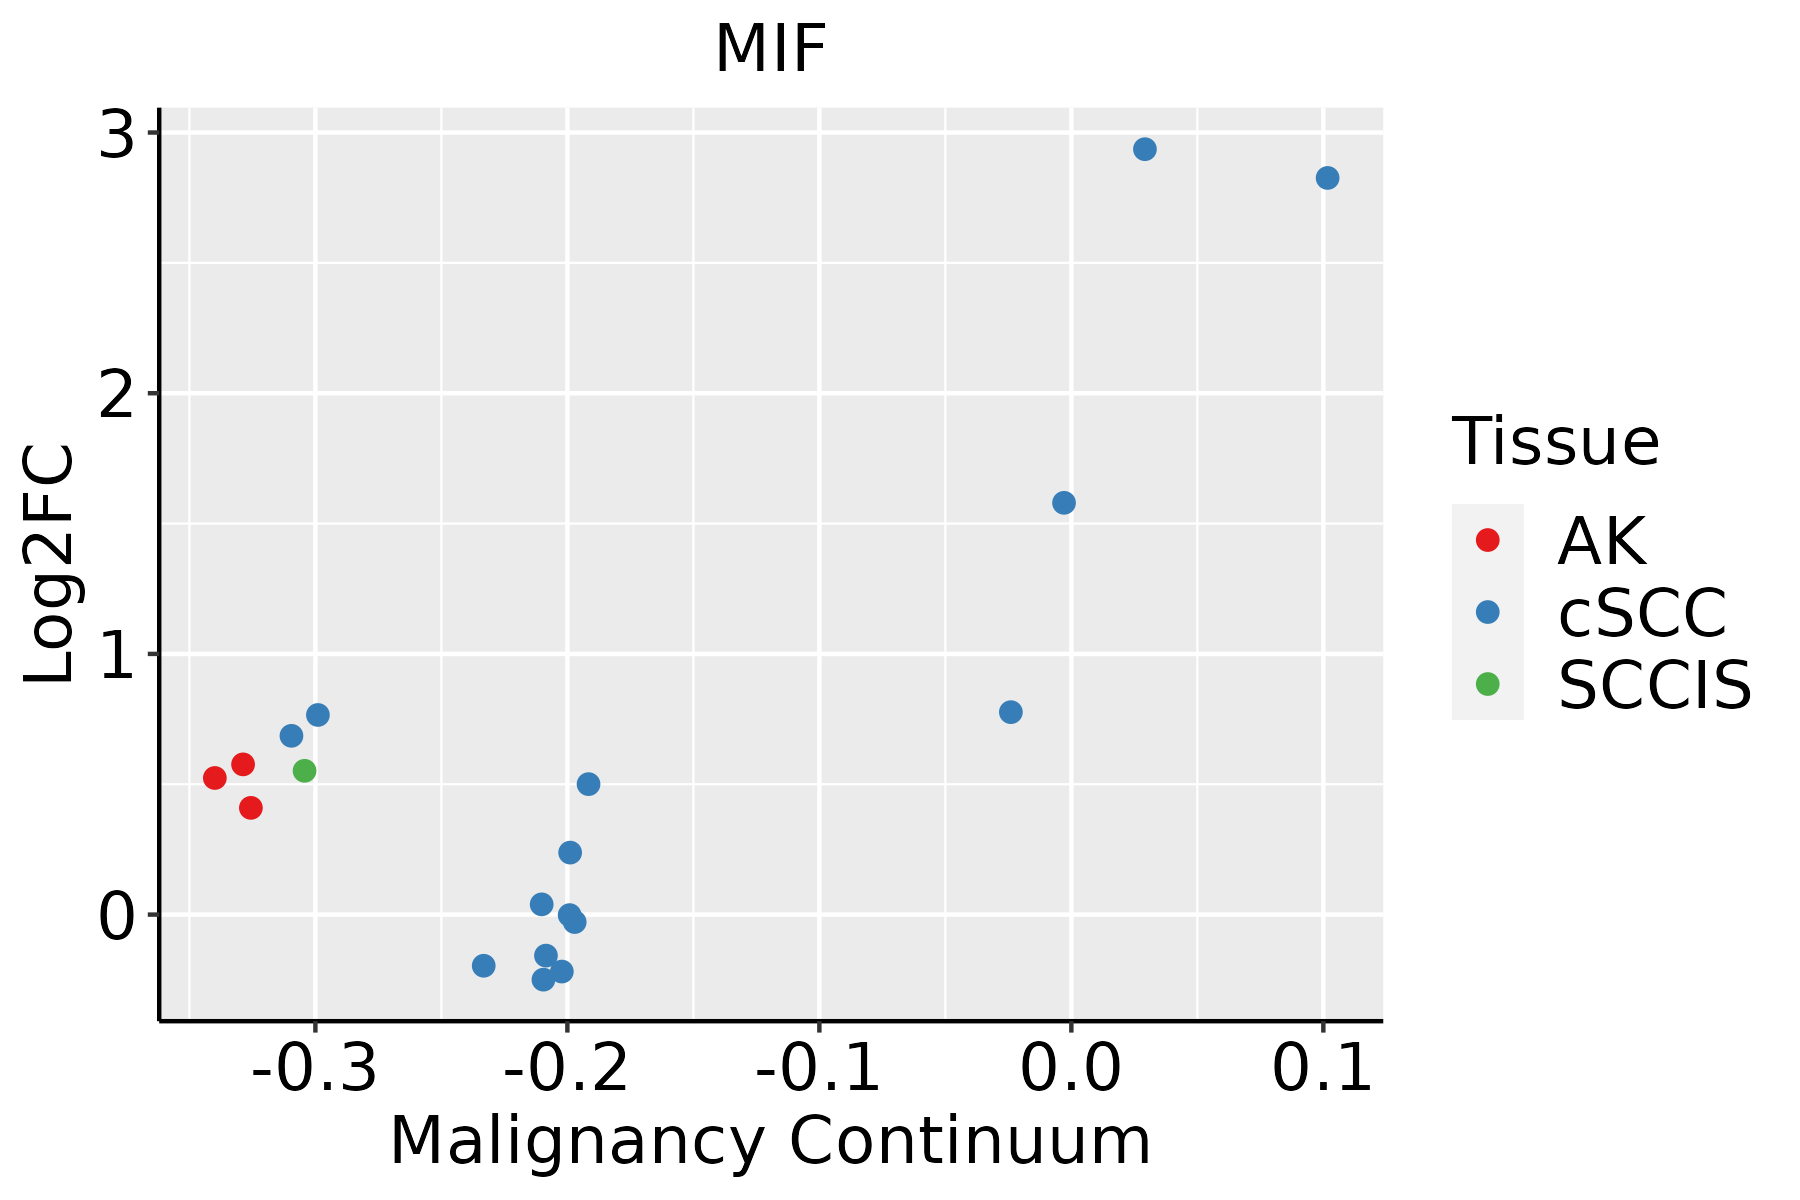 | AK: Actinic keratosis |
| cSCC: Cutaneous squamous cell carcinoma | ||
| SCCIS:squamous cell carcinoma in situ | ||
| Thyroid | 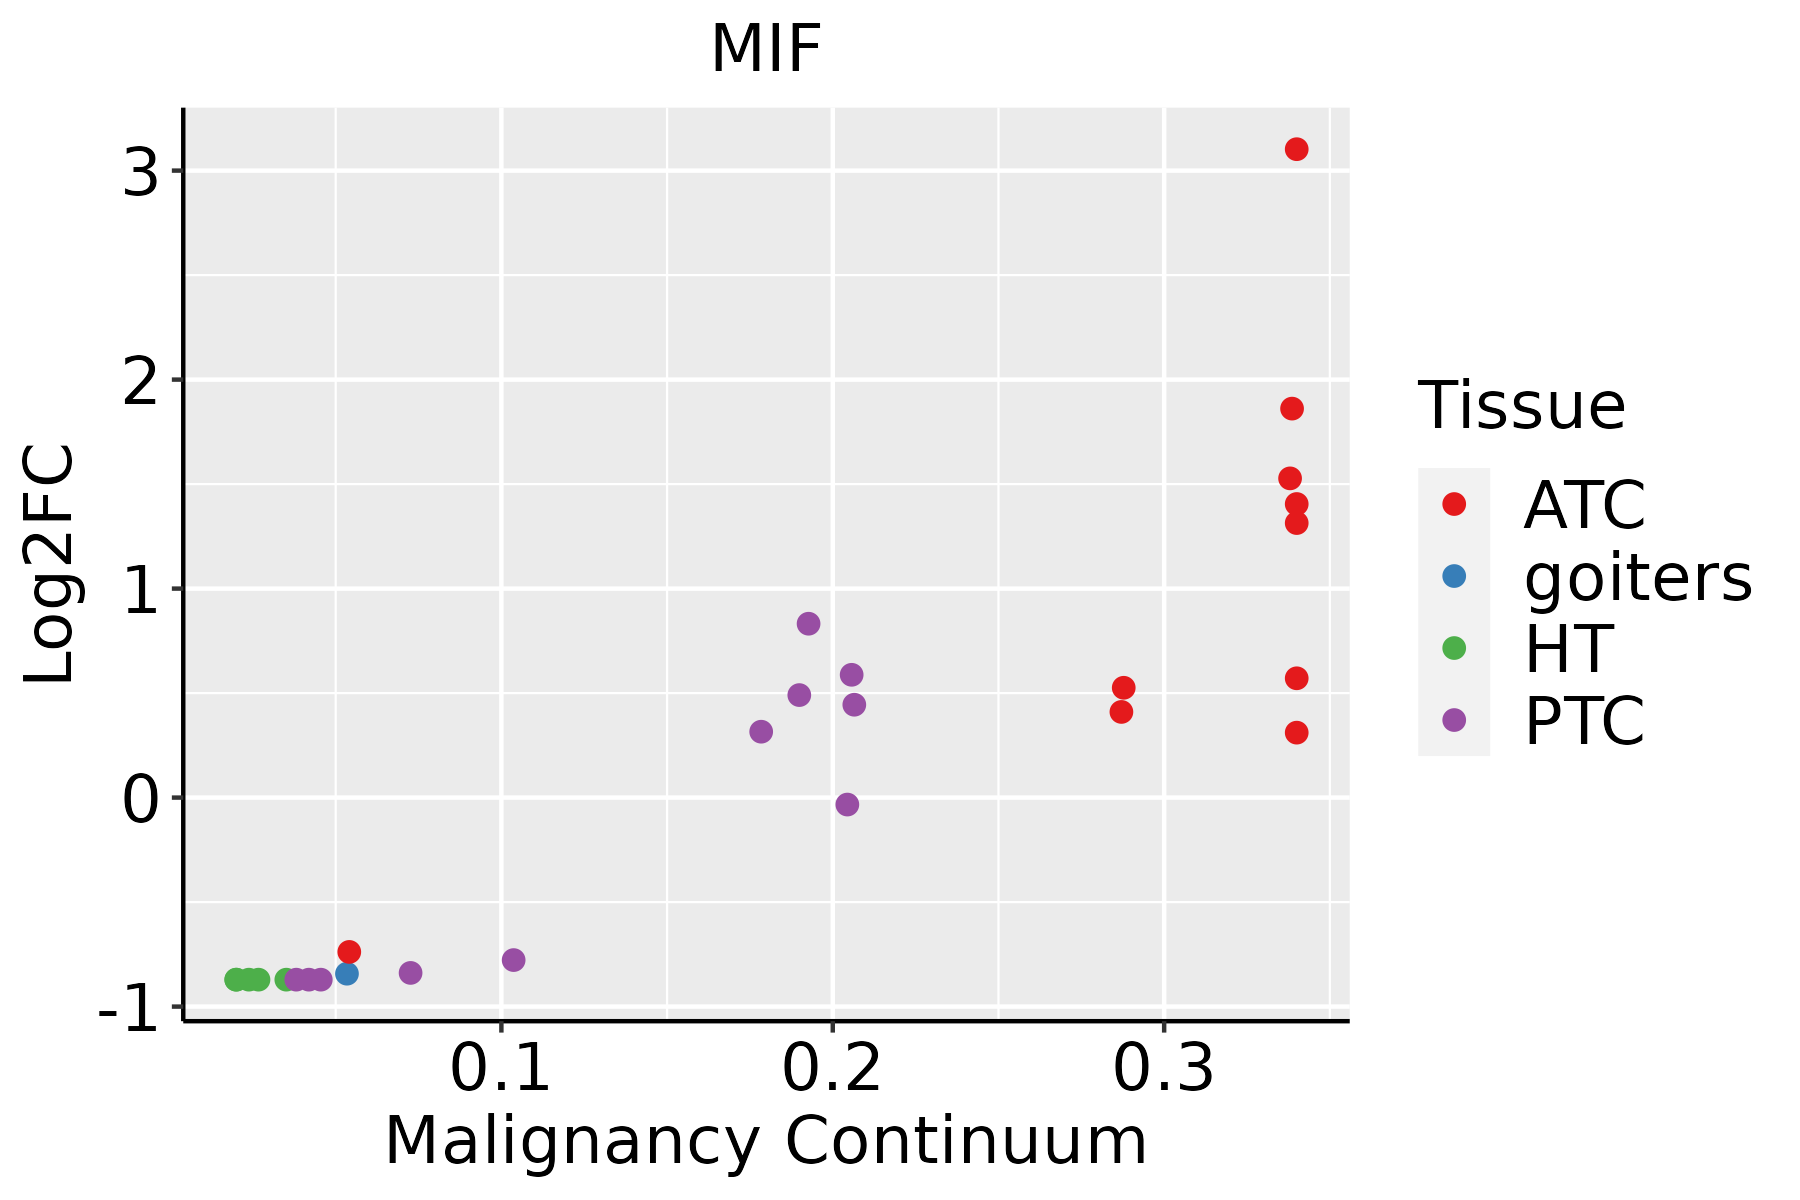 | ATC: Anaplastic thyroid cancer |
| HT: Hashimoto's thyroiditis | ||
| PTC: Papillary thyroid cancer |
| ∗log2FC in expression of this searched gene in stem-like cells from each diseased tissue sample relative to stem-like cells in normal samples in each tissue plotted against the malignancy continuum. Samples are colored based on if they are from different disease stage. |
Top |
Malignant transformation related pathway analysis |
| Find out the enriched GO biological processes and KEGG pathways involved in transition from healthy to precancer to cancer |
| Tissue | Disease Stage | Enriched GO biological Processes |
| Colorectum | AD |  |
| Colorectum | SER |  |
| Colorectum | MSS |  |
| Colorectum | MSI-H |  |
| Colorectum | FAP |  |
| ∗Top 15 enriched GO BP terms are showed in the bar plot of each disease state in each tissue. Each row represents a significant GO biological process which is colored according to the -log10(p.adjust). |
| Page: 1 2 3 4 5 6 7 8 9 |
| GO ID | Tissue | Disease Stage | Description | Gene Ratio | Bg Ratio | pvalue | p.adjust | Count |
| GO:00971939 | Breast | Precancer | intrinsic apoptotic signaling pathway | 59/1080 | 288/18723 | 8.07e-18 | 3.60e-15 | 59 |
| GO:20012339 | Breast | Precancer | regulation of apoptotic signaling pathway | 65/1080 | 356/18723 | 7.70e-17 | 3.17e-14 | 65 |
| GO:20012429 | Breast | Precancer | regulation of intrinsic apoptotic signaling pathway | 41/1080 | 164/18723 | 6.48e-16 | 2.31e-13 | 41 |
| GO:20012349 | Breast | Precancer | negative regulation of apoptotic signaling pathway | 39/1080 | 224/18723 | 5.35e-10 | 4.77e-08 | 39 |
| GO:20012439 | Breast | Precancer | negative regulation of intrinsic apoptotic signaling pathway | 23/1080 | 98/18723 | 5.82e-09 | 4.45e-07 | 23 |
| GO:00975297 | Breast | Precancer | myeloid leukocyte migration | 34/1080 | 220/18723 | 1.42e-07 | 7.82e-06 | 34 |
| GO:00509006 | Breast | Precancer | leukocyte migration | 47/1080 | 369/18723 | 2.82e-07 | 1.39e-05 | 47 |
| GO:00305956 | Breast | Precancer | leukocyte chemotaxis | 34/1080 | 230/18723 | 4.16e-07 | 1.89e-05 | 34 |
| GO:00603266 | Breast | Precancer | cell chemotaxis | 41/1080 | 310/18723 | 5.99e-07 | 2.55e-05 | 41 |
| GO:19017969 | Breast | Precancer | regulation of signal transduction by p53 class mediator | 19/1080 | 93/18723 | 1.20e-06 | 4.60e-05 | 19 |
| GO:00723319 | Breast | Precancer | signal transduction by p53 class mediator | 26/1080 | 163/18723 | 2.23e-06 | 7.76e-05 | 26 |
| GO:00018196 | Breast | Precancer | positive regulation of cytokine production | 52/1080 | 467/18723 | 4.18e-06 | 1.29e-04 | 52 |
| GO:00723328 | Breast | Precancer | intrinsic apoptotic signaling pathway by p53 class mediator | 16/1080 | 76/18723 | 5.49e-06 | 1.63e-04 | 16 |
| GO:00075688 | Breast | Precancer | aging | 41/1080 | 339/18723 | 5.95e-06 | 1.71e-04 | 41 |
| GO:19022537 | Breast | Precancer | regulation of intrinsic apoptotic signaling pathway by p53 class mediator | 9/1080 | 29/18723 | 2.40e-05 | 5.53e-04 | 9 |
| GO:00026856 | Breast | Precancer | regulation of leukocyte migration | 27/1080 | 210/18723 | 7.93e-05 | 1.54e-03 | 27 |
| GO:00086308 | Breast | Precancer | intrinsic apoptotic signaling pathway in response to DNA damage | 16/1080 | 99/18723 | 1.65e-04 | 2.74e-03 | 16 |
| GO:19021655 | Breast | Precancer | regulation of intrinsic apoptotic signaling pathway in response to DNA damage by p53 class mediator | 6/1080 | 16/18723 | 1.76e-04 | 2.87e-03 | 6 |
| GO:00482463 | Breast | Precancer | macrophage chemotaxis | 9/1080 | 38/18723 | 2.44e-04 | 3.66e-03 | 9 |
| GO:19055173 | Breast | Precancer | macrophage migration | 11/1080 | 55/18723 | 2.57e-04 | 3.83e-03 | 11 |
| Page: 1 2 3 4 5 6 7 8 9 10 11 12 13 14 15 16 17 18 19 20 21 22 23 24 25 26 27 28 29 30 31 32 33 34 35 36 37 38 39 40 41 42 43 44 45 46 47 48 49 50 51 52 53 54 55 56 57 58 59 60 61 62 63 64 65 66 67 68 69 70 71 |
| Pathway ID | Tissue | Disease Stage | Description | Gene Ratio | Bg Ratio | pvalue | p.adjust | qvalue | Count |
| Page: 1 |
Top |
Cell-cell communication analysis |
| Identification of potential cell-cell interactions between two cell types and their ligand-receptor pairs for different disease states |
| Ligand | Receptor | LRpair | Pathway | Tissue | Disease Stage |
| MIF | CD74_CXCR4 | MIF_CD74_CXCR4 | MIF | Breast | ADJ |
| MIF | CD74_CD44 | MIF_CD74_CD44 | MIF | Breast | ADJ |
| MIF | ACKR3 | MIF_ACKR3 | MIF | Breast | ADJ |
| MIF | CD74_CXCR4 | MIF_CD74_CXCR4 | MIF | Breast | DCIS |
| MIF | CD74_CD44 | MIF_CD74_CD44 | MIF | Breast | DCIS |
| MIF | ACKR3 | MIF_ACKR3 | MIF | Breast | DCIS |
| MIF | CD74_CXCR4 | MIF_CD74_CXCR4 | MIF | Breast | Healthy |
| MIF | CD74_CD44 | MIF_CD74_CD44 | MIF | Breast | Healthy |
| MIF | ACKR3 | MIF_ACKR3 | MIF | Breast | Healthy |
| MIF | CD74_CXCR4 | MIF_CD74_CXCR4 | MIF | Breast | IDC |
| MIF | CD74_CD44 | MIF_CD74_CD44 | MIF | Breast | IDC |
| MIF | CD74_CXCR4 | MIF_CD74_CXCR4 | MIF | Breast | Precancer |
| MIF | CD74_CD44 | MIF_CD74_CD44 | MIF | Breast | Precancer |
| MIF | CD74_CXCR4 | MIF_CD74_CXCR4 | MIF | Cervix | ADJ |
| MIF | CD74_CD44 | MIF_CD74_CD44 | MIF | Cervix | ADJ |
| MIF | ACKR3 | MIF_ACKR3 | MIF | Cervix | ADJ |
| MIF | CD74_CXCR4 | MIF_CD74_CXCR4 | MIF | Cervix | CC |
| MIF | CD74_CD44 | MIF_CD74_CD44 | MIF | Cervix | CC |
| MIF | ACKR3 | MIF_ACKR3 | MIF | Cervix | CC |
| MIF | CD74_CXCR4 | MIF_CD74_CXCR4 | MIF | Cervix | Healthy |
| Page: 1 2 3 4 5 6 |
Top |
Single-cell gene regulatory network inference analysis |
| Find out the significant the regulons (TFs) and the target genes of each regulon across cell types for different disease states |
| TF | Cell Type | Tissue | Disease Stage | Target Gene | RSS | Regulon Activity |
| ∗The dot plots of a searched regulon are shown for all cell subpopulations in each disease state of each tissue based on the regulon specific score inferred using pySCENIC and by calculating the average expression. |
| Page: 1 |
Top |
Somatic mutation of malignant transformation related genes |
| Annotation of somatic variants for genes involved in malignant transformation |
| Hugo Symbol | Variant Class | Variant Classification | dbSNP RS | HGVSc | HGVSp | HGVSp Short | SWISSPROT | BIOTYPE | SIFT | PolyPhen | Tumor Sample Barcode | Tissue | Histology | Sex | Age | Stage | Therapy Types | Drugs | Outcome |
| MIF | SNV | Missense_Mutation | novel | c.266N>C | p.Arg89Pro | p.R89P | P14174 | protein_coding | tolerated(0.21) | benign(0.219) | TCGA-VS-A94Z-01 | Cervix | cervical & endocervical cancer | Female | <65 | I/II | Chemotherapy | cisplatin | CR |
| MIF | insertion | Frame_Shift_Ins | rs767392036 | c.99_100insC | p.Gln36ProfsTer? | p.Q36Pfs*? | P14174 | protein_coding | TCGA-WS-AB45-01 | Colorectum | colon adenocarcinoma | Female | <65 | I/II | Unknown | Unknown | SD | ||
| MIF | SNV | Missense_Mutation | novel | c.95N>A | p.Gly32Asp | p.G32D | P14174 | protein_coding | tolerated(0.06) | benign(0.136) | TCGA-FI-A2D5-01 | Endometrium | uterine corpus endometrioid carcinoma | Female | <65 | III/IV | Chemotherapy | carboplatinum | PD |
| MIF | insertion | Frame_Shift_Ins | rs767392036 | c.99_100insC | p.Gln36ProfsTer? | p.Q36Pfs*? | P14174 | protein_coding | TCGA-B5-A3FC-01 | Endometrium | uterine corpus endometrioid carcinoma | Female | <65 | I/II | Unknown | Unknown | SD | ||
| MIF | SNV | Missense_Mutation | c.52N>T | p.Gly18Trp | p.G18W | P14174 | protein_coding | deleterious(0.01) | probably_damaging(0.983) | TCGA-BR-6566-01 | Stomach | stomach adenocarcinoma | Female | <65 | I/II | Unknown | Unknown | SD |
| Page: 1 |
Top |
Related drugs of malignant transformation related genes |
| Identification of chemicals and drugs interact with genes involved in malignant transfromation |
| (DGIdb 4.0) |
| Entrez ID | Symbol | Category | Interaction Types | Drug Claim Name | Drug Name | PMIDs |
| 4282 | MIF | DRUGGABLE GENOME, CELL SURFACE | ANTI-MIF MONOCLONAL ANTIBODY | |||
| 4282 | MIF | DRUGGABLE GENOME, CELL SURFACE | COR100140 | |||
| 4282 | MIF | DRUGGABLE GENOME, CELL SURFACE | PPD | 393437 | ||
| 4282 | MIF | DRUGGABLE GENOME, CELL SURFACE | Anti-MIF antibodies | 22238348 | ||
| 4282 | MIF | DRUGGABLE GENOME, CELL SURFACE | TCMDC-124484 | CHEMBL524449 | 21719283 | |
| 4282 | MIF | DRUGGABLE GENOME, CELL SURFACE | ISO-1 | |||
| 4282 | MIF | DRUGGABLE GENOME, CELL SURFACE | PMA | 3305746 |
| Page: 1 |

Copyright 2023-Present -The University of Texas Health Science Center at Houston |