
|
|||||
|
 | |
| |
| |
| |
| |
| |
|
Gene: MIER2 |
Gene summary for MIER2 |
| Gene information | Species | Human | Gene symbol | MIER2 | Gene ID | 54531 |
| Gene name | MIER family member 2 | |
| Gene Alias | KIAA1193 | |
| Cytomap | 19p13.3 | |
| Gene Type | protein-coding | GO ID | GO:0000122 | UniProtAcc | Q8N344 |
Top |
Malignant transformation analysis |
| Identification of the aberrant gene expression in precancerous and cancerous lesions by comparing the gene expression of stem-like cells in diseased tissues with normal stem cells |
| Entrez ID | Symbol | Replicates | Species | Organ | Tissue | Adj P-value | Log2FC | Malignancy |
| 54531 | MIER2 | LZE22T | Human | Esophagus | ESCC | 3.90e-02 | 2.16e-01 | 0.068 |
| 54531 | MIER2 | LZE24T | Human | Esophagus | ESCC | 5.53e-07 | 2.17e-01 | 0.0596 |
| 54531 | MIER2 | LZE21T | Human | Esophagus | ESCC | 1.15e-02 | 1.47e-01 | 0.0655 |
| 54531 | MIER2 | P1T-E | Human | Esophagus | ESCC | 2.26e-03 | 1.30e-01 | 0.0875 |
| 54531 | MIER2 | P2T-E | Human | Esophagus | ESCC | 1.02e-07 | 6.74e-02 | 0.1177 |
| 54531 | MIER2 | P4T-E | Human | Esophagus | ESCC | 4.05e-07 | 1.74e-01 | 0.1323 |
| 54531 | MIER2 | P5T-E | Human | Esophagus | ESCC | 8.88e-03 | 9.48e-02 | 0.1327 |
| 54531 | MIER2 | P8T-E | Human | Esophagus | ESCC | 3.10e-08 | 1.29e-01 | 0.0889 |
| 54531 | MIER2 | P9T-E | Human | Esophagus | ESCC | 3.61e-10 | 1.92e-01 | 0.1131 |
| 54531 | MIER2 | P10T-E | Human | Esophagus | ESCC | 2.05e-18 | 2.49e-01 | 0.116 |
| 54531 | MIER2 | P11T-E | Human | Esophagus | ESCC | 2.93e-07 | 3.54e-01 | 0.1426 |
| 54531 | MIER2 | P12T-E | Human | Esophagus | ESCC | 2.30e-10 | 2.26e-01 | 0.1122 |
| 54531 | MIER2 | P15T-E | Human | Esophagus | ESCC | 7.33e-05 | 1.51e-01 | 0.1149 |
| 54531 | MIER2 | P16T-E | Human | Esophagus | ESCC | 8.07e-09 | 1.39e-01 | 0.1153 |
| 54531 | MIER2 | P17T-E | Human | Esophagus | ESCC | 3.16e-05 | 2.19e-01 | 0.1278 |
| 54531 | MIER2 | P19T-E | Human | Esophagus | ESCC | 1.10e-02 | 2.47e-01 | 0.1662 |
| 54531 | MIER2 | P20T-E | Human | Esophagus | ESCC | 1.75e-09 | 1.79e-01 | 0.1124 |
| 54531 | MIER2 | P21T-E | Human | Esophagus | ESCC | 2.55e-14 | 2.39e-01 | 0.1617 |
| 54531 | MIER2 | P22T-E | Human | Esophagus | ESCC | 2.32e-10 | 9.68e-02 | 0.1236 |
| 54531 | MIER2 | P23T-E | Human | Esophagus | ESCC | 5.28e-16 | 3.59e-01 | 0.108 |
| Page: 1 2 3 4 |
| Tissue | Expression Dynamics | Abbreviation |
| Esophagus | 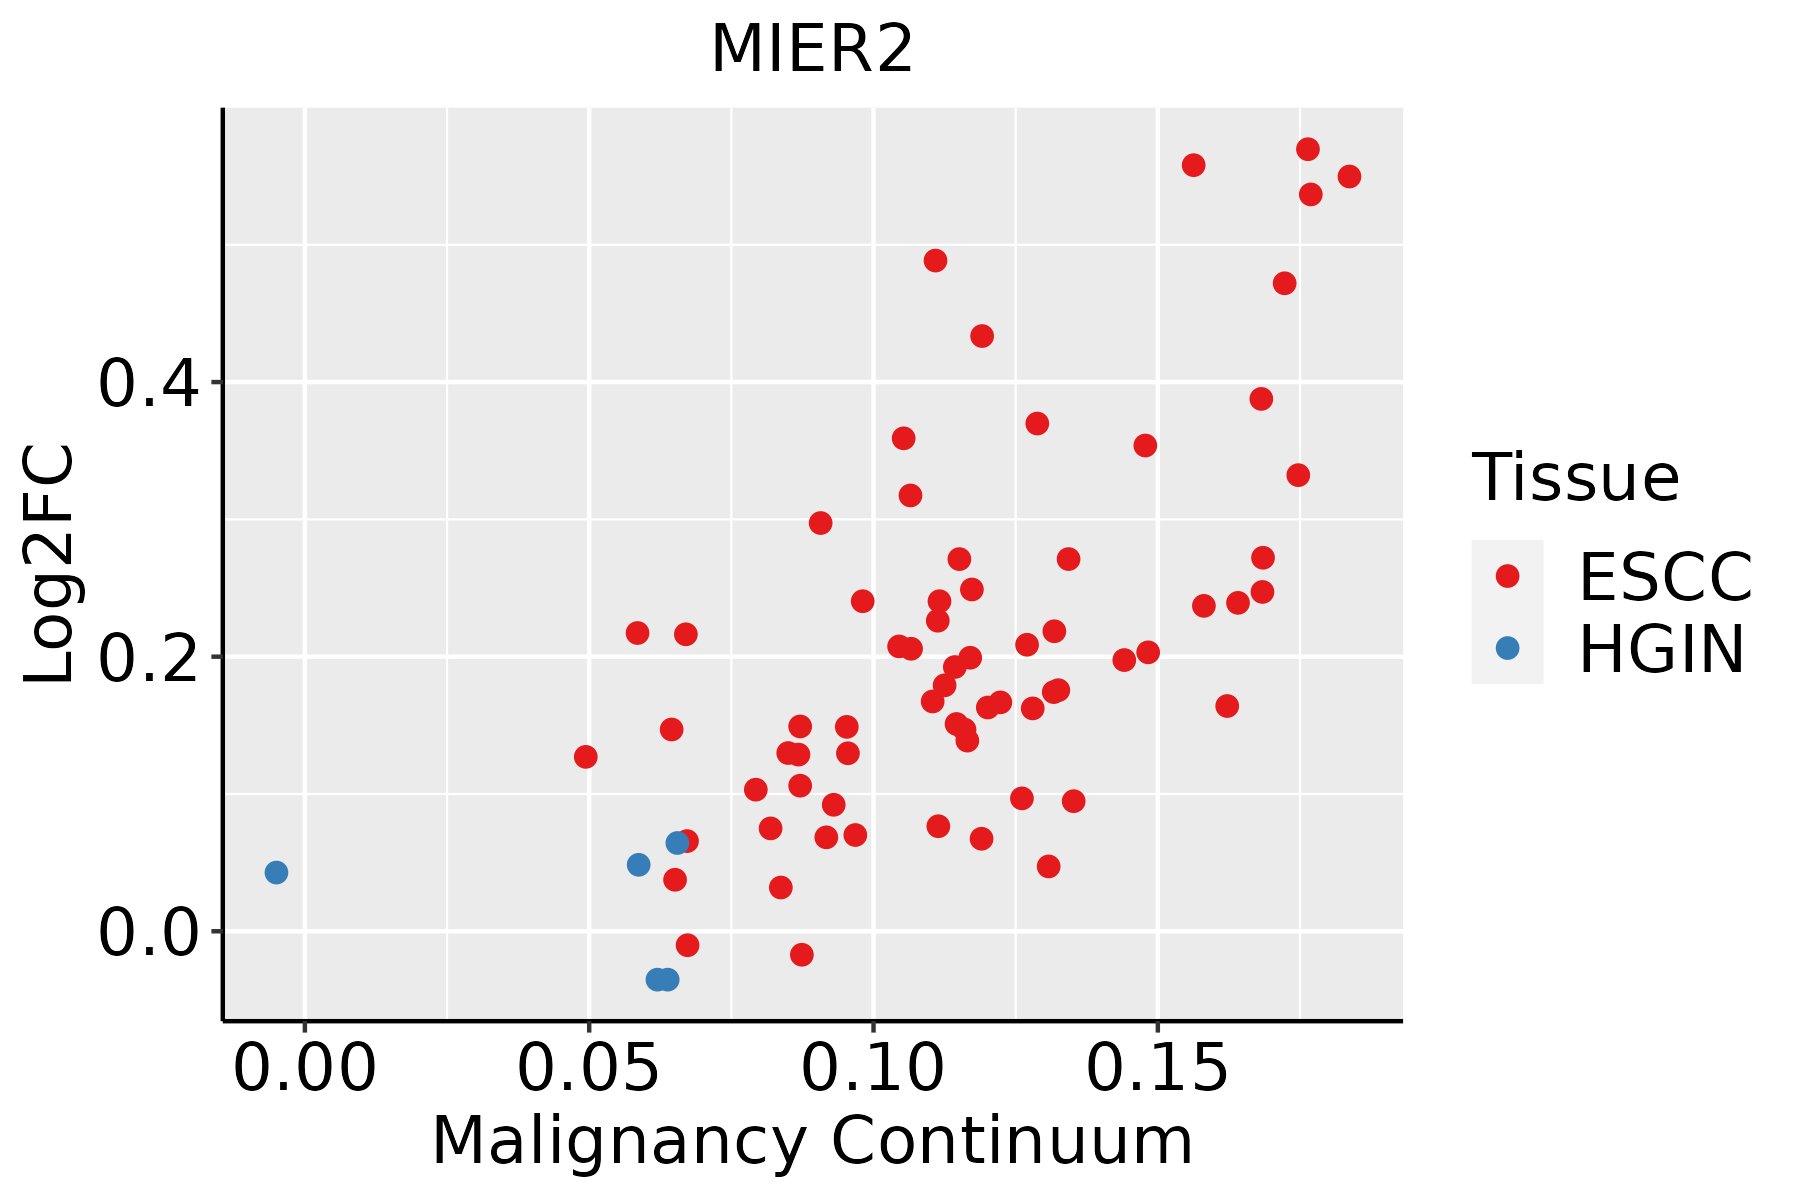 | ESCC: Esophageal squamous cell carcinoma |
| HGIN: High-grade intraepithelial neoplasias | ||
| LGIN: Low-grade intraepithelial neoplasias | ||
| Oral Cavity |  | EOLP: Erosive Oral lichen planus |
| LP: leukoplakia | ||
| NEOLP: Non-erosive oral lichen planus | ||
| OSCC: Oral squamous cell carcinoma |
| ∗log2FC in expression of this searched gene in stem-like cells from each diseased tissue sample relative to stem-like cells in normal samples in each tissue plotted against the malignancy continuum. Samples are colored based on if they are from different disease stage. |
Top |
Malignant transformation related pathway analysis |
| Find out the enriched GO biological processes and KEGG pathways involved in transition from healthy to precancer to cancer |
| Tissue | Disease Stage | Enriched GO biological Processes |
| Colorectum | AD |  |
| Colorectum | SER |  |
| Colorectum | MSS |  |
| Colorectum | MSI-H |  |
| Colorectum | FAP |  |
| ∗Top 15 enriched GO BP terms are showed in the bar plot of each disease state in each tissue. Each row represents a significant GO biological process which is colored according to the -log10(p.adjust). |
| Page: 1 2 3 4 5 6 7 8 9 |
| GO ID | Tissue | Disease Stage | Description | Gene Ratio | Bg Ratio | pvalue | p.adjust | Count |
| GO:001657015 | Esophagus | ESCC | histone modification | 323/8552 | 463/18723 | 2.61e-26 | 7.88e-24 | 323 |
| GO:00356015 | Esophagus | ESCC | protein deacylation | 79/8552 | 112/18723 | 8.30e-08 | 1.42e-06 | 79 |
| GO:00987325 | Esophagus | ESCC | macromolecule deacylation | 80/8552 | 116/18723 | 3.19e-07 | 4.50e-06 | 80 |
| GO:00165754 | Esophagus | ESCC | histone deacetylation | 60/8552 | 82/18723 | 3.85e-07 | 5.32e-06 | 60 |
| GO:00064765 | Esophagus | ESCC | protein deacetylation | 70/8552 | 101/18723 | 1.29e-06 | 1.58e-05 | 70 |
| GO:00165707 | Oral cavity | OSCC | histone modification | 270/7305 | 463/18723 | 1.59e-17 | 1.50e-15 | 270 |
| GO:00356014 | Oral cavity | OSCC | protein deacylation | 74/7305 | 112/18723 | 5.88e-09 | 1.26e-07 | 74 |
| GO:00987324 | Oral cavity | OSCC | macromolecule deacylation | 74/7305 | 116/18723 | 5.52e-08 | 1.01e-06 | 74 |
| GO:00064764 | Oral cavity | OSCC | protein deacetylation | 66/7305 | 101/18723 | 7.36e-08 | 1.30e-06 | 66 |
| GO:00165753 | Oral cavity | OSCC | histone deacetylation | 54/7305 | 82/18723 | 7.68e-07 | 1.08e-05 | 54 |
| GO:003560113 | Oral cavity | LP | protein deacylation | 48/4623 | 112/18723 | 1.85e-05 | 3.14e-04 | 48 |
| GO:001657014 | Oral cavity | LP | histone modification | 152/4623 | 463/18723 | 4.04e-05 | 5.90e-04 | 152 |
| GO:001657511 | Oral cavity | LP | histone deacetylation | 37/4623 | 82/18723 | 4.28e-05 | 6.15e-04 | 37 |
| GO:009873212 | Oral cavity | LP | macromolecule deacylation | 48/4623 | 116/18723 | 5.51e-05 | 7.58e-04 | 48 |
| GO:000647613 | Oral cavity | LP | protein deacetylation | 41/4623 | 101/18723 | 3.03e-04 | 3.12e-03 | 41 |
| Page: 1 |
| Pathway ID | Tissue | Disease Stage | Description | Gene Ratio | Bg Ratio | pvalue | p.adjust | qvalue | Count |
| Page: 1 |
Top |
Cell-cell communication analysis |
| Identification of potential cell-cell interactions between two cell types and their ligand-receptor pairs for different disease states |
| Ligand | Receptor | LRpair | Pathway | Tissue | Disease Stage |
| Page: 1 |
Top |
Single-cell gene regulatory network inference analysis |
| Find out the significant the regulons (TFs) and the target genes of each regulon across cell types for different disease states |
| TF | Cell Type | Tissue | Disease Stage | Target Gene | RSS | Regulon Activity |
| ∗The dot plots of a searched regulon are shown for all cell subpopulations in each disease state of each tissue based on the regulon specific score inferred using pySCENIC and by calculating the average expression. |
| Page: 1 |
Top |
Somatic mutation of malignant transformation related genes |
| Annotation of somatic variants for genes involved in malignant transformation |
| Hugo Symbol | Variant Class | Variant Classification | dbSNP RS | HGVSc | HGVSp | HGVSp Short | SWISSPROT | BIOTYPE | SIFT | PolyPhen | Tumor Sample Barcode | Tissue | Histology | Sex | Age | Stage | Therapy Types | Drugs | Outcome |
| MIER2 | SNV | Missense_Mutation | novel | c.55N>A | p.Glu19Lys | p.E19K | Q8N344 | protein_coding | tolerated_low_confidence(0.29) | benign(0.003) | TCGA-AN-A046-01 | Breast | breast invasive carcinoma | Female | >=65 | I/II | Unknown | Unknown | SD |
| MIER2 | SNV | Missense_Mutation | novel | c.80C>A | p.Pro27Gln | p.P27Q | Q8N344 | protein_coding | deleterious(0) | probably_damaging(0.91) | TCGA-AR-A2LH-01 | Breast | breast invasive carcinoma | Female | <65 | III/IV | Chemotherapy | adriamycin | PD |
| MIER2 | SNV | Missense_Mutation | c.703N>A | p.Glu235Lys | p.E235K | Q8N344 | protein_coding | deleterious(0) | probably_damaging(0.98) | TCGA-C8-A8HQ-01 | Breast | breast invasive carcinoma | Female | <65 | I/II | Unknown | Unknown | SD | |
| MIER2 | SNV | Missense_Mutation | rs768929225 | c.1322N>T | p.Pro441Leu | p.P441L | Q8N344 | protein_coding | deleterious(0.01) | benign(0.115) | TCGA-2W-A8YY-01 | Cervix | cervical & endocervical cancer | Female | <65 | I/II | Chemotherapy | cisplatin | CR |
| MIER2 | SNV | Missense_Mutation | novel | c.1162N>T | p.Arg388Cys | p.R388C | Q8N344 | protein_coding | deleterious(0.01) | benign(0) | TCGA-C5-A3HD-01 | Cervix | cervical & endocervical cancer | Female | <65 | I/II | Chemotherapy | cisplatin | SD |
| MIER2 | SNV | Missense_Mutation | novel | c.1274N>C | p.Glu425Ala | p.E425A | Q8N344 | protein_coding | tolerated(0.41) | benign(0.112) | TCGA-DS-A1OB-01 | Cervix | cervical & endocervical cancer | Female | <65 | I/II | Chemotherapy | carboplatin | PD |
| MIER2 | SNV | Missense_Mutation | rs187149127 | c.809C>T | p.Ala270Val | p.A270V | Q8N344 | protein_coding | deleterious(0.01) | probably_damaging(0.973) | TCGA-EA-A410-01 | Cervix | cervical & endocervical cancer | Female | <65 | I/II | Unknown | Unknown | SD |
| MIER2 | insertion | Frame_Shift_Ins | novel | c.1275_1276insG | p.Pro426AlafsTer11 | p.P426Afs*11 | Q8N344 | protein_coding | TCGA-DS-A1OB-01 | Cervix | cervical & endocervical cancer | Female | <65 | I/II | Chemotherapy | carboplatin | PD | ||
| MIER2 | SNV | Missense_Mutation | novel | c.1624N>A | p.Val542Met | p.V542M | Q8N344 | protein_coding | tolerated_low_confidence(0.07) | possibly_damaging(0.654) | TCGA-A6-2686-01 | Colorectum | colon adenocarcinoma | Female | >=65 | I/II | Unknown | Unknown | SD |
| MIER2 | SNV | Missense_Mutation | rs749897856 | c.271N>T | p.Leu91Phe | p.L91F | Q8N344 | protein_coding | deleterious(0.01) | benign(0.083) | TCGA-AA-3715-01 | Colorectum | colon adenocarcinoma | Male | >=65 | I/II | Unknown | Unknown | PD |
| Page: 1 2 3 4 5 |
Top |
Related drugs of malignant transformation related genes |
| Identification of chemicals and drugs interact with genes involved in malignant transfromation |
| (DGIdb 4.0) |
| Entrez ID | Symbol | Category | Interaction Types | Drug Claim Name | Drug Name | PMIDs |
| Page: 1 |

Copyright 2023-Present -The University of Texas Health Science Center at Houston |