Schematic overview of the cellular and molecular mechanisms involved in the cancer progression, including the proposed cellular and molecular mechanisms in cancer cells trajectory. AT1: alveolar type 1 cells; AT2: alveolar type 2 cells; AAH: atypical adenomatous hyperplasia; AIS: adenocarcinoma in situ; MIA: minimally invasive adenocarcinoma; IA: invasive adenocarcinoma; EMT: epithelial-mesenchymal transition

Home

Download

Statistics

Help

Contact

Center for Computational Systems Medicine
leaf

Gene summary

leaf

Malignant transformation analysis

leaf

Malignant transformation related pathway analysis

leaf

Cell-cell communication analysis

leaf

Single-cell gene regulatory network inference analysis

leaf

Somatic mutation of malignant transformation related genes

leaf

Related drugs of malignant transformation related genes

Gene: MIER1

Gene summary for MIER1

check button Gene summary.

Gene informationSpeciesHuman
Gene symbol

MIER1

Gene ID

57708

Gene nameMIER1 transcriptional regulator
Gene AliasER1
Cytomap1p31.3
Gene Typeprotein-coding
GO ID

GO:0000122

UniProtAcc

Q8N108


Top

Malignant transformation analysis

check button Identification of the aberrant gene expression in precancerous and cancerous lesions by comparing the gene expression of stem-like cells in diseased tissues with normal stem cells
check button Malignant transformation involving gene list.
Entrez IDSymbolReplicatesSpeciesOrganTissueAdj P-valueLog2FCMalignancy
57708MIER1HTA11_3410_2000001011HumanColorectumAD9.49e-11-4.90e-010.0155
57708MIER1HTA11_347_2000001011HumanColorectumAD3.65e-063.93e-01-0.1954
57708MIER1HTA11_10711_2000001011HumanColorectumAD3.04e-02-3.46e-010.0338
57708MIER1HTA11_7696_3000711011HumanColorectumAD3.83e-02-3.86e-010.0674
57708MIER1HTA11_99999973899_84307HumanColorectumMSS3.16e-02-5.19e-010.2585
57708MIER1HTA11_99999974143_84620HumanColorectumMSS1.33e-10-4.88e-010.3005
57708MIER1F007HumanColorectumFAP7.04e-05-4.06e-010.1176
57708MIER1A002-C-010HumanColorectumFAP3.37e-04-2.69e-010.242
57708MIER1A001-C-207HumanColorectumFAP9.41e-06-3.27e-010.1278
57708MIER1A015-C-203HumanColorectumFAP2.10e-20-4.11e-01-0.1294
57708MIER1A015-C-204HumanColorectumFAP4.77e-06-3.46e-01-0.0228
57708MIER1A014-C-040HumanColorectumFAP8.57e-04-2.79e-01-0.1184
57708MIER1A002-C-201HumanColorectumFAP5.39e-16-4.56e-010.0324
57708MIER1A002-C-203HumanColorectumFAP1.39e-06-3.83e-010.2786
57708MIER1A001-C-119HumanColorectumFAP1.87e-06-3.34e-01-0.1557
57708MIER1A001-C-108HumanColorectumFAP1.80e-12-3.91e-01-0.0272
57708MIER1A002-C-205HumanColorectumFAP2.66e-21-4.24e-01-0.1236
57708MIER1A001-C-104HumanColorectumFAP3.89e-03-3.23e-010.0184
57708MIER1A015-C-005HumanColorectumFAP7.45e-08-4.26e-01-0.0336
57708MIER1A015-C-006HumanColorectumFAP8.72e-18-5.51e-01-0.0994
Page: 1 2 3 4 5 6 7 8 

check button Transcriptomic changes along malignancy continuum.
TissueExpression DynamicsAbbreviation
Colorectum (GSE201348)The image shows the transcriptomic changes along malignancy continuum.log2FC in expression of this searched gene in stem-like cells from each diseased tissue sample relative to stem-like cells in normal samples in each tissue plotted against the malignancy continuum. Samples are colored based on if they are from different disease stage.
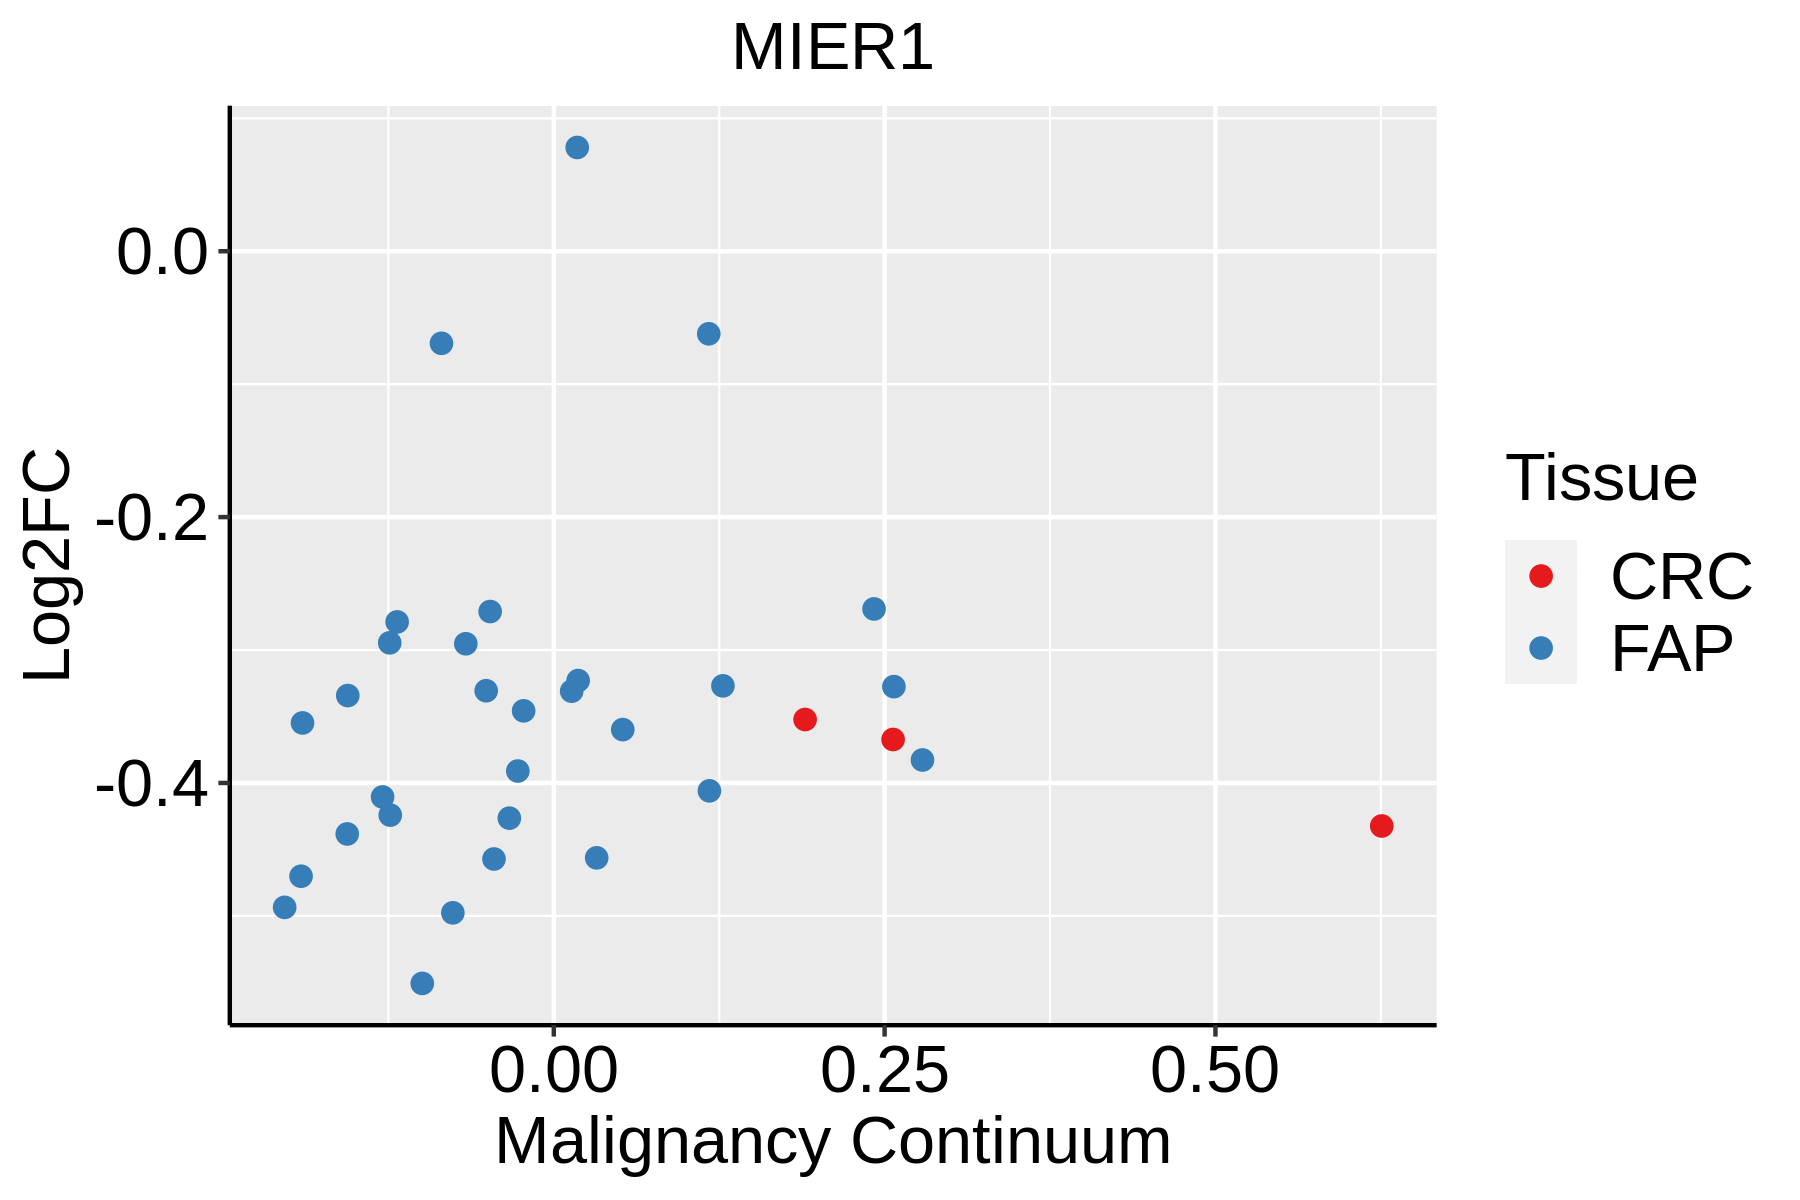
FAP: Familial adenomatous polyposis
CRC: Colorectal cancer
Colorectum (HTA11)The image shows the transcriptomic changes along malignancy continuum.log2FC in expression of this searched gene in stem-like cells from each diseased tissue sample relative to stem-like cells in normal samples in each tissue plotted against the malignancy continuum. Samples are colored based on if they are from different disease stage.AD: Adenomas
SER: Sessile serrated lesions
MSI-H: Microsatellite-high colorectal cancer
MSS: Microsatellite stable colorectal cancer
EsophagusThe image shows the transcriptomic changes along malignancy continuum.log2FC in expression of this searched gene in stem-like cells from each diseased tissue sample relative to stem-like cells in normal samples in each tissue plotted against the malignancy continuum. Samples are colored based on if they are from different disease stage.
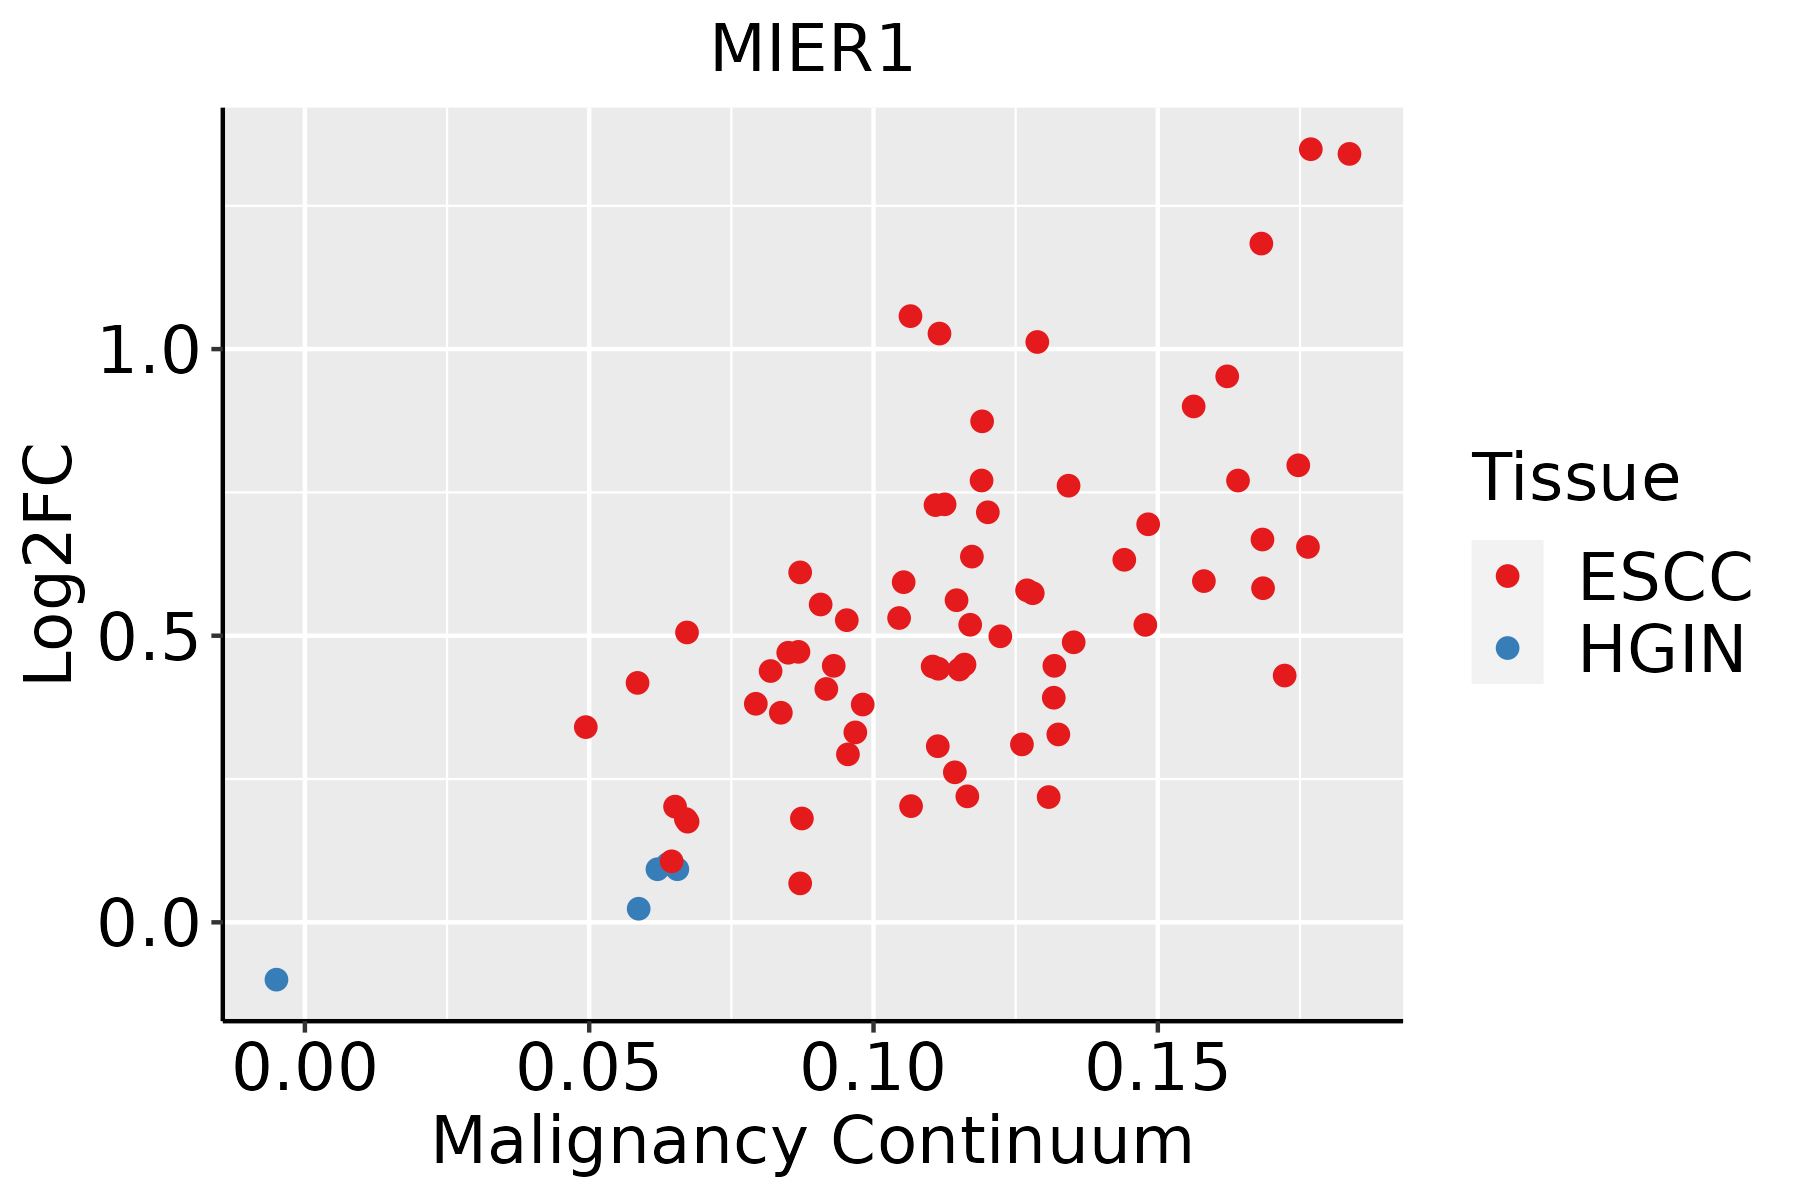
ESCC: Esophageal squamous cell carcinoma
HGIN: High-grade intraepithelial neoplasias
LGIN: Low-grade intraepithelial neoplasias
LiverThe image shows the transcriptomic changes along malignancy continuum.log2FC in expression of this searched gene in stem-like cells from each diseased tissue sample relative to stem-like cells in normal samples in each tissue plotted against the malignancy continuum. Samples are colored based on if they are from different disease stage.
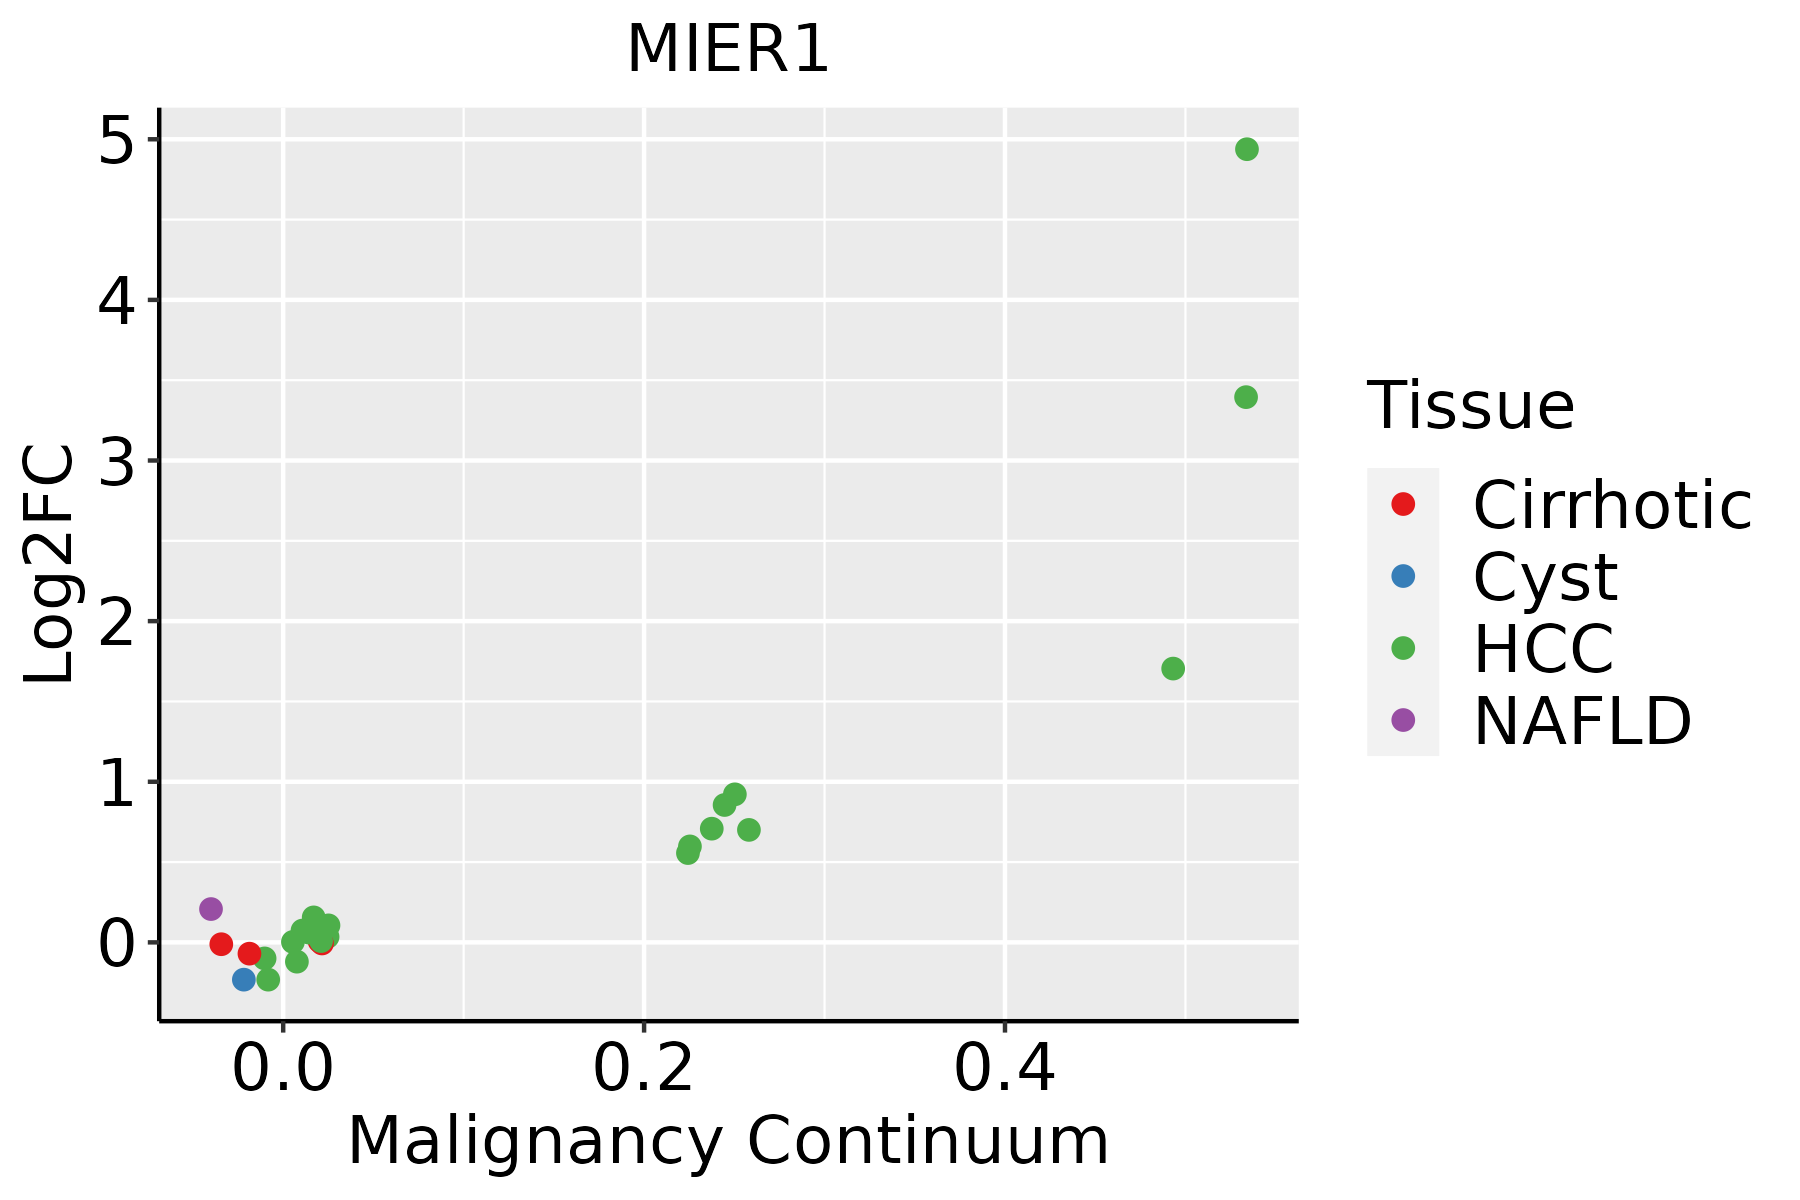
HCC: Hepatocellular carcinoma
NAFLD: Non-alcoholic fatty liver disease
LungThe image shows the transcriptomic changes along malignancy continuum.log2FC in expression of this searched gene in stem-like cells from each diseased tissue sample relative to stem-like cells in normal samples in each tissue plotted against the malignancy continuum. Samples are colored based on if they are from different disease stage.
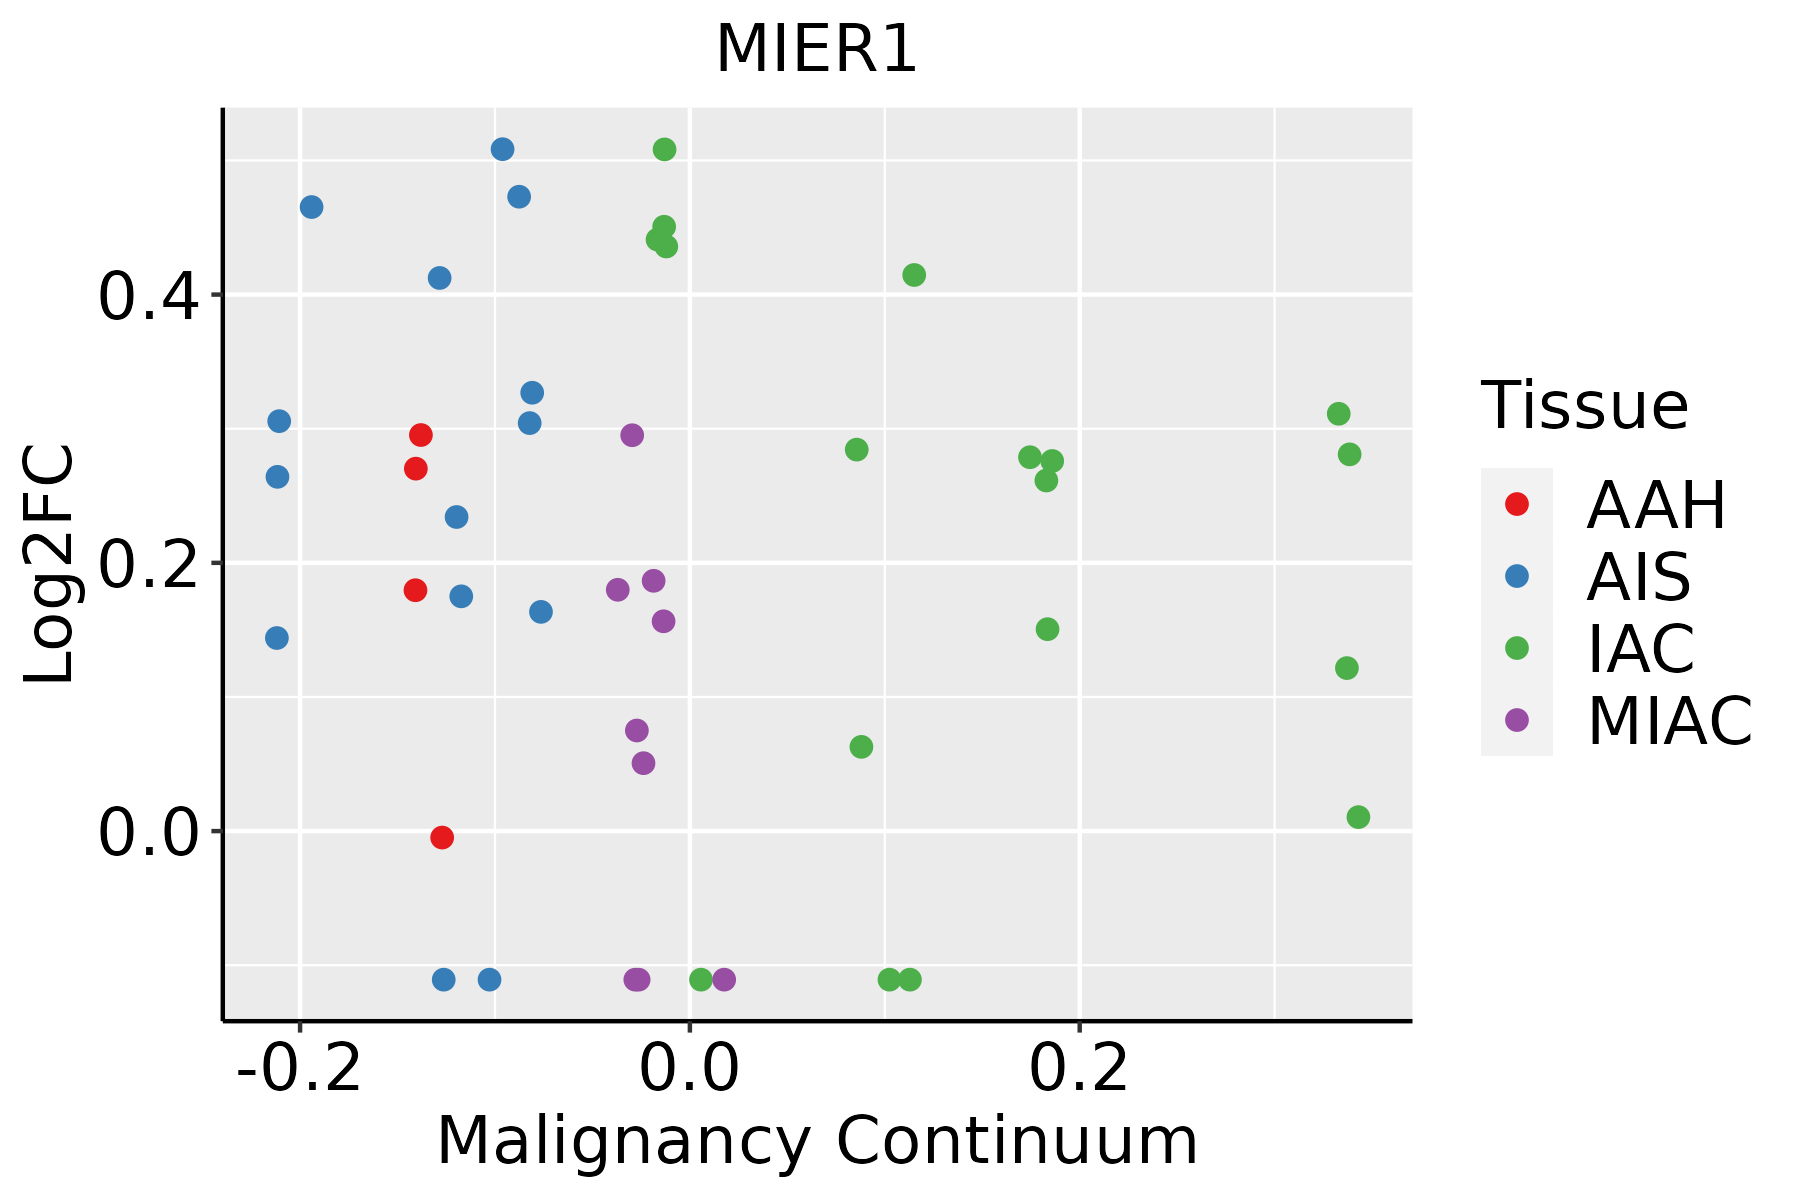
AAH: Atypical adenomatous hyperplasia
AIS: Adenocarcinoma in situ
IAC: Invasive lung adenocarcinoma
MIA: Minimally invasive adenocarcinoma
Oral CavityThe image shows the transcriptomic changes along malignancy continuum.log2FC in expression of this searched gene in stem-like cells from each diseased tissue sample relative to stem-like cells in normal samples in each tissue plotted against the malignancy continuum. Samples are colored based on if they are from different disease stage.
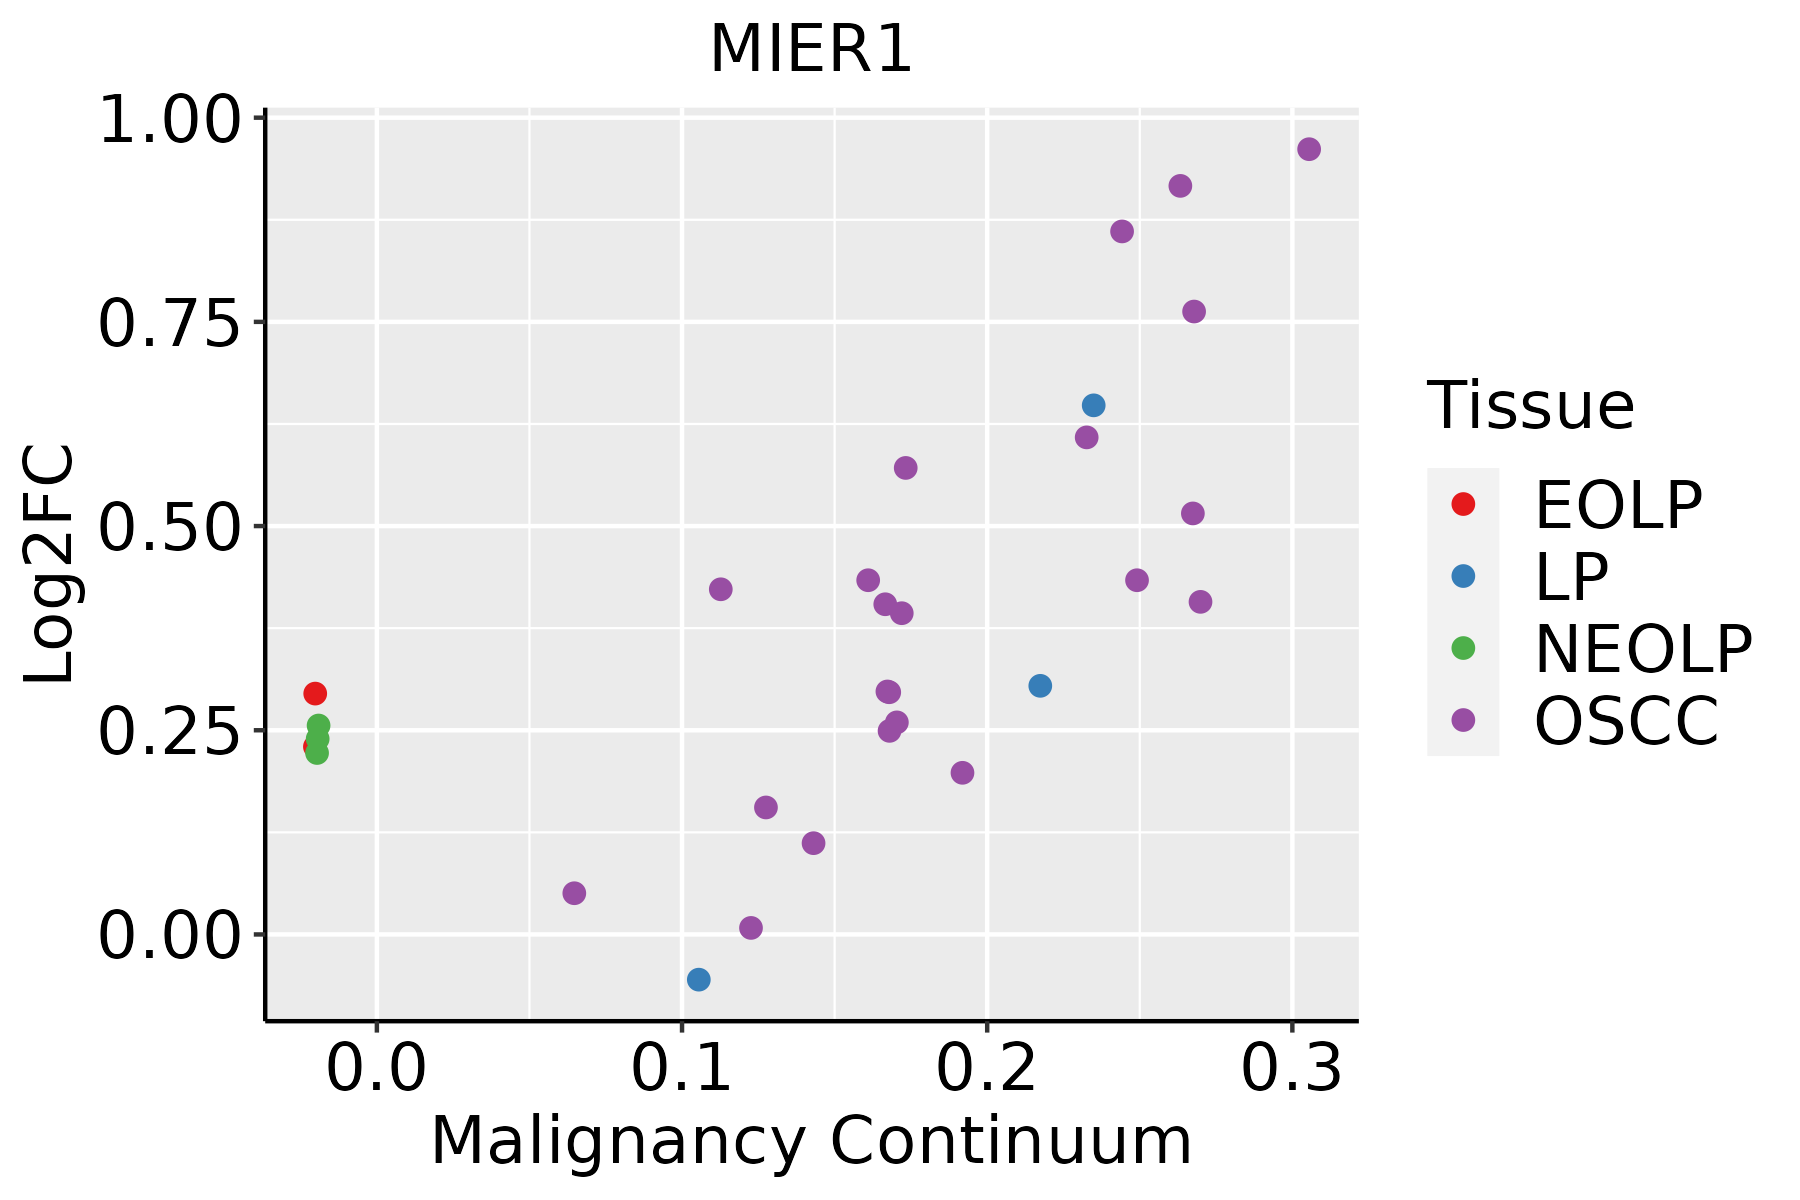
EOLP: Erosive Oral lichen planus
LP: leukoplakia
NEOLP: Non-erosive oral lichen planus
OSCC: Oral squamous cell carcinoma
SkinThe image shows the transcriptomic changes along malignancy continuum.log2FC in expression of this searched gene in stem-like cells from each diseased tissue sample relative to stem-like cells in normal samples in each tissue plotted against the malignancy continuum. Samples are colored based on if they are from different disease stage.
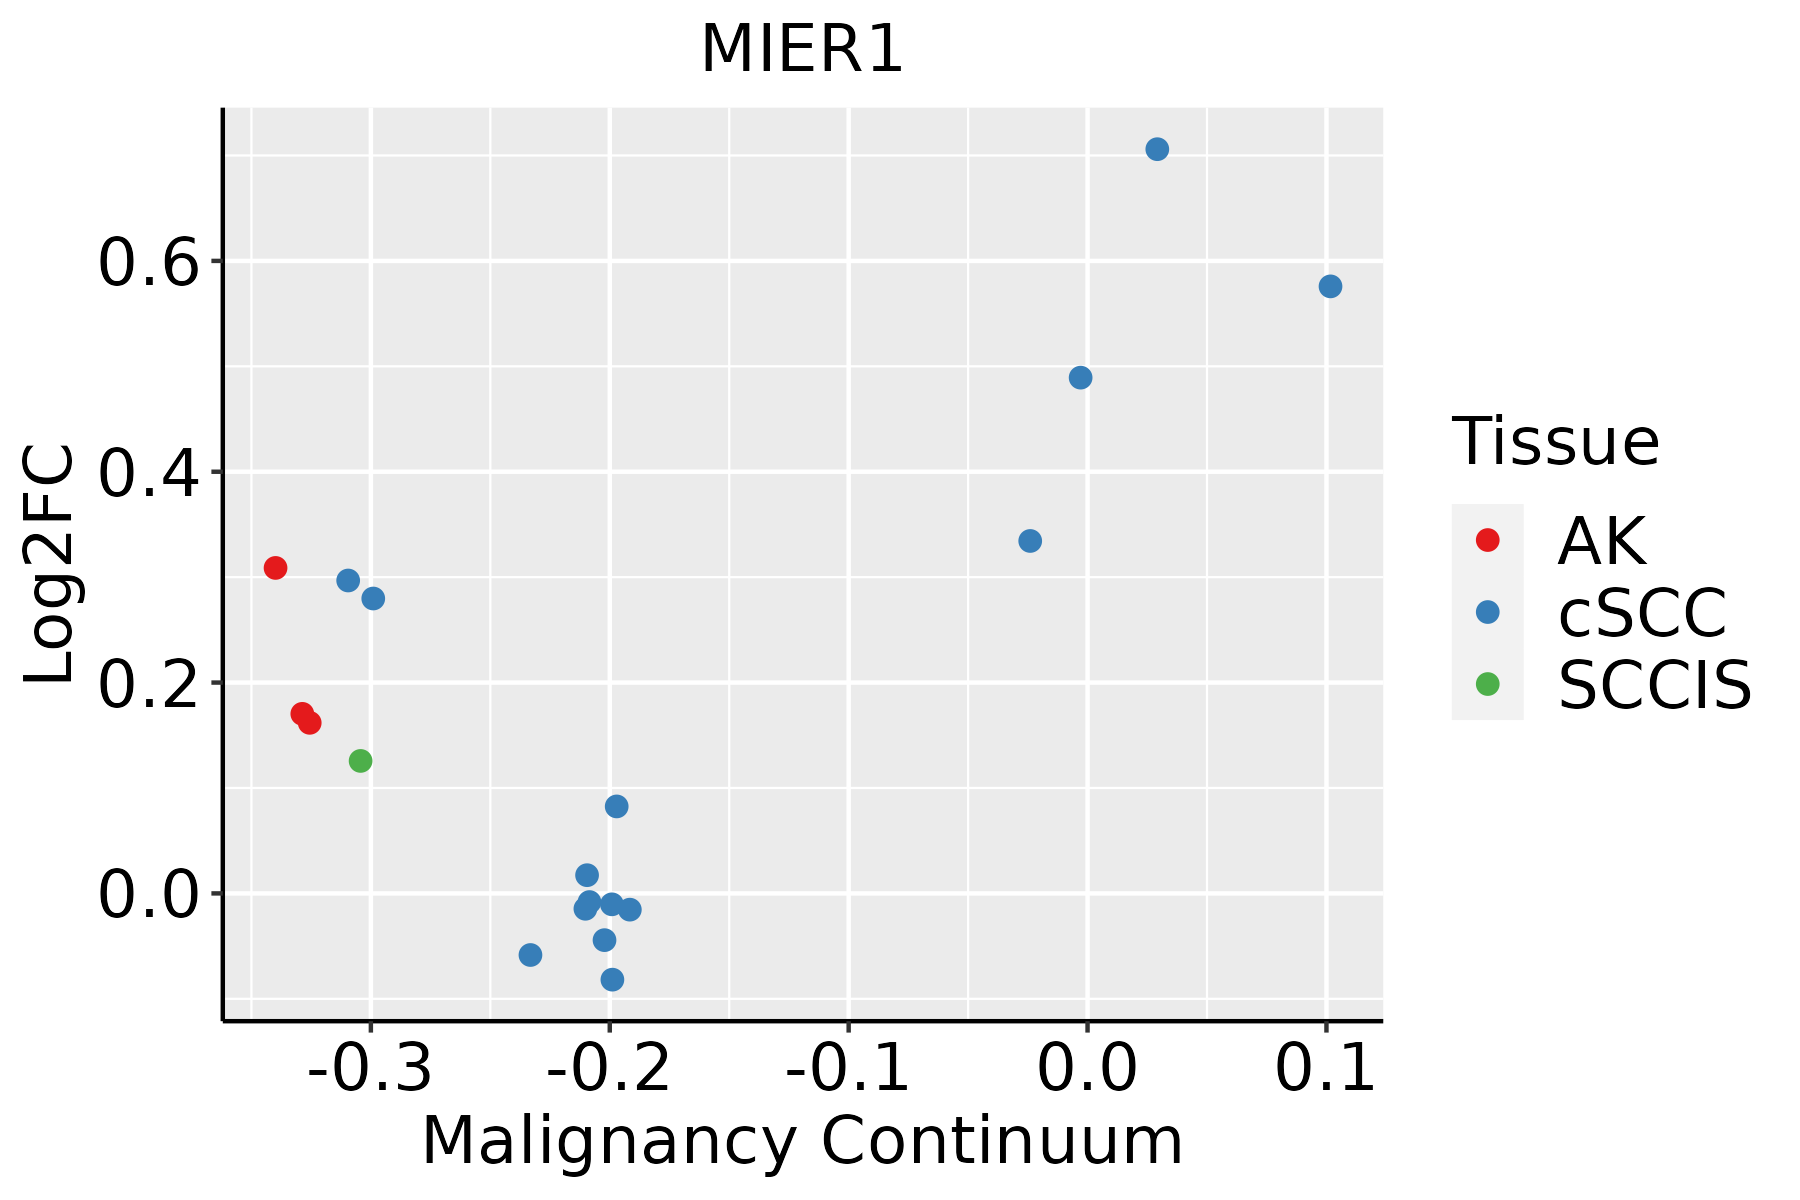
AK: Actinic keratosis
cSCC: Cutaneous squamous cell carcinoma
SCCIS:squamous cell carcinoma in situ
ThyroidThe image shows the transcriptomic changes along malignancy continuum.log2FC in expression of this searched gene in stem-like cells from each diseased tissue sample relative to stem-like cells in normal samples in each tissue plotted against the malignancy continuum. Samples are colored based on if they are from different disease stage.
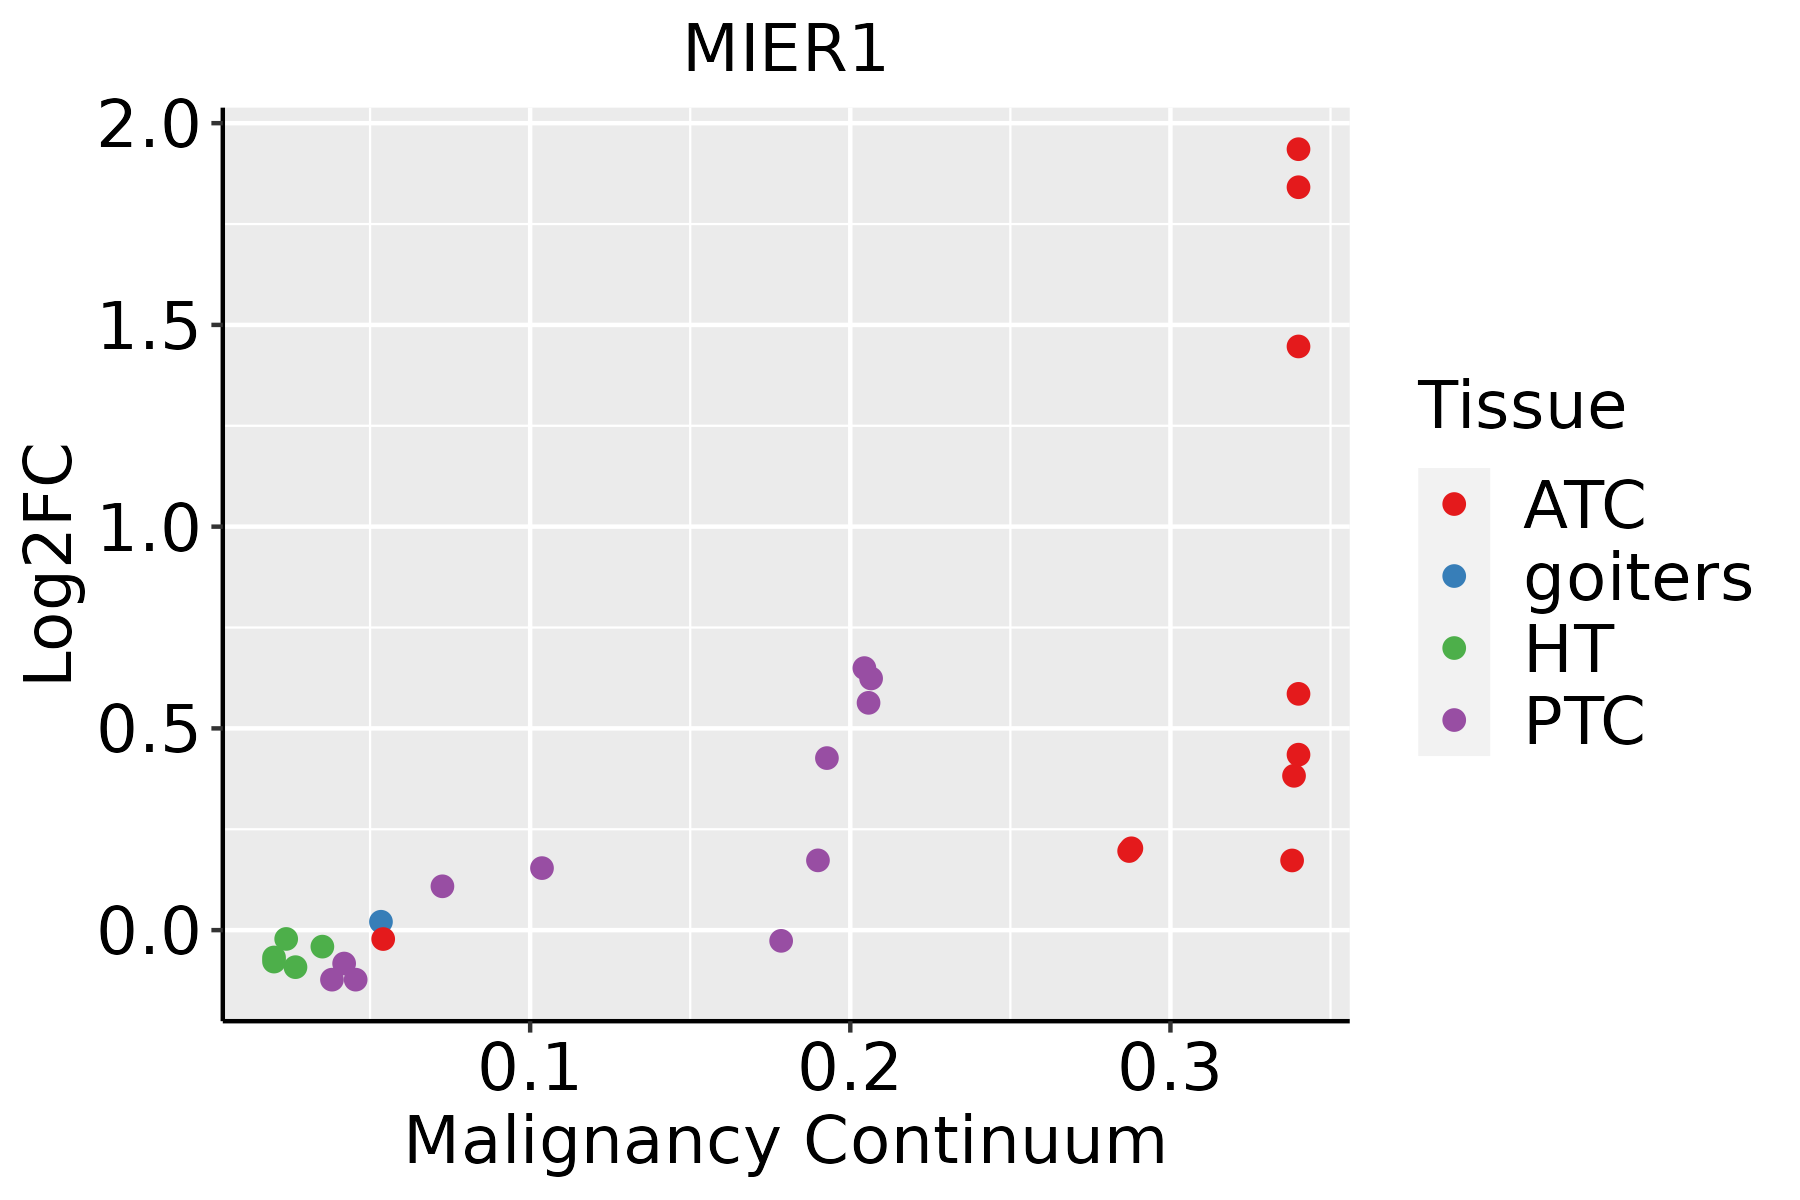
ATC: Anaplastic thyroid cancer
HT: Hashimoto's thyroiditis
PTC: Papillary thyroid cancer
∗log2FC in expression of this searched gene in stem-like cells from each diseased tissue sample relative to stem-like cells in normal samples in each tissue plotted against the malignancy continuum. Samples are colored based on if they are from different disease stage.

Top

Malignant transformation related pathway analysis

check buttonFind out the enriched GO biological processes and KEGG pathways involved in transition from healthy to precancer to cancer
check button Figure of enriched GO biological processes.
TissueDisease StageEnriched GO biological Processes
ColorectumADGO analysis - Figure of enriched GO biological processes: Top 15 enriched GO BP terms are showed in the bar plot of each disease state in each tissue. Each row represents a significant GO biological process which is colored according to the -log10(p.adjust).
ColorectumSERGO analysis - Figure of enriched GO biological processes: Top 15 enriched GO BP terms are showed in the bar plot of each disease state in each tissue. Each row represents a significant GO biological process which is colored according to the -log10(p.adjust).
ColorectumMSSGO analysis - Figure of enriched GO biological processes: Top 15 enriched GO BP terms are showed in the bar plot of each disease state in each tissue. Each row represents a significant GO biological process which is colored according to the -log10(p.adjust).
ColorectumMSI-HGO analysis - Figure of enriched GO biological processes: Top 15 enriched GO BP terms are showed in the bar plot of each disease state in each tissue. Each row represents a significant GO biological process which is colored according to the -log10(p.adjust).
ColorectumFAPGO analysis - Figure of enriched GO biological processes: Top 15 enriched GO BP terms are showed in the bar plot of each disease state in each tissue. Each row represents a significant GO biological process which is colored according to the -log10(p.adjust).
∗Top 15 enriched GO BP terms are showed in the bar plot of each disease state in each tissue. Each row represents a significant GO biological process which is colored according to the -log10(p.adjust).
Page: 1 2 3 4 5 6 7 8 9 

check button Enriched GO biological processes.
GO IDTissueDisease StageDescriptionGene RatioBg Ratiopvaluep.adjustCount
GO:0043123ColorectumADpositive regulation of I-kappaB kinase/NF-kappaB signaling60/3918186/187231.91e-042.56e-0360
GO:0043122ColorectumADregulation of I-kappaB kinase/NF-kappaB signaling76/3918249/187232.17e-042.85e-0376
GO:0007249ColorectumADI-kappaB kinase/NF-kappaB signaling82/3918281/187236.09e-046.40e-0382
GO:00431221ColorectumMSSregulation of I-kappaB kinase/NF-kappaB signaling71/3467249/187237.12e-051.21e-0371
GO:00072491ColorectumMSSI-kappaB kinase/NF-kappaB signaling77/3467281/187231.51e-042.19e-0377
GO:00431231ColorectumMSSpositive regulation of I-kappaB kinase/NF-kappaB signaling55/3467186/187231.60e-042.29e-0355
GO:0016570ColorectumMSShistone modification113/3467463/187238.37e-048.68e-03113
GO:00165701ColorectumFAPhistone modification94/2622463/187231.06e-041.76e-0394
GO:00431222ColorectumFAPregulation of I-kappaB kinase/NF-kappaB signaling56/2622249/187231.82e-042.69e-0356
GO:00431232ColorectumFAPpositive regulation of I-kappaB kinase/NF-kappaB signaling42/2622186/187231.01e-039.89e-0342
GO:00072492ColorectumFAPI-kappaB kinase/NF-kappaB signaling58/2622281/187231.37e-031.24e-0258
GO:00165702ColorectumCRChistone modification75/2078463/187234.95e-047.06e-0375
GO:00431223ColorectumCRCregulation of I-kappaB kinase/NF-kappaB signaling41/2078249/187236.39e-034.64e-0241
GO:001657015EsophagusESCChistone modification323/8552463/187232.61e-267.88e-24323
GO:004312318EsophagusESCCpositive regulation of I-kappaB kinase/NF-kappaB signaling132/8552186/187232.07e-128.58e-11132
GO:0043122110EsophagusESCCregulation of I-kappaB kinase/NF-kappaB signaling167/8552249/187236.11e-122.32e-10167
GO:000724919EsophagusESCCI-kappaB kinase/NF-kappaB signaling183/8552281/187233.02e-111.01e-09183
GO:00356015EsophagusESCCprotein deacylation79/8552112/187238.30e-081.42e-0679
GO:00987325EsophagusESCCmacromolecule deacylation80/8552116/187233.19e-074.50e-0680
GO:00165754EsophagusESCChistone deacetylation60/855282/187233.85e-075.32e-0660
Page: 1 2 3 4 5 

check button Enriched KEGG pathways.
Pathway IDTissueDisease StageDescriptionGene RatioBg Ratiopvaluep.adjustqvalueCount
Page: 1 

Top

Cell-cell communication analysis

check buttonIdentification of potential cell-cell interactions between two cell types and their ligand-receptor pairs for different disease states
LigandReceptorLRpairPathwayTissueDisease Stage
Page: 1 

Top

Single-cell gene regulatory network inference analysis

check buttonFind out the significant the regulons (TFs) and the target genes of each regulon across cell types for different disease states
TFCell TypeTissueDisease StageTarget GeneRSSRegulon Activity
∗The dot plots of a searched regulon are shown for all cell subpopulations in each disease state of each tissue based on the regulon specific score inferred using pySCENIC and by calculating the average expression.
Page: 1 

Top

Somatic mutation of malignant transformation related genes

check buttonAnnotation of somatic variants for genes involved in malignant transformation
Hugo SymbolVariant ClassVariant ClassificationdbSNP RSHGVScHGVSpHGVSp ShortSWISSPROTBIOTYPESIFTPolyPhenTumor Sample BarcodeTissueHistologySexAgeStageTherapy TypesDrugsOutcome
MIER1SNVMissense_Mutationnovelc.1414N>Cp.Val472Leup.V472LQ8N108protein_codingtolerated(0.21)benign(0.003)TCGA-3C-AALI-01Breastbreast invasive carcinomaFemale<65I/IIUnspecificPoly EComplete Response
MIER1SNVMissense_Mutationc.1423N>Cp.Glu475Glnp.E475QQ8N108protein_codingdeleterious(0.05)benign(0.03)TCGA-A8-A06Q-01Breastbreast invasive carcinomaFemale<65III/IVUnknownUnknownSD
MIER1SNVMissense_Mutationc.328N>Ap.Asp110Asnp.D110NQ8N108protein_codingtolerated(0.09)benign(0.387)TCGA-D8-A27G-01Breastbreast invasive carcinomaFemale>=65I/IIUnknownUnknownSD
MIER1deletionFrame_Shift_Delnovelc.1503delNp.Asp502IlefsTer12p.D502Ifs*12Q8N108protein_codingTCGA-A7-A425-01Breastbreast invasive carcinomaFemale>=65III/IVChemotherapyadriamycinPD
MIER1insertionNonsense_Mutationnovelc.160_161insAATGCACACAACACAAGGAAGTTACTGGGAATTCTTCTGTCTAGCCTp.Val54GlufsTer15p.V54Efs*15Q8N108protein_codingTCGA-AR-A1AL-01Breastbreast invasive carcinomaFemale<65III/IVHormone TherapyanastrozoleSD
MIER1deletionFrame_Shift_Delnovelc.304delAp.Thr102GlnfsTer7p.T102Qfs*7Q8N108protein_codingTCGA-D8-A27V-01Breastbreast invasive carcinomaFemale<65I/IIHormone TherapytamoxiphenSD
MIER1SNVMissense_Mutationc.451N>Ap.Asp151Asnp.D151NQ8N108protein_codingtolerated(0.47)benign(0.25)TCGA-DR-A0ZM-01Cervixcervical & endocervical cancerFemale<65III/IVUnspecificCisplatinSD
MIER1SNVMissense_Mutationc.418G>Ap.Glu140Lysp.E140KQ8N108protein_codingtolerated(0.39)benign(0.065)TCGA-EA-A439-01Cervixcervical & endocervical cancerFemale<65I/IIUnknownUnknownPD
MIER1SNVMissense_Mutationc.658G>Ap.Glu220Lysp.E220KQ8N108protein_codingdeleterious(0.04)benign(0.277)TCGA-EK-A2PG-01Cervixcervical & endocervical cancerFemale>=65I/IIUnknownUnknownSD
MIER1SNVMissense_Mutationc.138G>Cp.Arg46Serp.R46SQ8N108protein_codingdeleterious_low_confidence(0.04)benign(0.027)TCGA-A6-6781-01Colorectumcolon adenocarcinomaMale<65III/IVChemotherapyoxaliplatinSD
Page: 1 2 3 4 5 6 7 

Top

Related drugs of malignant transformation related genes

check buttonIdentification of chemicals and drugs interact with genes involved in malignant transfromation
(DGIdb 4.0)
Entrez IDSymbolCategoryInteraction TypesDrug Claim NameDrug NamePMIDs
Page: 1