Schematic overview of the cellular and molecular mechanisms involved in the cancer progression, including the proposed cellular and molecular mechanisms in cancer cells trajectory. AT1: alveolar type 1 cells; AT2: alveolar type 2 cells; AAH: atypical adenomatous hyperplasia; AIS: adenocarcinoma in situ; MIA: minimally invasive adenocarcinoma; IA: invasive adenocarcinoma; EMT: epithelial-mesenchymal transition

Home

Download

Statistics

Help

Contact

Center for Computational Systems Medicine
leaf

Gene summary

leaf

Malignant transformation analysis

leaf

Malignant transformation related pathway analysis

leaf

Cell-cell communication analysis

leaf

Single-cell gene regulatory network inference analysis

leaf

Somatic mutation of malignant transformation related genes

leaf

Related drugs of malignant transformation related genes

Gene: MIEN1

Gene summary for MIEN1

check button Gene summary.

Gene informationSpeciesHuman
Gene symbol

MIEN1

Gene ID

84299

Gene namemigration and invasion enhancer 1
Gene AliasC17orf37
Cytomap17q12
Gene Typeprotein-coding
GO ID

GO:0006915

UniProtAcc

J3KTI2


Top

Malignant transformation analysis

check button Identification of the aberrant gene expression in precancerous and cancerous lesions by comparing the gene expression of stem-like cells in diseased tissues with normal stem cells
check button Malignant transformation involving gene list.
Entrez IDSymbolReplicatesSpeciesOrganTissueAdj P-valueLog2FCMalignancy
84299MIEN1GSM4909285HumanBreastIDC1.60e-03-2.16e-010.21
84299MIEN1GSM4909288HumanBreastIDC6.47e-05-4.30e-010.0988
84299MIEN1GSM4909289HumanBreastIDC8.97e-299.46e-010.1064
84299MIEN1GSM4909290HumanBreastIDC1.48e-971.21e+000.2096
84299MIEN1GSM4909291HumanBreastIDC9.07e-761.14e+000.1753
84299MIEN1GSM4909292HumanBreastIDC2.11e-219.57e-010.1236
84299MIEN1GSM4909293HumanBreastIDC4.48e-1671.35e+000.1581
84299MIEN1GSM4909294HumanBreastIDC2.29e-1231.25e+000.2022
84299MIEN1GSM4909296HumanBreastIDC6.77e-15-2.25e-010.1524
84299MIEN1GSM4909297HumanBreastIDC5.95e-16-5.51e-020.1517
84299MIEN1GSM4909301HumanBreastIDC4.14e-082.92e-010.1577
84299MIEN1GSM4909307HumanBreastIDC5.05e-083.81e-010.1569
84299MIEN1GSM4909308HumanBreastIDC5.95e-174.99e-010.158
84299MIEN1GSM4909309HumanBreastIDC1.55e-046.36e-020.0483
84299MIEN1GSM4909311HumanBreastIDC3.98e-33-3.43e-010.1534
84299MIEN1GSM4909312HumanBreastIDC3.10e-14-2.29e-010.1552
84299MIEN1GSM4909315HumanBreastIDC9.14e-05-2.84e-010.21
84299MIEN1GSM4909316HumanBreastIDC1.47e-03-2.45e-010.21
84299MIEN1GSM4909318HumanBreastIDC4.08e-022.56e-010.2031
84299MIEN1GSM4909319HumanBreastIDC5.45e-50-1.25e-010.1563
Page: 1 2 3 4 5 6 7 8 9 10 

check button Transcriptomic changes along malignancy continuum.
TissueExpression DynamicsAbbreviation
BreastThe image shows the transcriptomic changes along malignancy continuum.log2FC in expression of this searched gene in stem-like cells from each diseased tissue sample relative to stem-like cells in normal samples in each tissue plotted against the malignancy continuum. Samples are colored based on if they are from different disease stage.
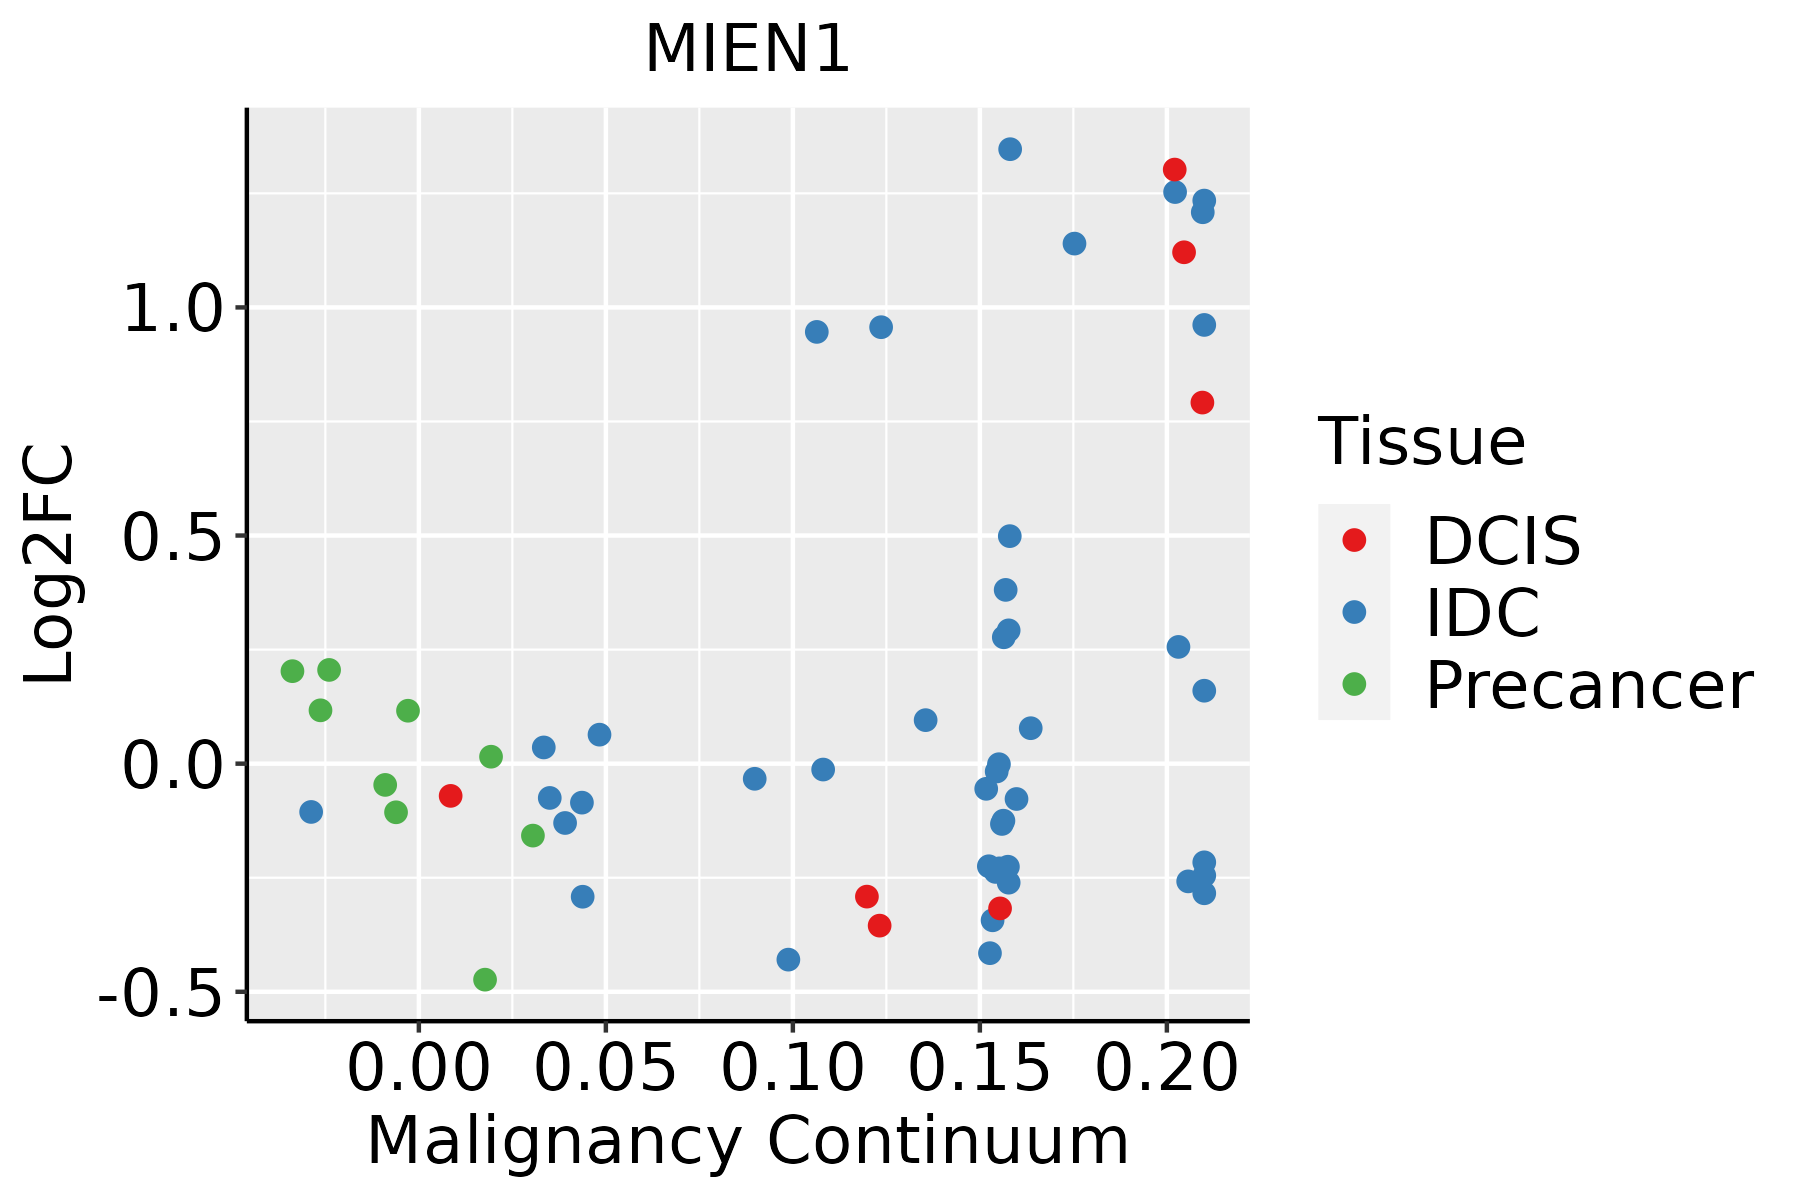
IDC: Invasive ductal carcinoma
DCIS: Ductal carcinoma in situ
Precancer(BRCA1-mut): Precancerous lesion from BRCA1 mutation carriers
Colorectum (GSE201348)The image shows the transcriptomic changes along malignancy continuum.log2FC in expression of this searched gene in stem-like cells from each diseased tissue sample relative to stem-like cells in normal samples in each tissue plotted against the malignancy continuum. Samples are colored based on if they are from different disease stage.FAP: Familial adenomatous polyposis
CRC: Colorectal cancer
Colorectum (HTA11)The image shows the transcriptomic changes along malignancy continuum.log2FC in expression of this searched gene in stem-like cells from each diseased tissue sample relative to stem-like cells in normal samples in each tissue plotted against the malignancy continuum. Samples are colored based on if they are from different disease stage.AD: Adenomas
SER: Sessile serrated lesions
MSI-H: Microsatellite-high colorectal cancer
MSS: Microsatellite stable colorectal cancer
EsophagusThe image shows the transcriptomic changes along malignancy continuum.log2FC in expression of this searched gene in stem-like cells from each diseased tissue sample relative to stem-like cells in normal samples in each tissue plotted against the malignancy continuum. Samples are colored based on if they are from different disease stage.ESCC: Esophageal squamous cell carcinoma
HGIN: High-grade intraepithelial neoplasias
LGIN: Low-grade intraepithelial neoplasias
LiverThe image shows the transcriptomic changes along malignancy continuum.log2FC in expression of this searched gene in stem-like cells from each diseased tissue sample relative to stem-like cells in normal samples in each tissue plotted against the malignancy continuum. Samples are colored based on if they are from different disease stage.
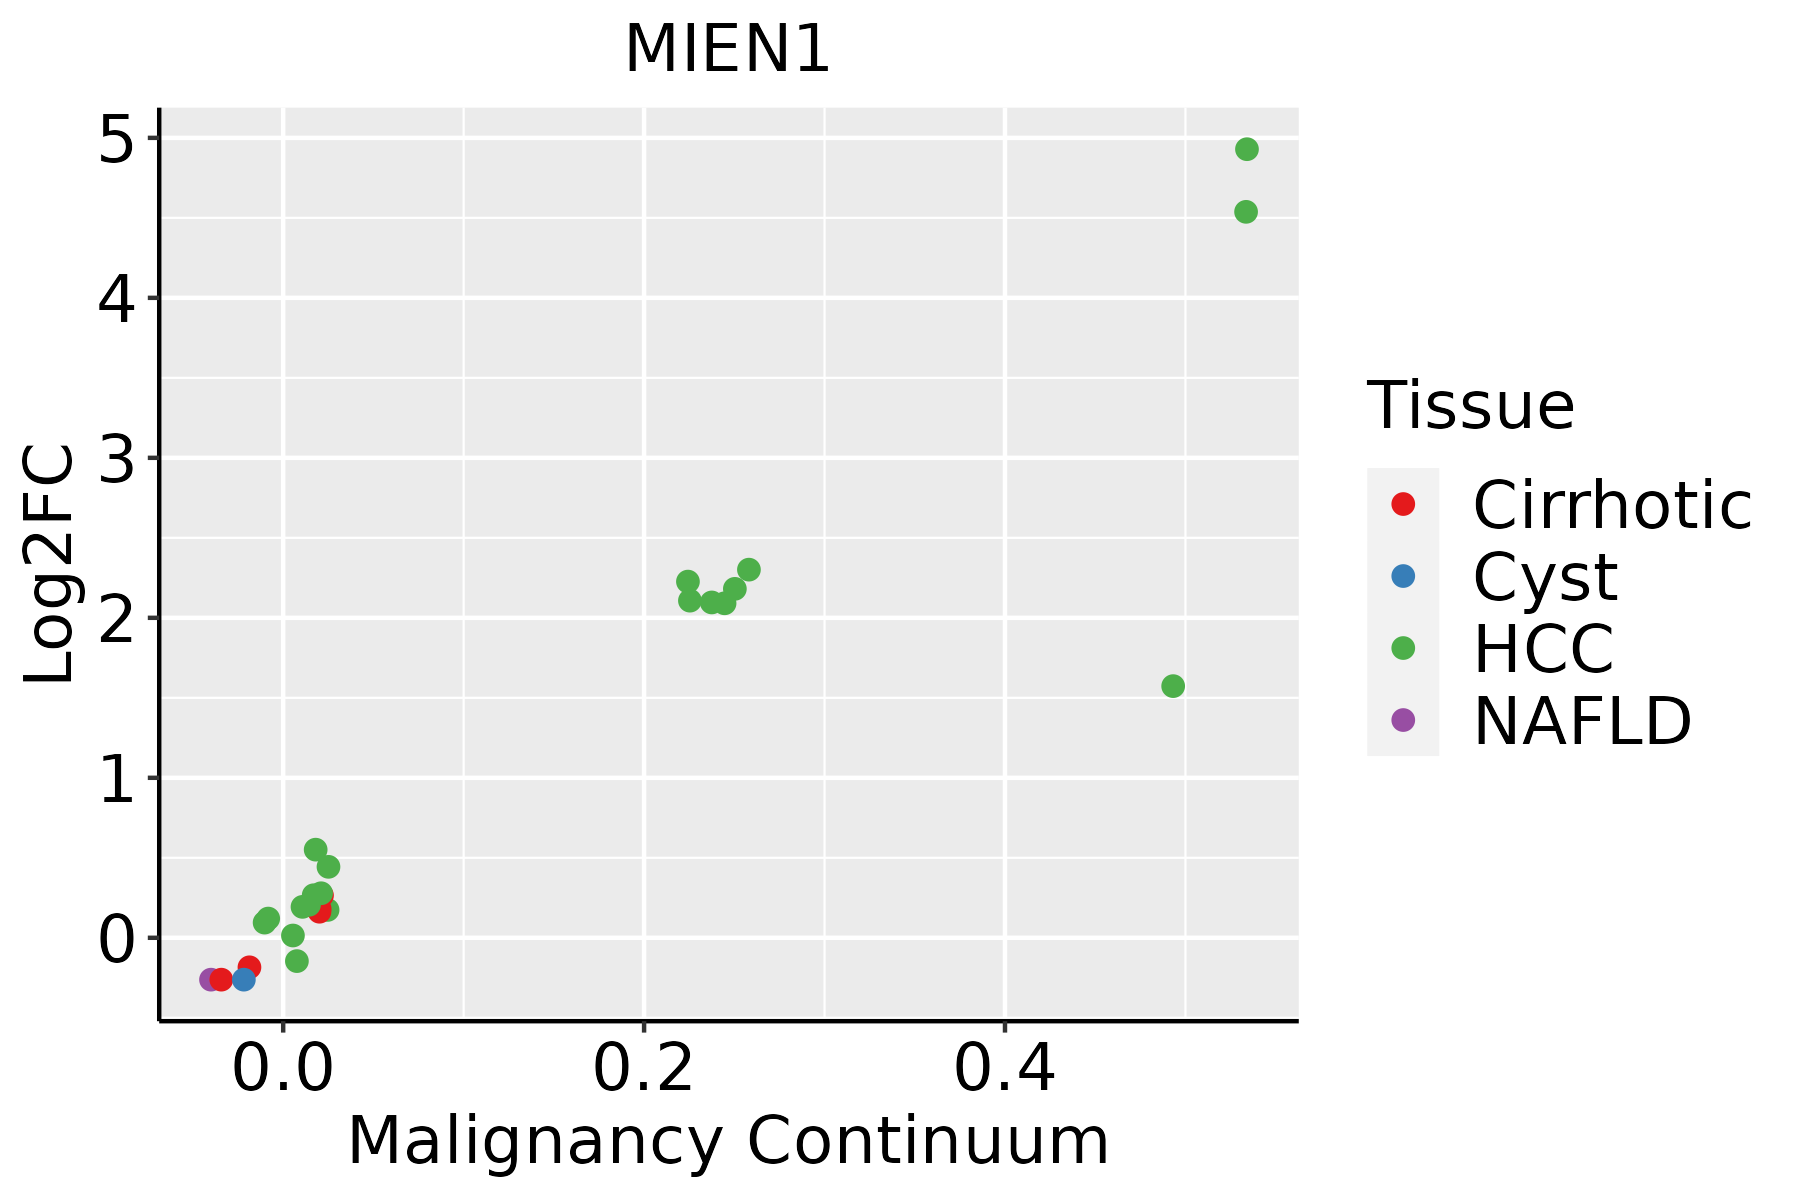
HCC: Hepatocellular carcinoma
NAFLD: Non-alcoholic fatty liver disease
Oral CavityThe image shows the transcriptomic changes along malignancy continuum.log2FC in expression of this searched gene in stem-like cells from each diseased tissue sample relative to stem-like cells in normal samples in each tissue plotted against the malignancy continuum. Samples are colored based on if they are from different disease stage.EOLP: Erosive Oral lichen planus
LP: leukoplakia
NEOLP: Non-erosive oral lichen planus
OSCC: Oral squamous cell carcinoma
ProstateThe image shows the transcriptomic changes along malignancy continuum.log2FC in expression of this searched gene in stem-like cells from each diseased tissue sample relative to stem-like cells in normal samples in each tissue plotted against the malignancy continuum. Samples are colored based on if they are from different disease stage.
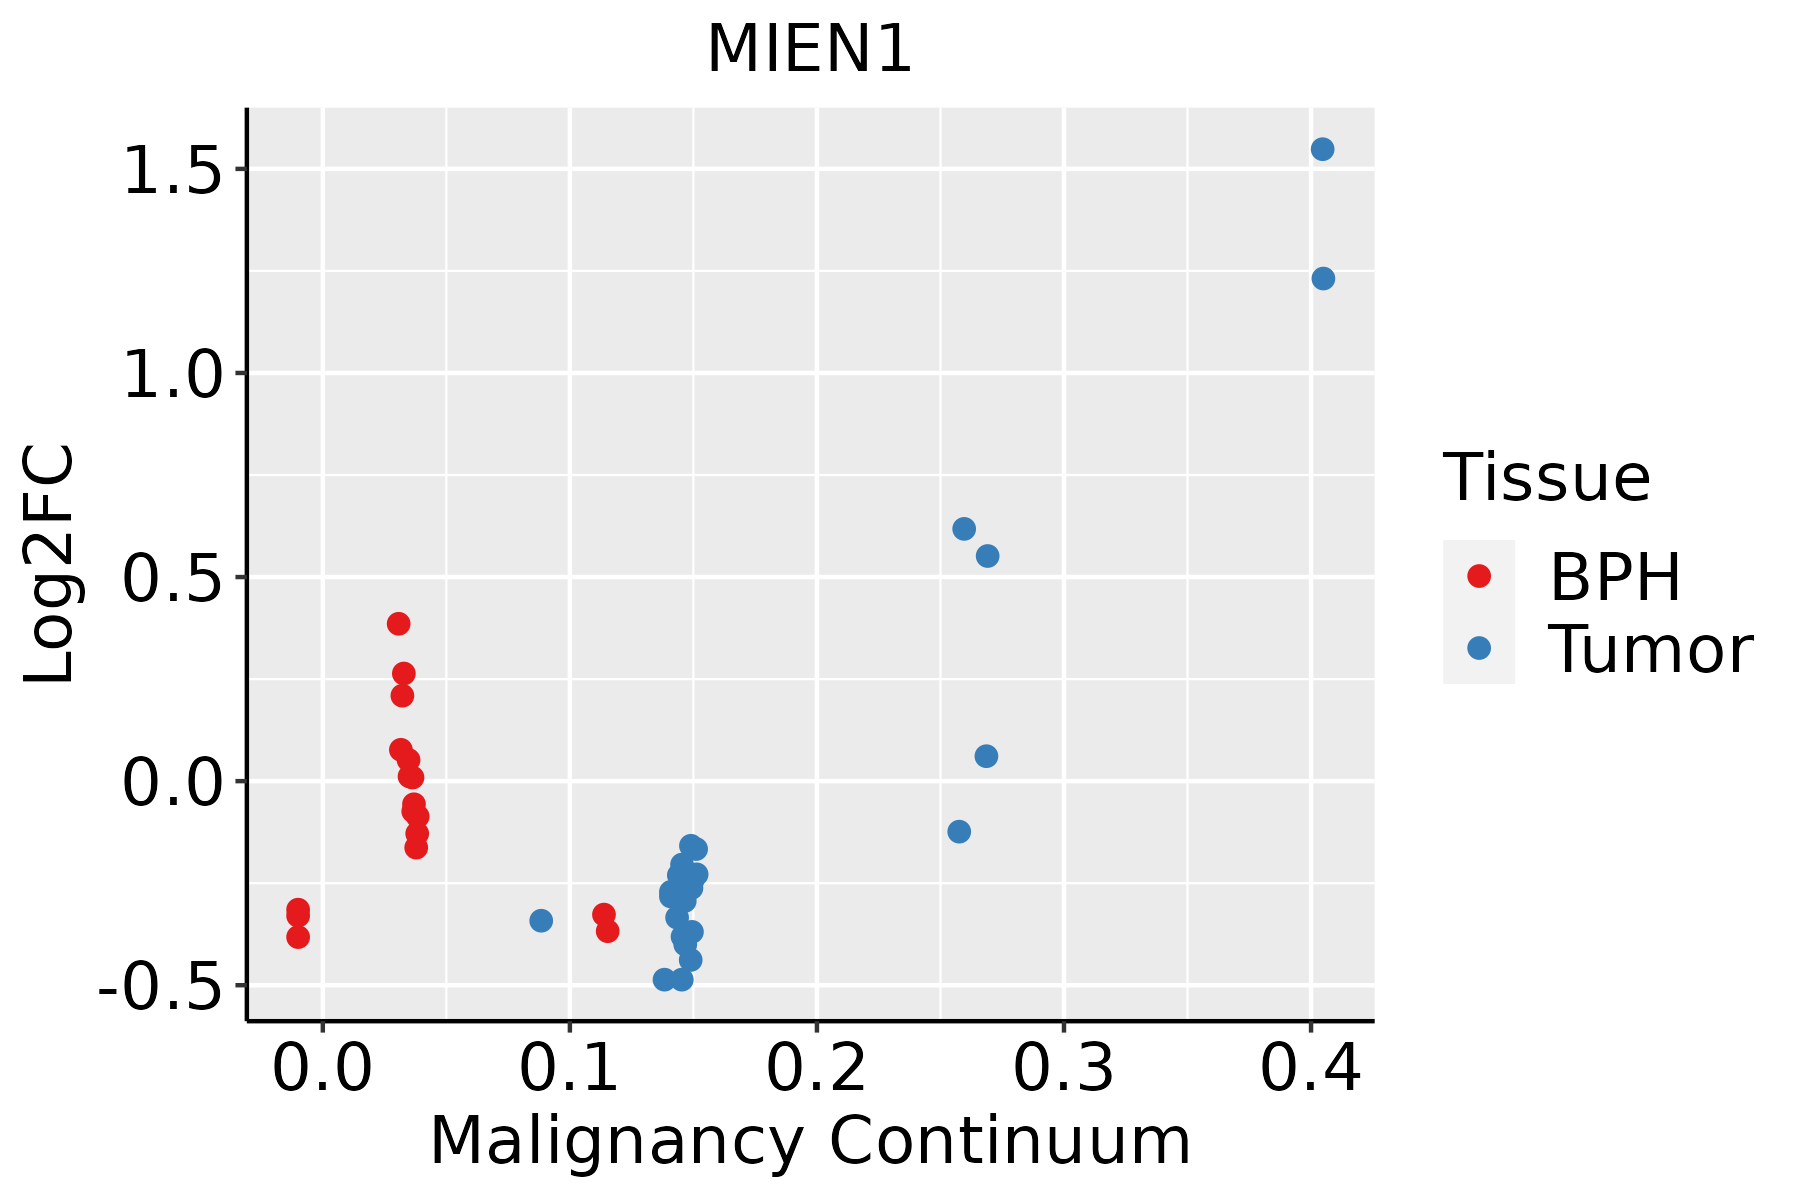
BPH: Benign Prostatic Hyperplasia
SkinThe image shows the transcriptomic changes along malignancy continuum.log2FC in expression of this searched gene in stem-like cells from each diseased tissue sample relative to stem-like cells in normal samples in each tissue plotted against the malignancy continuum. Samples are colored based on if they are from different disease stage.
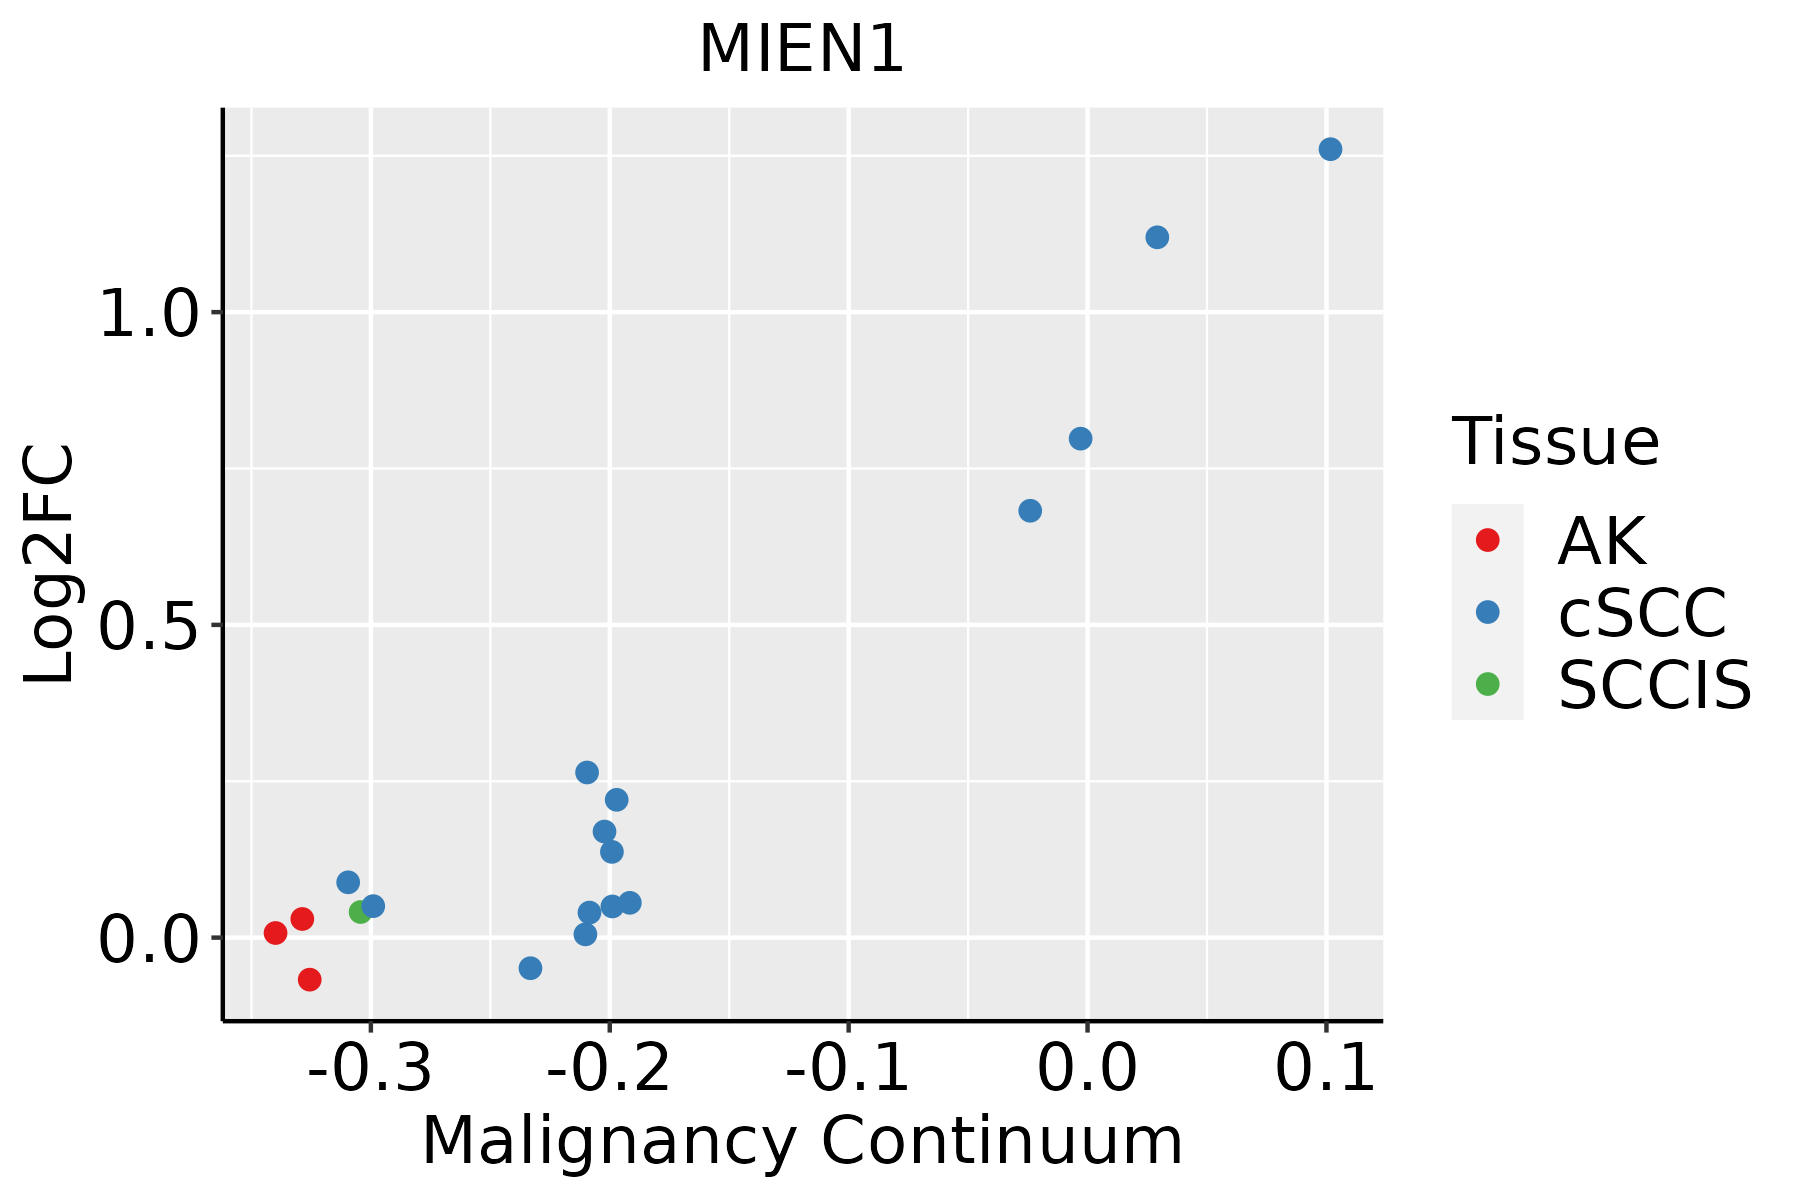
AK: Actinic keratosis
cSCC: Cutaneous squamous cell carcinoma
SCCIS:squamous cell carcinoma in situ
ThyroidThe image shows the transcriptomic changes along malignancy continuum.log2FC in expression of this searched gene in stem-like cells from each diseased tissue sample relative to stem-like cells in normal samples in each tissue plotted against the malignancy continuum. Samples are colored based on if they are from different disease stage.
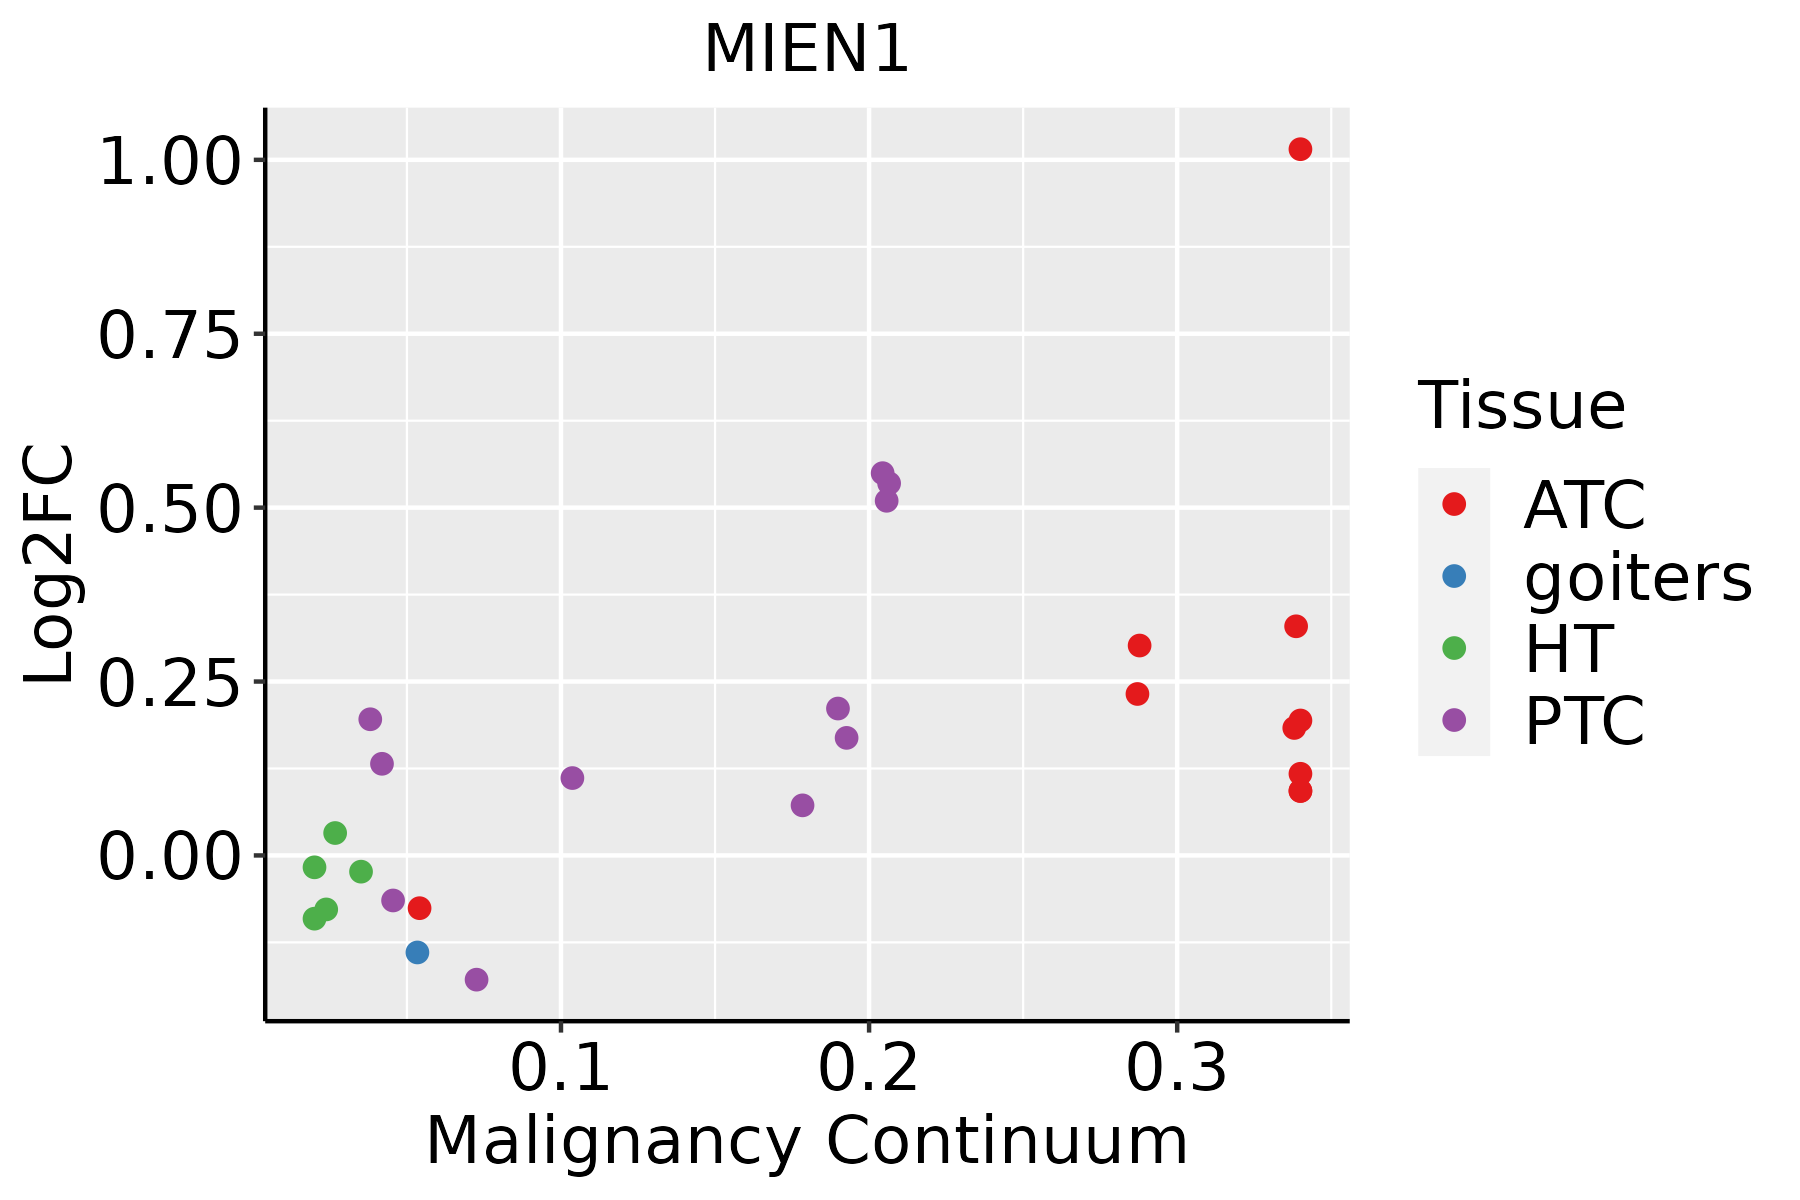
ATC: Anaplastic thyroid cancer
HT: Hashimoto's thyroiditis
PTC: Papillary thyroid cancer
∗log2FC in expression of this searched gene in stem-like cells from each diseased tissue sample relative to stem-like cells in normal samples in each tissue plotted against the malignancy continuum. Samples are colored based on if they are from different disease stage.

Top

Malignant transformation related pathway analysis

check buttonFind out the enriched GO biological processes and KEGG pathways involved in transition from healthy to precancer to cancer
check button Figure of enriched GO biological processes.
TissueDisease StageEnriched GO biological Processes
ColorectumADGO analysis - Figure of enriched GO biological processes: Top 15 enriched GO BP terms are showed in the bar plot of each disease state in each tissue. Each row represents a significant GO biological process which is colored according to the -log10(p.adjust).
ColorectumSERGO analysis - Figure of enriched GO biological processes: Top 15 enriched GO BP terms are showed in the bar plot of each disease state in each tissue. Each row represents a significant GO biological process which is colored according to the -log10(p.adjust).
ColorectumMSSGO analysis - Figure of enriched GO biological processes: Top 15 enriched GO BP terms are showed in the bar plot of each disease state in each tissue. Each row represents a significant GO biological process which is colored according to the -log10(p.adjust).
ColorectumMSI-HGO analysis - Figure of enriched GO biological processes: Top 15 enriched GO BP terms are showed in the bar plot of each disease state in each tissue. Each row represents a significant GO biological process which is colored according to the -log10(p.adjust).
ColorectumFAPGO analysis - Figure of enriched GO biological processes: Top 15 enriched GO BP terms are showed in the bar plot of each disease state in each tissue. Each row represents a significant GO biological process which is colored according to the -log10(p.adjust).
∗Top 15 enriched GO BP terms are showed in the bar plot of each disease state in each tissue. Each row represents a significant GO biological process which is colored according to the -log10(p.adjust).
Page: 1 2 3 4 5 6 7 8 9 

check button Enriched GO biological processes.
GO IDTissueDisease StageDescriptionGene RatioBg Ratiopvaluep.adjustCount
GO:00102691BreastIDCresponse to selenium ion6/143411/187236.59e-051.35e-036
GO:00102692BreastDCISresponse to selenium ion6/139011/187235.53e-051.12e-036
GO:0031346ColorectumADpositive regulation of cell projection organization104/3918353/187238.26e-051.30e-03104
GO:0120034ColorectumADpositive regulation of plasma membrane bounded cell projection assembly33/3918105/187237.49e-034.55e-0233
GO:0120032ColorectumADregulation of plasma membrane bounded cell projection assembly53/3918186/187238.51e-034.97e-0253
GO:00313461ColorectumSERpositive regulation of cell projection organization75/2897353/187232.22e-032.14e-0275
GO:01200321ColorectumSERregulation of plasma membrane bounded cell projection assembly43/2897186/187233.82e-033.16e-0243
GO:0060491ColorectumSERregulation of cell projection assembly43/2897188/187234.68e-033.70e-0243
GO:00313462ColorectumMSSpositive regulation of cell projection organization96/3467353/187233.44e-056.70e-0496
GO:01200322ColorectumMSSregulation of plasma membrane bounded cell projection assembly51/3467186/187231.78e-031.58e-0251
GO:00604911ColorectumMSSregulation of cell projection assembly51/3467188/187232.28e-031.87e-0251
GO:01200341ColorectumMSSpositive regulation of plasma membrane bounded cell projection assembly30/3467105/187237.74e-034.84e-0230
GO:003134616EsophagusESCCpositive regulation of cell projection organization201/8552353/187231.19e-051.11e-04201
GO:006049118EsophagusESCCregulation of cell projection assembly110/8552188/187232.60e-041.58e-03110
GO:012003218EsophagusESCCregulation of plasma membrane bounded cell projection assembly108/8552186/187234.37e-042.46e-03108
GO:01200347EsophagusESCCpositive regulation of plasma membrane bounded cell projection assembly64/8552105/187231.15e-035.70e-0364
GO:01200326LiverCirrhoticregulation of plasma membrane bounded cell projection assembly63/4634186/187233.16e-031.78e-0263
GO:00604915LiverCirrhoticregulation of cell projection assembly63/4634188/187234.17e-032.22e-0263
GO:003134611LiverHCCpositive regulation of cell projection organization193/7958353/187232.28e-063.08e-05193
GO:006049112LiverHCCregulation of cell projection assembly101/7958188/187231.20e-036.69e-03101
Page: 1 2 3 

check button Enriched KEGG pathways.
Pathway IDTissueDisease StageDescriptionGene RatioBg Ratiopvaluep.adjustqvalueCount
Page: 1 

Top

Cell-cell communication analysis

check buttonIdentification of potential cell-cell interactions between two cell types and their ligand-receptor pairs for different disease states
LigandReceptorLRpairPathwayTissueDisease Stage
Page: 1 

Top

Single-cell gene regulatory network inference analysis

check buttonFind out the significant the regulons (TFs) and the target genes of each regulon across cell types for different disease states
TFCell TypeTissueDisease StageTarget GeneRSSRegulon Activity
∗The dot plots of a searched regulon are shown for all cell subpopulations in each disease state of each tissue based on the regulon specific score inferred using pySCENIC and by calculating the average expression.
Page: 1 

Top

Somatic mutation of malignant transformation related genes

check buttonAnnotation of somatic variants for genes involved in malignant transformation
Hugo SymbolVariant ClassVariant ClassificationdbSNP RSHGVScHGVSpHGVSp ShortSWISSPROTBIOTYPESIFTPolyPhenTumor Sample BarcodeTissueHistologySexAgeStageTherapy TypesDrugsOutcome
MIEN1SNVMissense_Mutationnovelc.328N>Gp.His110Aspp.H110Dprotein_codingdeleterious_low_confidence(0)possibly_damaging(0.711)TCGA-AC-A23H-01Breastbreast invasive carcinomaFemale>=65I/IIUnknownUnknownPD
MIEN1deletionFrame_Shift_Delrs757438769c.267_270delGAGTp.Ser90PhefsTer24p.S90Ffs*24protein_codingTCGA-A2-A0T1-01Breastbreast invasive carcinomaFemale<65III/IVTargeted Molecular therapyherceptinSD
MIEN1deletionFrame_Shift_Delrs757438769c.267_270delNNNNp.Ser90PhefsTer24p.S90Ffs*24protein_codingTCGA-A2-A0YD-01Breastbreast invasive carcinomaFemale<65I/IIChemotherapycytoxanSD
MIEN1deletionFrame_Shift_Delrs757438769c.267_270delNNNNp.Ser90PhefsTer24p.S90Ffs*24protein_codingTCGA-EW-A1PC-01Breastbreast invasive carcinomaFemale>=65I/IIHormone TherapytamoxiphenSD
MIEN1SNVMissense_Mutationc.125T>Cp.Leu42Prop.L42Pprotein_codingdeleterious(0)probably_damaging(0.999)TCGA-IR-A3LK-01Cervixcervical & endocervical cancerFemale>=65I/IIChemotherapycisplatinPD
MIEN1SNVMissense_Mutationrs370459758c.335N>Tp.Thr112Ilep.T112Iprotein_codingtolerated_low_confidence(0.09)benign(0.003)TCGA-AY-6197-01Colorectumcolon adenocarcinomaMale<65I/IIUnknownUnknownSD
MIEN1SNVMissense_Mutationc.106N>Ap.Glu36Lysp.E36Kprotein_codingtolerated(0.24)benign(0.163)TCGA-AZ-6599-01Colorectumcolon adenocarcinomaMale>=65I/IIUnknownUnknownSD
MIEN1deletionFrame_Shift_Delrs757438769c.267_270delNNNNp.Ser90PhefsTer24p.S90Ffs*24protein_codingTCGA-AD-6964-01Colorectumcolon adenocarcinomaMale<65III/IVChemotherapyfolfoxPD
MIEN1SNVMissense_Mutationrs190390525c.317N>Tp.Ala106Valp.A106Vprotein_codingtolerated_low_confidence(1)benign(0.005)TCGA-DI-A1BU-01Endometriumuterine corpus endometrioid carcinomaFemale<65I/IIChemotherapypaclitaxelSD
MIEN1deletionIn_Frame_Delnovelc.152_154delCGGp.Pro51_Gly52delinsArgp.P51_G52delinsRprotein_codingTCGA-B5-A0K0-01Endometriumuterine corpus endometrioid carcinomaFemale<65I/IIUnknownUnknownSD
Page: 1 2 

Top

Related drugs of malignant transformation related genes

check buttonIdentification of chemicals and drugs interact with genes involved in malignant transfromation
(DGIdb 4.0)
Entrez IDSymbolCategoryInteraction TypesDrug Claim NameDrug NamePMIDs
Page: 1