
|
|||||
|
 | |
| |
| |
| |
| |
| |
|
Gene: MIEF1 |
Gene summary for MIEF1 |
| Gene information | Species | Human | Gene symbol | MIEF1 | Gene ID | 54471 |
| Gene name | mitochondrial elongation factor 1 | |
| Gene Alias | AltMIEF1 | |
| Cytomap | 22q13.1 | |
| Gene Type | protein-coding | GO ID | GO:0000266 | UniProtAcc | B0QY95 |
Top |
Malignant transformation analysis |
| Identification of the aberrant gene expression in precancerous and cancerous lesions by comparing the gene expression of stem-like cells in diseased tissues with normal stem cells |
| Entrez ID | Symbol | Replicates | Species | Organ | Tissue | Adj P-value | Log2FC | Malignancy |
| 54471 | MIEF1 | HTA11_347_2000001011 | Human | Colorectum | AD | 6.48e-07 | 4.06e-01 | -0.1954 |
| 54471 | MIEF1 | HTA11_7696_3000711011 | Human | Colorectum | AD | 1.86e-02 | 1.75e-01 | 0.0674 |
| 54471 | MIEF1 | HTA11_99999970781_79442 | Human | Colorectum | MSS | 9.64e-06 | 2.82e-01 | 0.294 |
| 54471 | MIEF1 | HTA11_99999971662_82457 | Human | Colorectum | MSS | 7.70e-15 | 5.22e-01 | 0.3859 |
| 54471 | MIEF1 | A002-C-114 | Human | Colorectum | FAP | 7.48e-03 | -1.27e-01 | -0.1561 |
| 54471 | MIEF1 | LZE4T | Human | Esophagus | ESCC | 2.92e-05 | 7.18e-02 | 0.0811 |
| 54471 | MIEF1 | LZE7T | Human | Esophagus | ESCC | 4.33e-03 | 3.87e-02 | 0.0667 |
| 54471 | MIEF1 | LZE8T | Human | Esophagus | ESCC | 2.42e-02 | 4.37e-02 | 0.067 |
| 54471 | MIEF1 | LZE24T | Human | Esophagus | ESCC | 4.42e-11 | 1.39e-01 | 0.0596 |
| 54471 | MIEF1 | P2T-E | Human | Esophagus | ESCC | 6.14e-12 | 1.74e-01 | 0.1177 |
| 54471 | MIEF1 | P4T-E | Human | Esophagus | ESCC | 7.32e-08 | 8.25e-02 | 0.1323 |
| 54471 | MIEF1 | P5T-E | Human | Esophagus | ESCC | 1.19e-06 | 6.49e-02 | 0.1327 |
| 54471 | MIEF1 | P8T-E | Human | Esophagus | ESCC | 9.58e-11 | 9.13e-02 | 0.0889 |
| 54471 | MIEF1 | P9T-E | Human | Esophagus | ESCC | 6.77e-15 | 1.96e-01 | 0.1131 |
| 54471 | MIEF1 | P10T-E | Human | Esophagus | ESCC | 5.82e-17 | 2.91e-01 | 0.116 |
| 54471 | MIEF1 | P11T-E | Human | Esophagus | ESCC | 1.05e-12 | 2.35e-01 | 0.1426 |
| 54471 | MIEF1 | P12T-E | Human | Esophagus | ESCC | 7.04e-12 | 1.49e-01 | 0.1122 |
| 54471 | MIEF1 | P15T-E | Human | Esophagus | ESCC | 8.64e-19 | 3.14e-01 | 0.1149 |
| 54471 | MIEF1 | P16T-E | Human | Esophagus | ESCC | 1.96e-13 | 2.82e-01 | 0.1153 |
| 54471 | MIEF1 | P17T-E | Human | Esophagus | ESCC | 1.68e-05 | 1.99e-01 | 0.1278 |
| Page: 1 2 3 4 5 |
| Tissue | Expression Dynamics | Abbreviation |
| Colorectum (GSE201348) |  | FAP: Familial adenomatous polyposis |
| CRC: Colorectal cancer | ||
| Colorectum (HTA11) |  | AD: Adenomas |
| SER: Sessile serrated lesions | ||
| MSI-H: Microsatellite-high colorectal cancer | ||
| MSS: Microsatellite stable colorectal cancer | ||
| Esophagus |  | ESCC: Esophageal squamous cell carcinoma |
| HGIN: High-grade intraepithelial neoplasias | ||
| LGIN: Low-grade intraepithelial neoplasias | ||
| Liver | 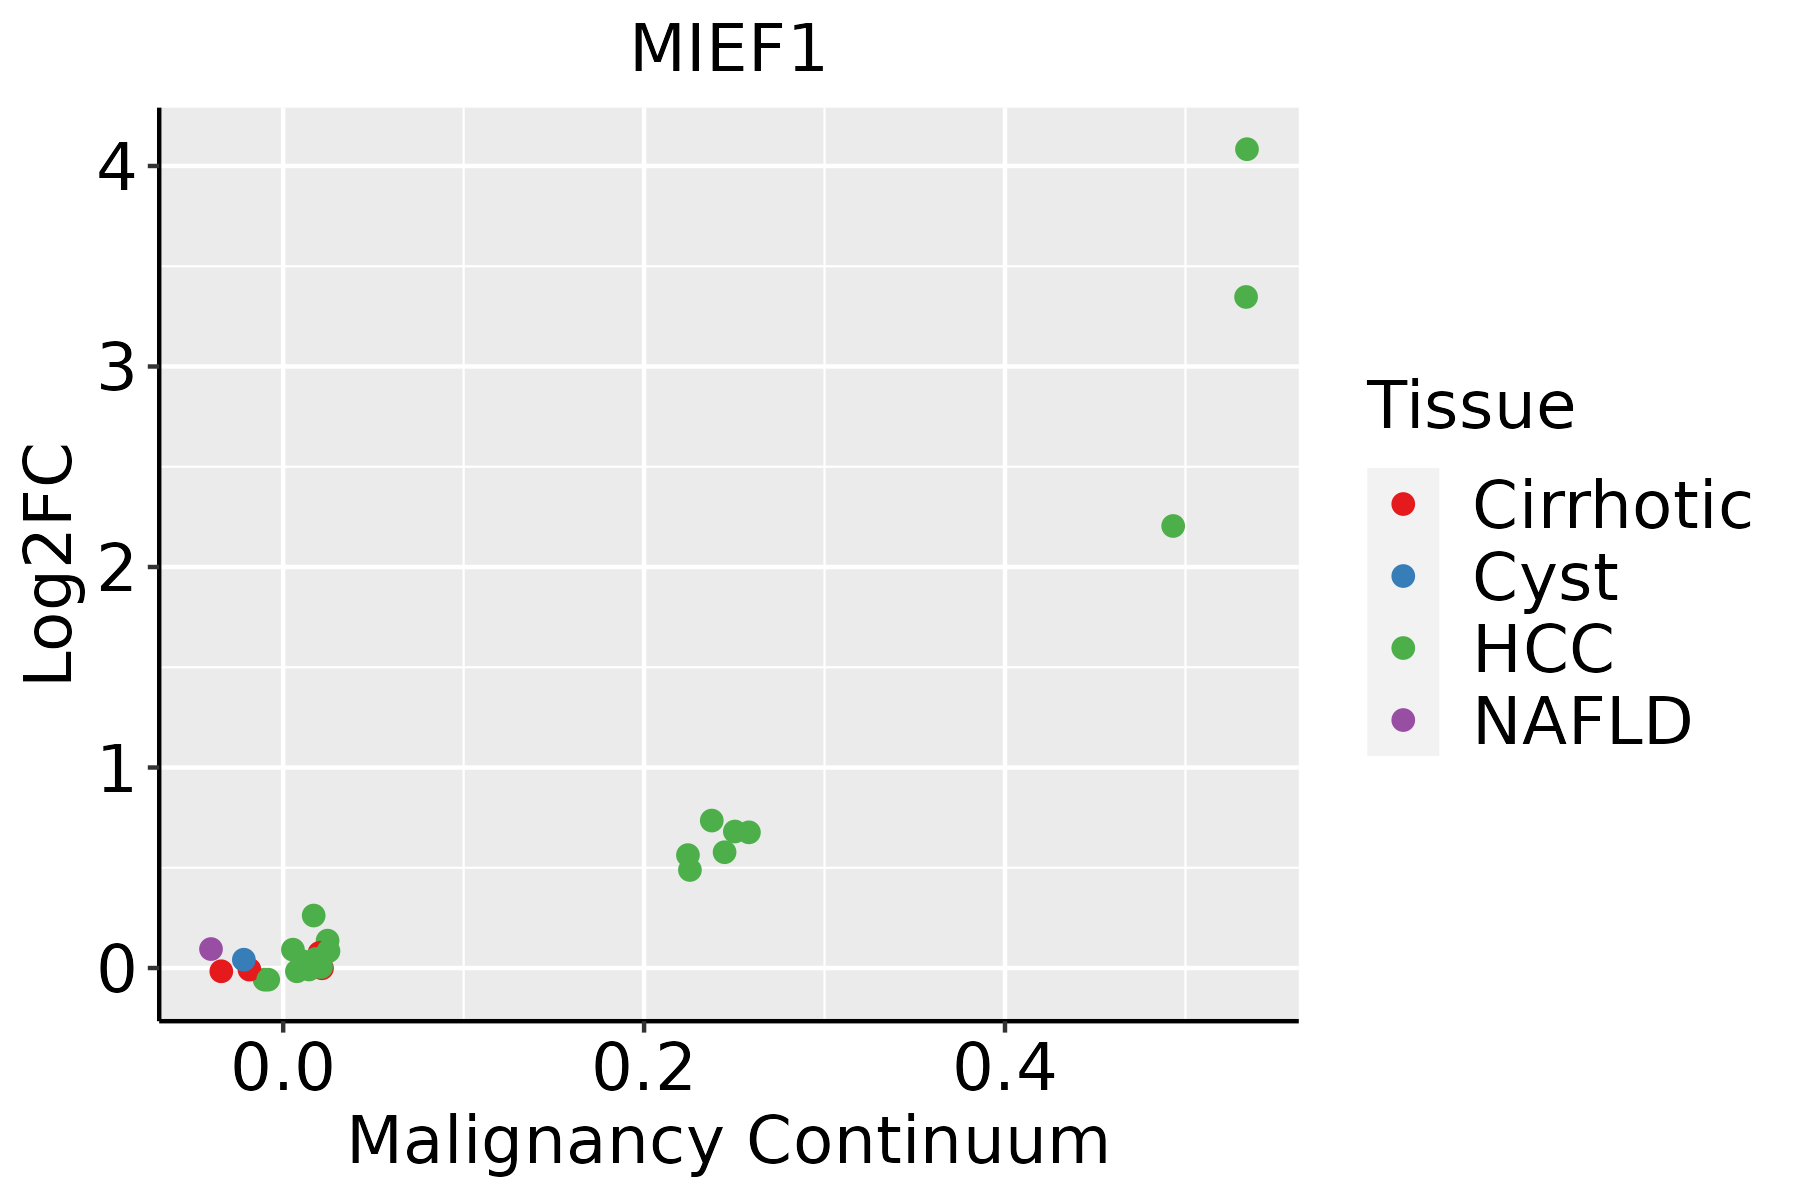 | HCC: Hepatocellular carcinoma |
| NAFLD: Non-alcoholic fatty liver disease | ||
| Oral Cavity |  | EOLP: Erosive Oral lichen planus |
| LP: leukoplakia | ||
| NEOLP: Non-erosive oral lichen planus | ||
| OSCC: Oral squamous cell carcinoma |
| ∗log2FC in expression of this searched gene in stem-like cells from each diseased tissue sample relative to stem-like cells in normal samples in each tissue plotted against the malignancy continuum. Samples are colored based on if they are from different disease stage. |
Top |
Malignant transformation related pathway analysis |
| Find out the enriched GO biological processes and KEGG pathways involved in transition from healthy to precancer to cancer |
| Tissue | Disease Stage | Enriched GO biological Processes |
| Colorectum | AD |  |
| Colorectum | SER |  |
| Colorectum | MSS |  |
| Colorectum | MSI-H |  |
| Colorectum | FAP |  |
| ∗Top 15 enriched GO BP terms are showed in the bar plot of each disease state in each tissue. Each row represents a significant GO biological process which is colored according to the -log10(p.adjust). |
| Page: 1 2 3 4 5 6 7 8 9 |
| GO ID | Tissue | Disease Stage | Description | Gene Ratio | Bg Ratio | pvalue | p.adjust | Count |
| GO:1903829 | Colorectum | AD | positive regulation of cellular protein localization | 110/3918 | 276/18723 | 4.58e-13 | 8.44e-11 | 110 |
| GO:0090150 | Colorectum | AD | establishment of protein localization to membrane | 100/3918 | 260/18723 | 6.01e-11 | 6.33e-09 | 100 |
| GO:1905475 | Colorectum | AD | regulation of protein localization to membrane | 73/3918 | 175/18723 | 3.37e-10 | 2.93e-08 | 73 |
| GO:1904951 | Colorectum | AD | positive regulation of establishment of protein localization | 112/3918 | 319/18723 | 2.55e-09 | 1.80e-07 | 112 |
| GO:0051222 | Colorectum | AD | positive regulation of protein transport | 106/3918 | 303/18723 | 8.45e-09 | 5.08e-07 | 106 |
| GO:0006605 | Colorectum | AD | protein targeting | 105/3918 | 314/18723 | 1.39e-07 | 6.44e-06 | 105 |
| GO:1905477 | Colorectum | AD | positive regulation of protein localization to membrane | 46/3918 | 106/18723 | 1.47e-07 | 6.64e-06 | 46 |
| GO:0090316 | Colorectum | AD | positive regulation of intracellular protein transport | 62/3918 | 160/18723 | 1.82e-07 | 7.79e-06 | 62 |
| GO:0032388 | Colorectum | AD | positive regulation of intracellular transport | 74/3918 | 202/18723 | 1.83e-07 | 7.80e-06 | 74 |
| GO:0010821 | Colorectum | AD | regulation of mitochondrion organization | 57/3918 | 144/18723 | 2.43e-07 | 9.92e-06 | 57 |
| GO:0032386 | Colorectum | AD | regulation of intracellular transport | 109/3918 | 337/18723 | 5.33e-07 | 1.95e-05 | 109 |
| GO:0033157 | Colorectum | AD | regulation of intracellular protein transport | 80/3918 | 229/18723 | 5.81e-07 | 2.09e-05 | 80 |
| GO:0010822 | Colorectum | AD | positive regulation of mitochondrion organization | 32/3918 | 74/18723 | 1.22e-05 | 2.68e-04 | 32 |
| GO:1903533 | Colorectum | AD | regulation of protein targeting | 31/3918 | 81/18723 | 2.61e-04 | 3.25e-03 | 31 |
| GO:0070482 | Colorectum | AD | response to oxygen levels | 99/3918 | 347/18723 | 4.29e-04 | 4.82e-03 | 99 |
| GO:0071453 | Colorectum | AD | cellular response to oxygen levels | 55/3918 | 177/18723 | 9.48e-04 | 8.96e-03 | 55 |
| GO:0001666 | Colorectum | AD | response to hypoxia | 86/3918 | 307/18723 | 1.77e-03 | 1.46e-02 | 86 |
| GO:0036293 | Colorectum | AD | response to decreased oxygen levels | 88/3918 | 322/18723 | 3.42e-03 | 2.49e-02 | 88 |
| GO:19038292 | Colorectum | MSS | positive regulation of cellular protein localization | 103/3467 | 276/18723 | 1.12e-13 | 2.67e-11 | 103 |
| GO:19049512 | Colorectum | MSS | positive regulation of establishment of protein localization | 110/3467 | 319/18723 | 6.30e-12 | 9.83e-10 | 110 |
| Page: 1 2 3 4 5 6 7 |
| Pathway ID | Tissue | Disease Stage | Description | Gene Ratio | Bg Ratio | pvalue | p.adjust | qvalue | Count |
| Page: 1 |
Top |
Cell-cell communication analysis |
| Identification of potential cell-cell interactions between two cell types and their ligand-receptor pairs for different disease states |
| Ligand | Receptor | LRpair | Pathway | Tissue | Disease Stage |
| Page: 1 |
Top |
Single-cell gene regulatory network inference analysis |
| Find out the significant the regulons (TFs) and the target genes of each regulon across cell types for different disease states |
| TF | Cell Type | Tissue | Disease Stage | Target Gene | RSS | Regulon Activity |
| MIEF1 | SMC | Pancreas | ADJ | SHROOM3,AC096677.1,ALB, etc. | 3.72e-02 |  |
| MIEF1 | PERI | Pancreas | ADJ | SHROOM3,AC096677.1,ALB, etc. | 2.90e-01 | |
| MIEF1 | SMC | Pancreas | Healthy | SHROOM3,AC096677.1,ALB, etc. | 5.90e-01 |  |
| ∗The dot plots of a searched regulon are shown for all cell subpopulations in each disease state of each tissue based on the regulon specific score inferred using pySCENIC and by calculating the average expression. |
| Page: 1 |
Top |
Somatic mutation of malignant transformation related genes |
| Annotation of somatic variants for genes involved in malignant transformation |
| Hugo Symbol | Variant Class | Variant Classification | dbSNP RS | HGVSc | HGVSp | HGVSp Short | SWISSPROT | BIOTYPE | SIFT | PolyPhen | Tumor Sample Barcode | Tissue | Histology | Sex | Age | Stage | Therapy Types | Drugs | Outcome |
| MIEF1 | SNV | Missense_Mutation | c.1109T>C | p.Ile370Thr | p.I370T | protein_coding | tolerated(0.07) | benign(0.158) | TCGA-A2-A0D0-01 | Breast | breast invasive carcinoma | Female | <65 | I/II | Chemotherapy | cytoxan | SD | ||
| MIEF1 | SNV | Missense_Mutation | novel | c.1162N>C | p.Val388Leu | p.V388L | protein_coding | tolerated(0.11) | benign(0.049) | TCGA-AC-A3W5-01 | Breast | breast invasive carcinoma | Female | >=65 | I/II | Chemotherapy | docetaxel | CR | |
| MIEF1 | SNV | Missense_Mutation | rs746975740 | c.1079G>A | p.Arg360Gln | p.R360Q | protein_coding | deleterious(0) | probably_damaging(0.998) | TCGA-AN-A046-01 | Breast | breast invasive carcinoma | Female | >=65 | I/II | Unknown | Unknown | SD | |
| MIEF1 | SNV | Missense_Mutation | novel | c.1049N>A | p.Arg350Gln | p.R350Q | protein_coding | tolerated(0.24) | possibly_damaging(0.552) | TCGA-2W-A8YY-01 | Cervix | cervical & endocervical cancer | Female | <65 | I/II | Chemotherapy | cisplatin | CR | |
| MIEF1 | SNV | Missense_Mutation | rs775912326 | c.1236G>C | p.Leu412Phe | p.L412F | protein_coding | deleterious(0) | probably_damaging(0.999) | TCGA-EK-A2IP-01 | Cervix | cervical & endocervical cancer | Female | <65 | I/II | Unknown | Unknown | SD | |
| MIEF1 | SNV | Missense_Mutation | c.1248C>G | p.Ile416Met | p.I416M | protein_coding | deleterious(0) | possibly_damaging(0.876) | TCGA-EK-A2PL-01 | Cervix | cervical & endocervical cancer | Female | <65 | III/IV | Unknown | Unknown | SD | ||
| MIEF1 | SNV | Missense_Mutation | c.418N>G | p.Leu140Val | p.L140V | protein_coding | deleterious(0.04) | benign(0.079) | TCGA-EK-A2RC-01 | Cervix | cervical & endocervical cancer | Female | <65 | I/II | Unknown | Unknown | SD | ||
| MIEF1 | SNV | Missense_Mutation | novel | c.128N>T | p.Thr43Met | p.T43M | protein_coding | deleterious(0) | probably_damaging(0.997) | TCGA-VS-A8QA-01 | Cervix | cervical & endocervical cancer | Female | <65 | I/II | Unknown | Unknown | SD | |
| MIEF1 | SNV | Missense_Mutation | c.506N>A | p.Arg169Gln | p.R169Q | protein_coding | tolerated(1) | possibly_damaging(0.704) | TCGA-AZ-4315-01 | Colorectum | colon adenocarcinoma | Male | <65 | I/II | Unknown | Unknown | SD | ||
| MIEF1 | SNV | Missense_Mutation | novel | c.1307N>C | p.Lys436Thr | p.K436T | protein_coding | tolerated(0.61) | benign(0.021) | TCGA-G4-6588-01 | Colorectum | colon adenocarcinoma | Female | <65 | I/II | Unknown | Unknown | SD |
| Page: 1 2 3 4 5 6 |
Top |
Related drugs of malignant transformation related genes |
| Identification of chemicals and drugs interact with genes involved in malignant transfromation |
| (DGIdb 4.0) |
| Entrez ID | Symbol | Category | Interaction Types | Drug Claim Name | Drug Name | PMIDs |
| Page: 1 |

Copyright 2023-Present -The University of Texas Health Science Center at Houston |