
|
|||||
|
 | |
| |
| |
| |
| |
| |
|
Gene: MIDN |
Gene summary for MIDN |
| Gene information | Species | Human | Gene symbol | MIDN | Gene ID | 90007 |
| Gene name | midnolin | |
| Gene Alias | Stx | |
| Cytomap | 19p13.3 | |
| Gene Type | protein-coding | GO ID | GO:0002790 | UniProtAcc | Q504T8 |
Top |
Malignant transformation analysis |
| Identification of the aberrant gene expression in precancerous and cancerous lesions by comparing the gene expression of stem-like cells in diseased tissues with normal stem cells |
| Entrez ID | Symbol | Replicates | Species | Organ | Tissue | Adj P-value | Log2FC | Malignancy |
| 90007 | MIDN | HTA11_2487_2000001011 | Human | Colorectum | SER | 1.85e-19 | 1.02e+00 | -0.1808 |
| 90007 | MIDN | HTA11_1938_2000001011 | Human | Colorectum | AD | 1.73e-08 | 4.50e-01 | -0.0811 |
| 90007 | MIDN | HTA11_78_2000001011 | Human | Colorectum | AD | 2.05e-02 | 1.77e-01 | -0.1088 |
| 90007 | MIDN | HTA11_347_2000001011 | Human | Colorectum | AD | 1.92e-18 | 4.83e-01 | -0.1954 |
| 90007 | MIDN | HTA11_411_2000001011 | Human | Colorectum | SER | 4.06e-04 | 9.65e-01 | -0.2602 |
| 90007 | MIDN | HTA11_2112_2000001011 | Human | Colorectum | SER | 1.67e-08 | 1.06e+00 | -0.2196 |
| 90007 | MIDN | HTA11_3361_2000001011 | Human | Colorectum | AD | 1.24e-03 | 5.05e-01 | -0.1207 |
| 90007 | MIDN | HTA11_83_2000001011 | Human | Colorectum | SER | 1.86e-03 | 4.34e-01 | -0.1526 |
| 90007 | MIDN | HTA11_696_2000001011 | Human | Colorectum | AD | 1.27e-13 | 6.65e-01 | -0.1464 |
| 90007 | MIDN | HTA11_1391_2000001011 | Human | Colorectum | AD | 1.64e-10 | 5.27e-01 | -0.059 |
| 90007 | MIDN | HTA11_5212_2000001011 | Human | Colorectum | AD | 5.30e-03 | 5.03e-01 | -0.2061 |
| 90007 | MIDN | HTA11_866_3004761011 | Human | Colorectum | AD | 5.91e-03 | 2.01e-01 | 0.096 |
| 90007 | MIDN | HTA11_10623_2000001011 | Human | Colorectum | AD | 1.91e-03 | 3.74e-01 | -0.0177 |
| 90007 | MIDN | HTA11_7696_3000711011 | Human | Colorectum | AD | 6.85e-06 | 3.22e-01 | 0.0674 |
| 90007 | MIDN | HTA11_99999970781_79442 | Human | Colorectum | MSS | 5.90e-05 | 3.54e-01 | 0.294 |
| 90007 | MIDN | HTA11_99999965104_69814 | Human | Colorectum | MSS | 2.79e-02 | 1.85e-01 | 0.281 |
| 90007 | MIDN | HTA11_99999971662_82457 | Human | Colorectum | MSS | 1.55e-06 | 4.97e-01 | 0.3859 |
| 90007 | MIDN | HTA11_99999973899_84307 | Human | Colorectum | MSS | 2.56e-08 | 7.51e-01 | 0.2585 |
| 90007 | MIDN | HTA11_99999974143_84620 | Human | Colorectum | MSS | 2.26e-08 | 4.13e-01 | 0.3005 |
| 90007 | MIDN | A015-C-203 | Human | Colorectum | FAP | 4.78e-03 | -1.03e-01 | -0.1294 |
| Page: 1 2 3 4 5 6 7 8 9 10 11 |
| Tissue | Expression Dynamics | Abbreviation |
| Colorectum (GSE201348) |  | FAP: Familial adenomatous polyposis |
| CRC: Colorectal cancer | ||
| Colorectum (HTA11) |  | AD: Adenomas |
| SER: Sessile serrated lesions | ||
| MSI-H: Microsatellite-high colorectal cancer | ||
| MSS: Microsatellite stable colorectal cancer | ||
| Endometrium | 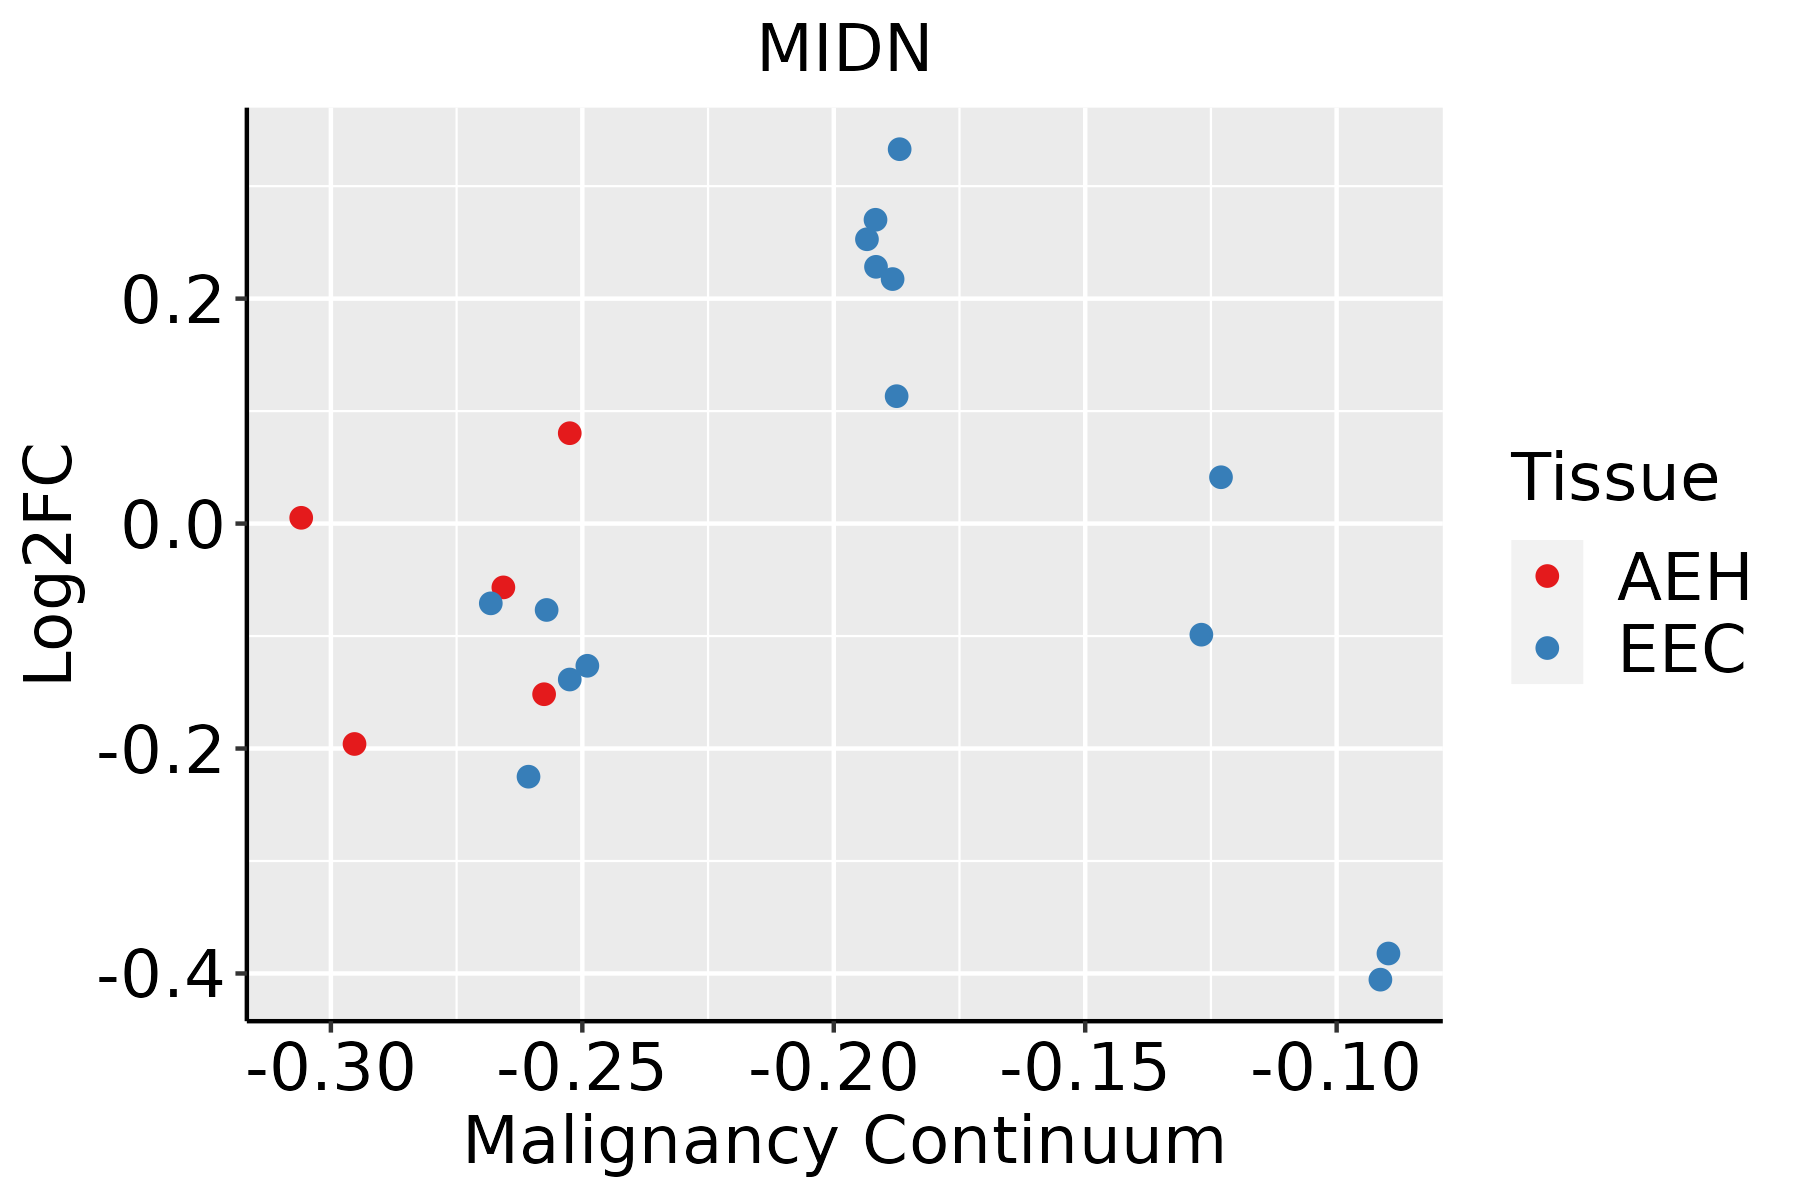 | AEH: Atypical endometrial hyperplasia |
| EEC: Endometrioid Cancer | ||
| Esophagus |  | ESCC: Esophageal squamous cell carcinoma |
| HGIN: High-grade intraepithelial neoplasias | ||
| LGIN: Low-grade intraepithelial neoplasias | ||
| GC | 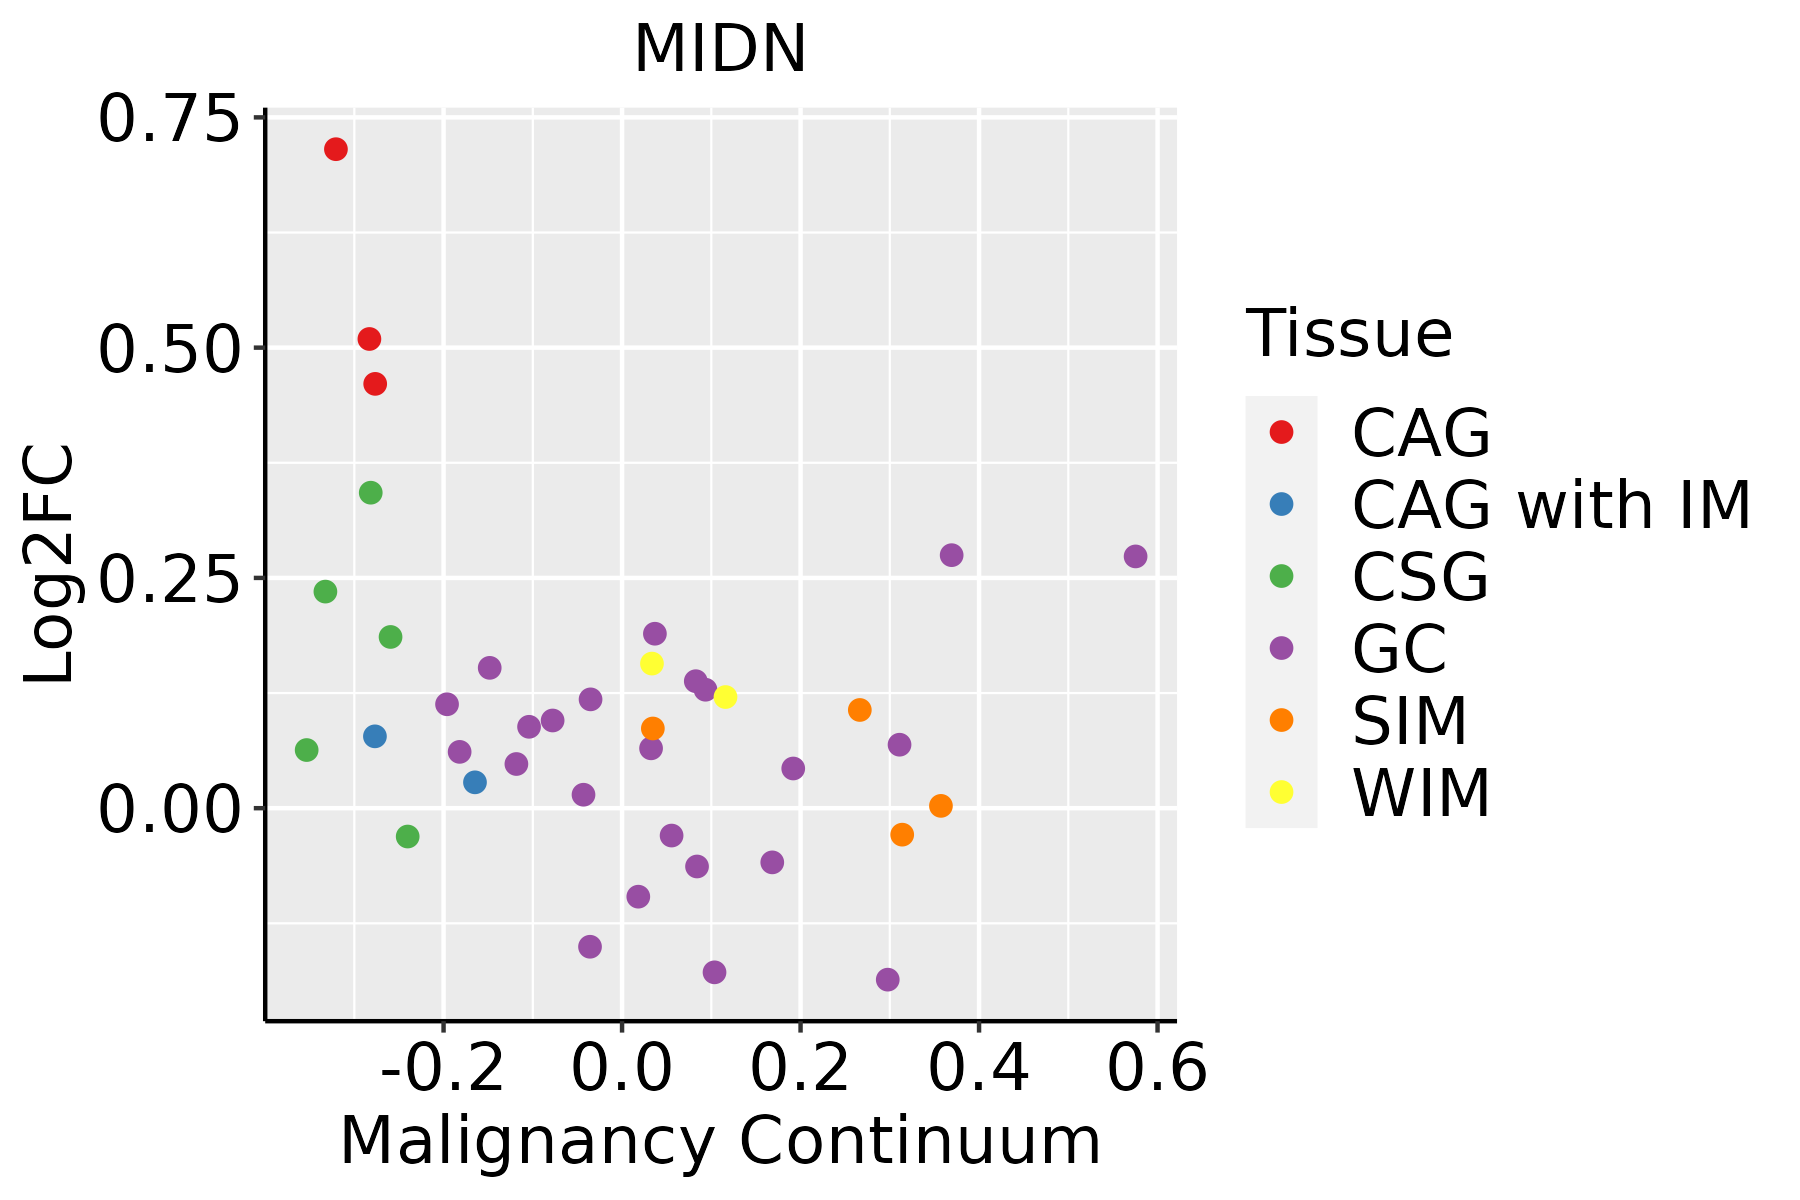 | CAG: Chronic atrophic gastritis |
| CAG with IM: Chronic atrophic gastritis with intestinal metaplasia | ||
| CSG: Chronic superficial gastritis | ||
| GC: Gastric cancer | ||
| SIM: Severe intestinal metaplasia | ||
| WIM: Wild intestinal metaplasia | ||
| Liver |  | HCC: Hepatocellular carcinoma |
| NAFLD: Non-alcoholic fatty liver disease | ||
| Lung | 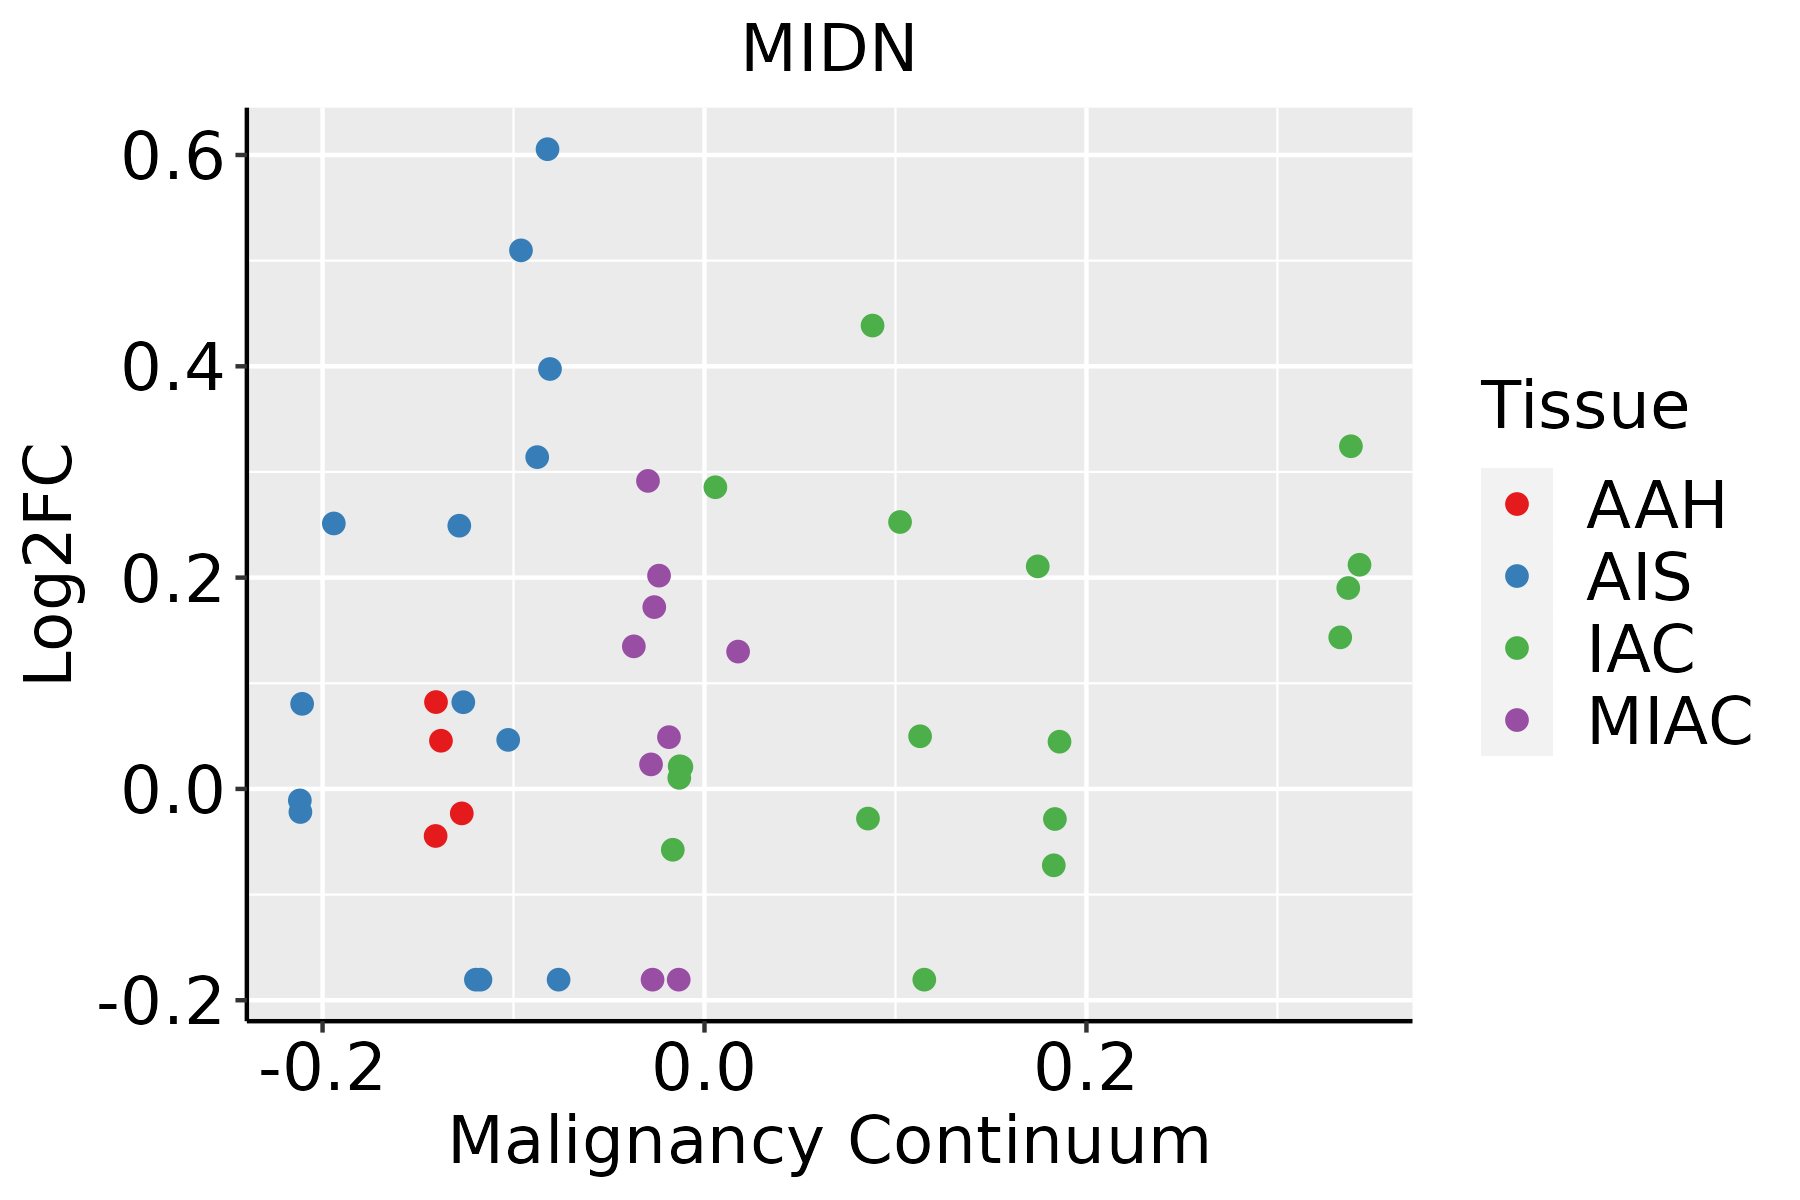 | AAH: Atypical adenomatous hyperplasia |
| AIS: Adenocarcinoma in situ | ||
| IAC: Invasive lung adenocarcinoma | ||
| MIA: Minimally invasive adenocarcinoma | ||
| Oral Cavity | 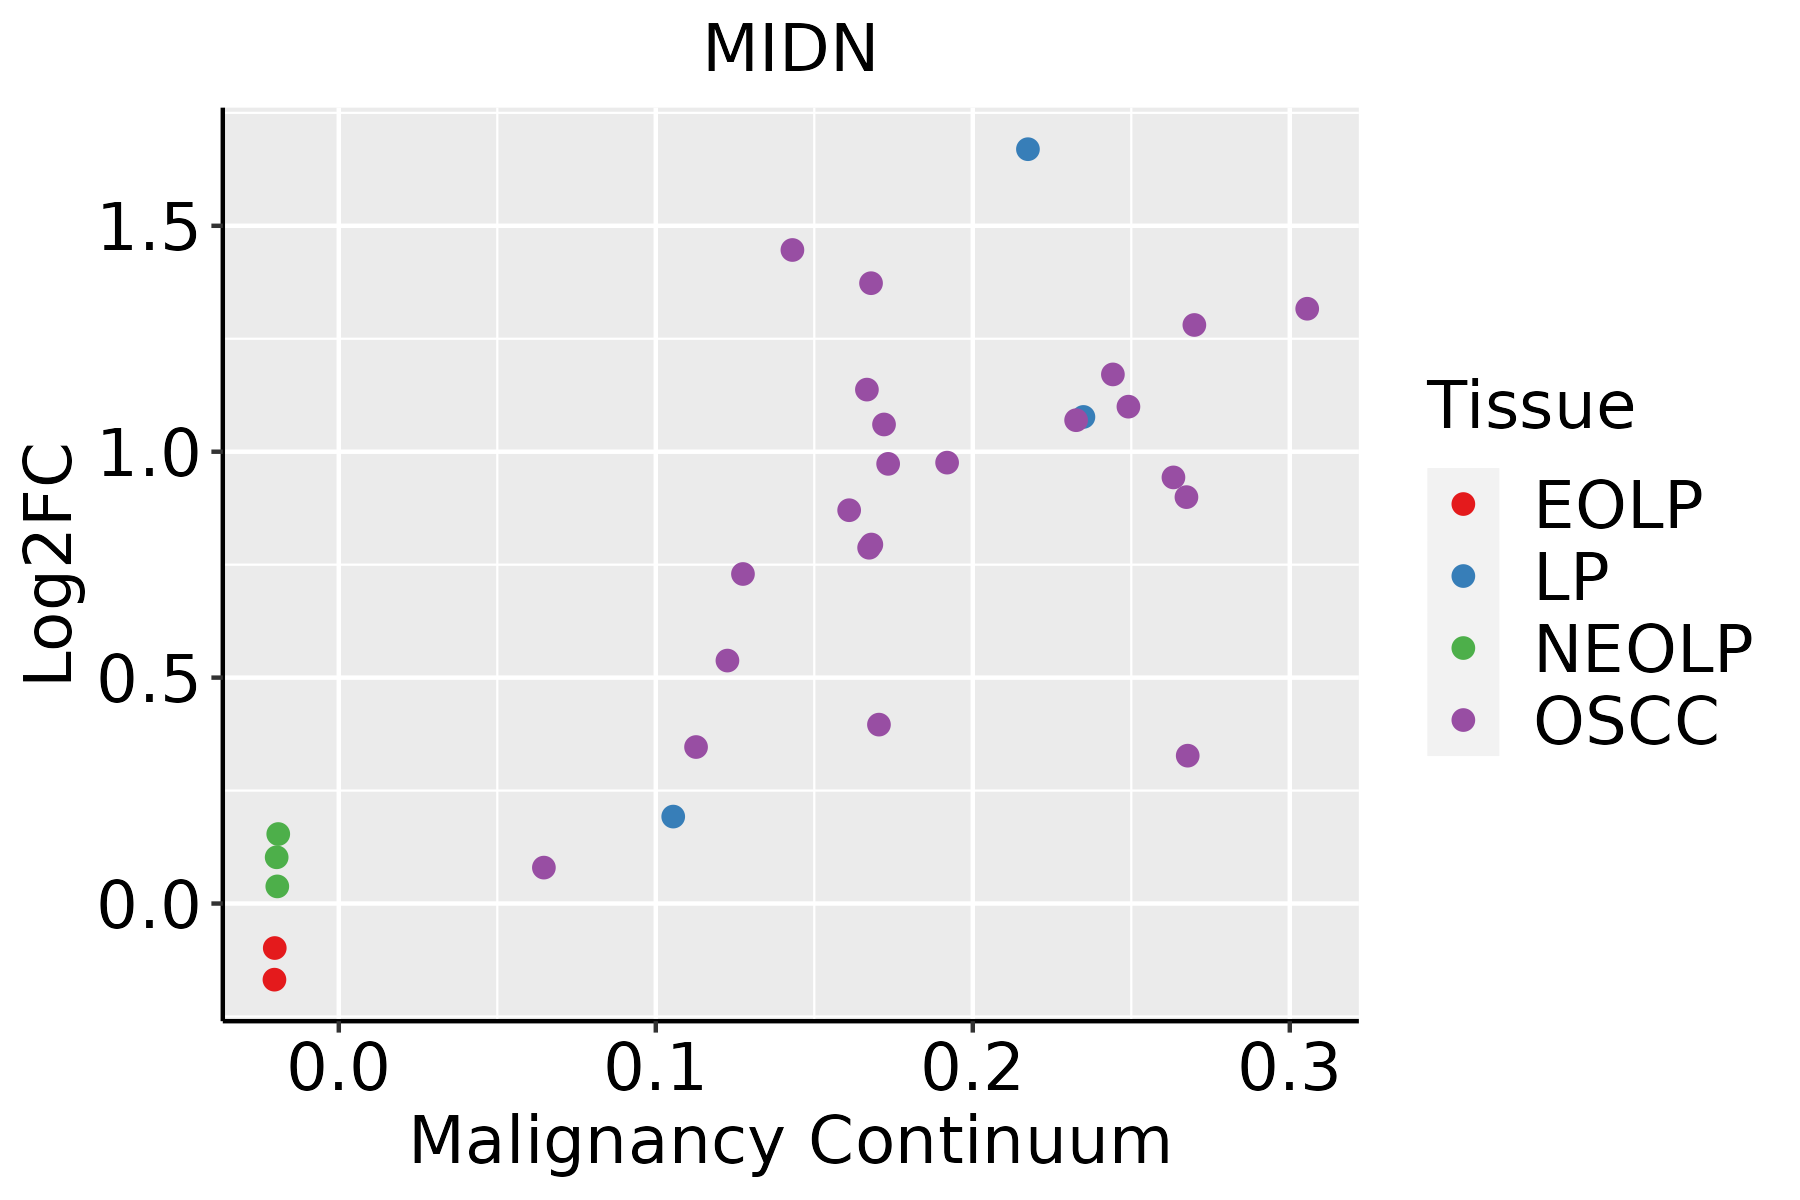 | EOLP: Erosive Oral lichen planus |
| LP: leukoplakia | ||
| NEOLP: Non-erosive oral lichen planus | ||
| OSCC: Oral squamous cell carcinoma | ||
| Prostate | 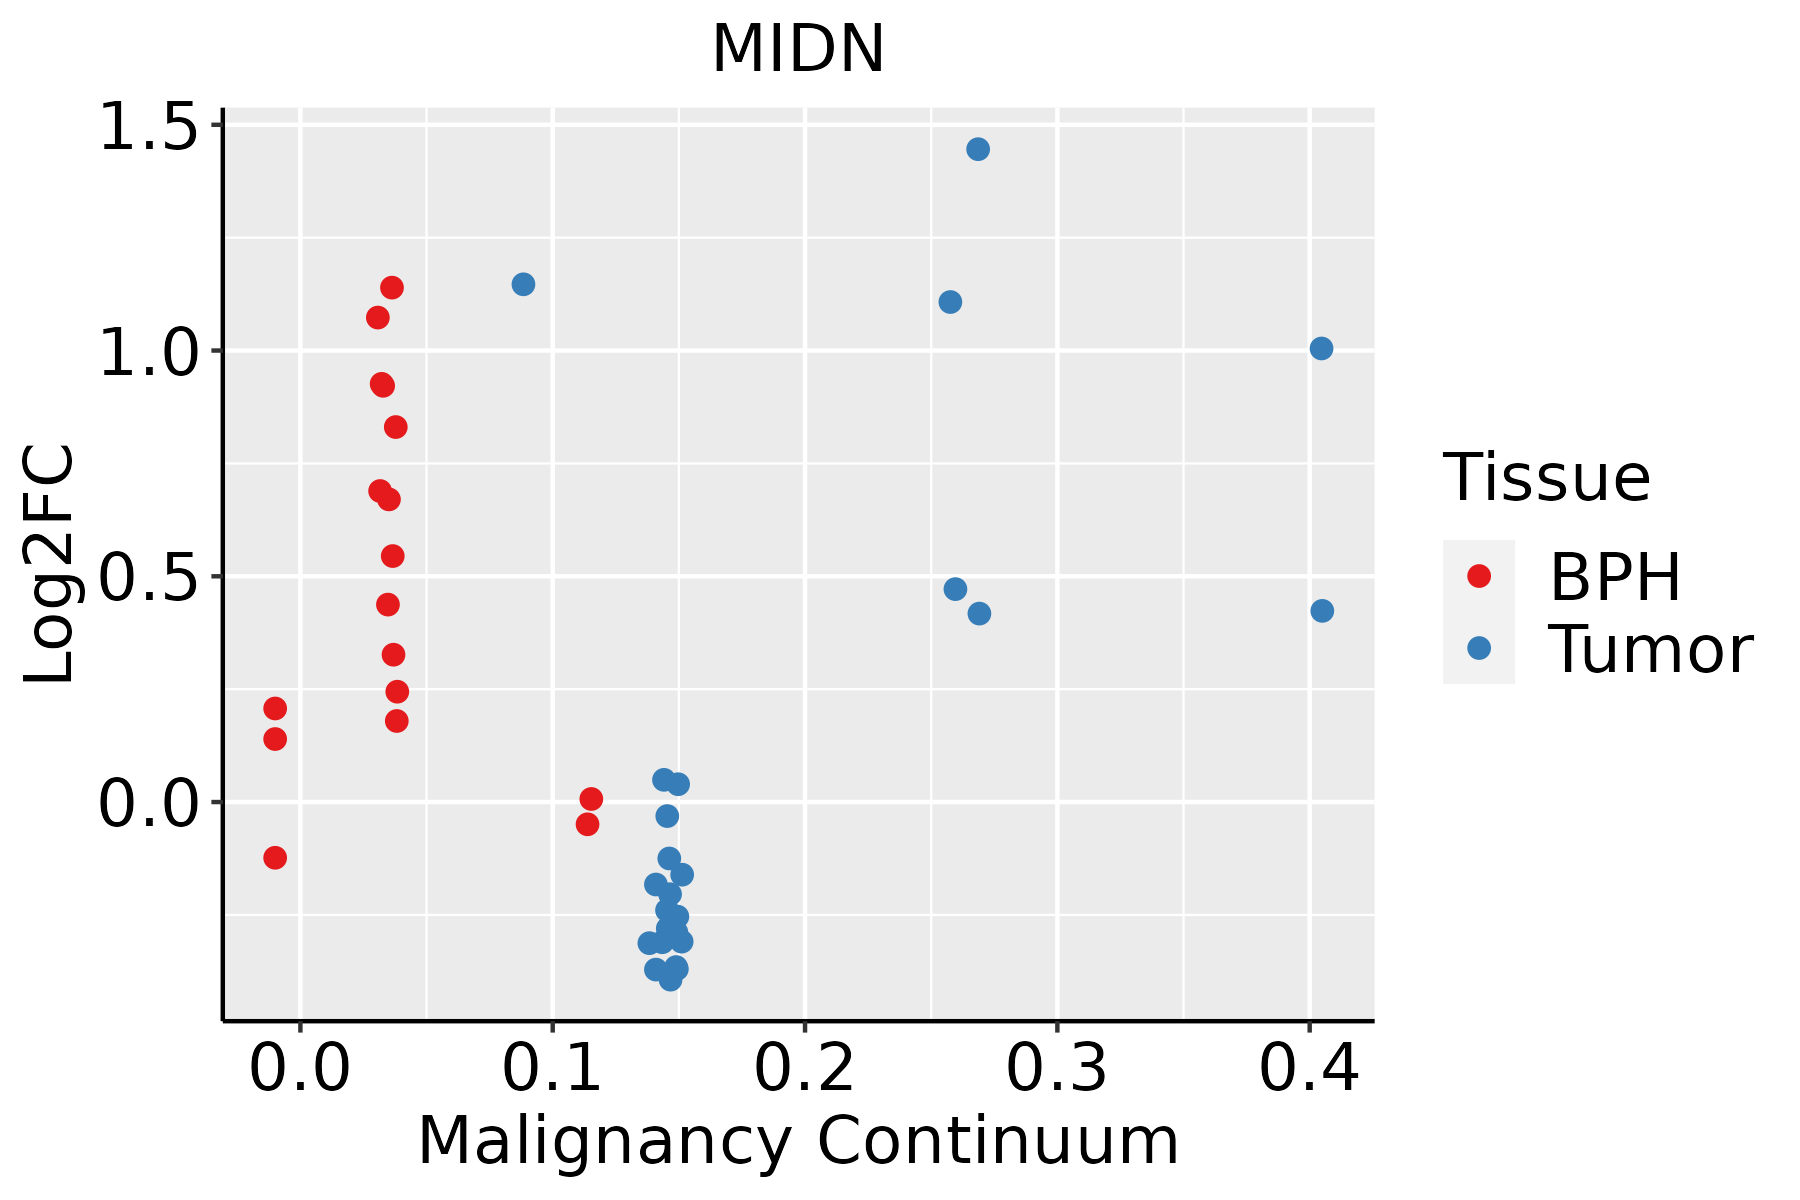 | BPH: Benign Prostatic Hyperplasia |
| Skin |  | AK: Actinic keratosis |
| cSCC: Cutaneous squamous cell carcinoma | ||
| SCCIS:squamous cell carcinoma in situ | ||
| Thyroid | 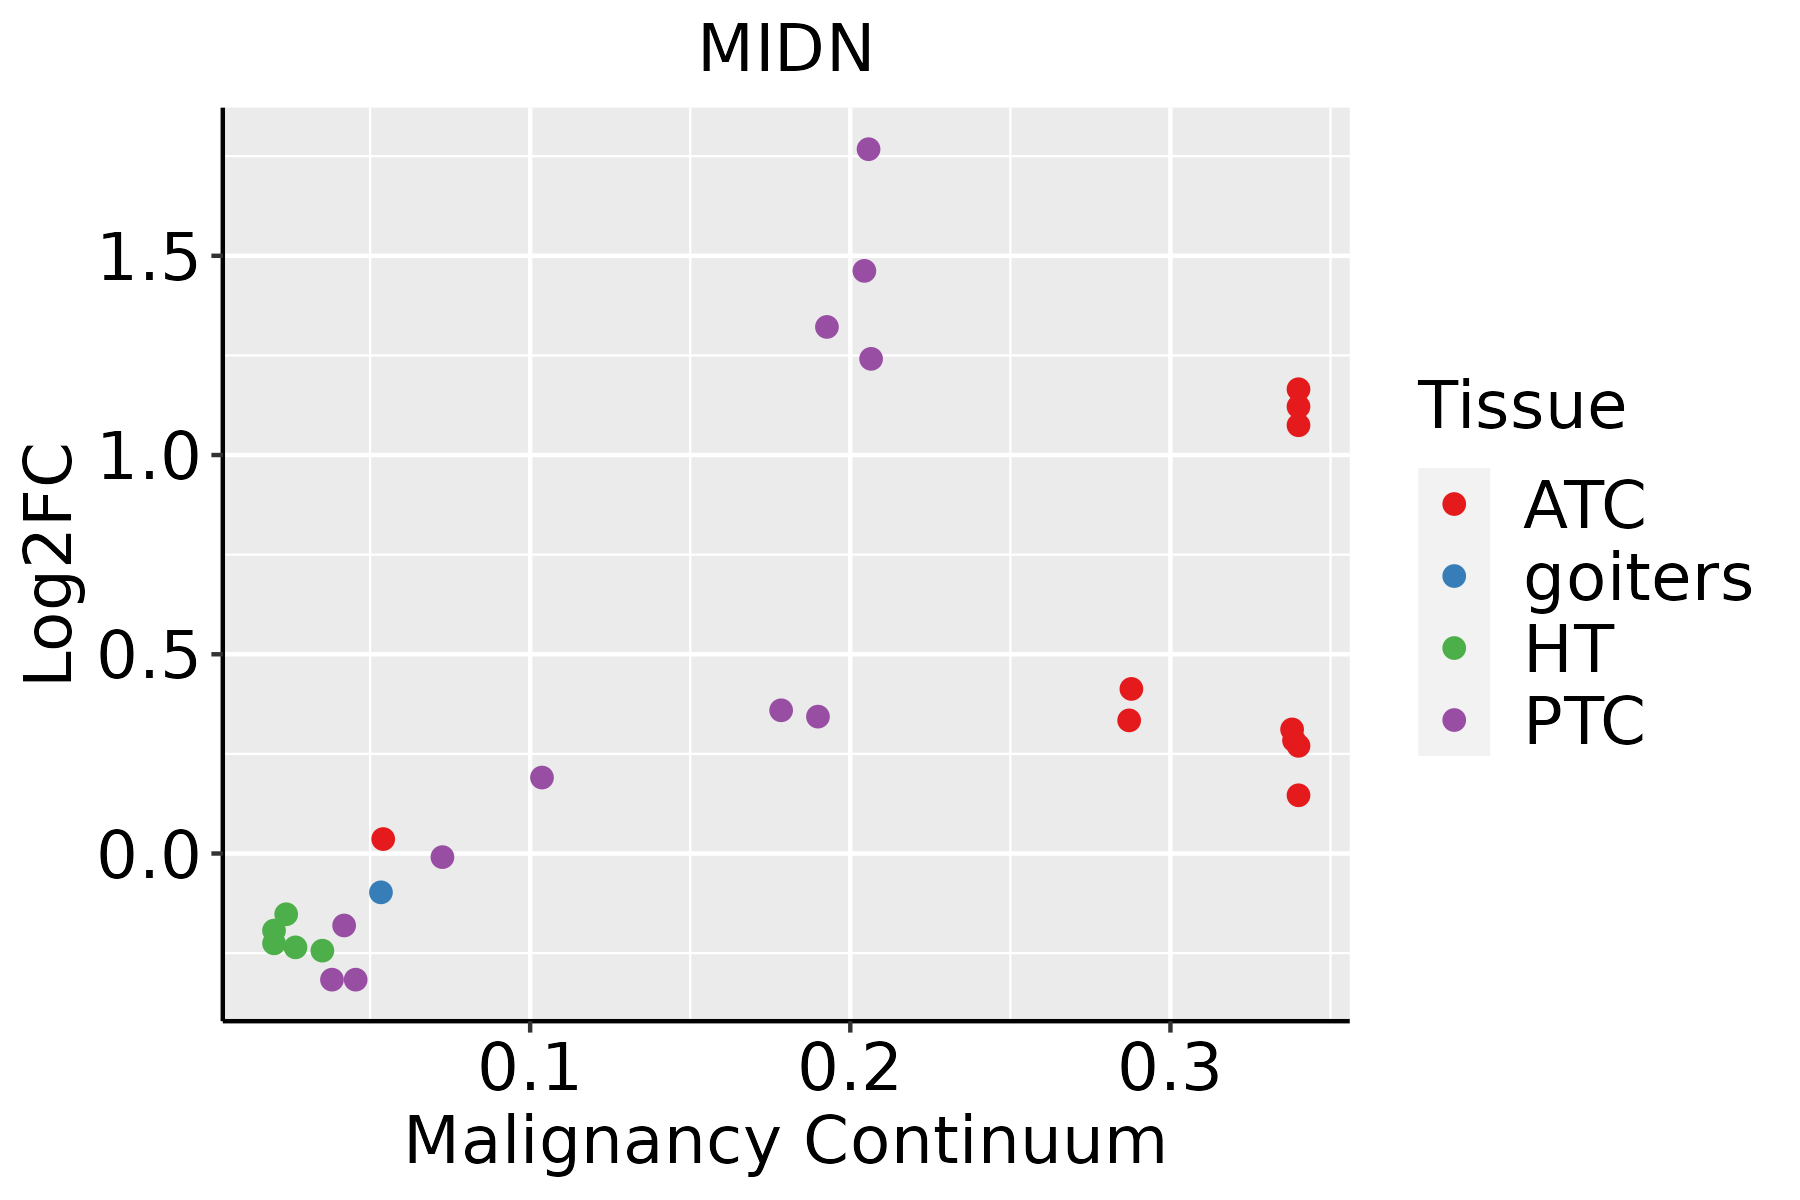 | ATC: Anaplastic thyroid cancer |
| HT: Hashimoto's thyroiditis | ||
| PTC: Papillary thyroid cancer |
| ∗log2FC in expression of this searched gene in stem-like cells from each diseased tissue sample relative to stem-like cells in normal samples in each tissue plotted against the malignancy continuum. Samples are colored based on if they are from different disease stage. |
Top |
Malignant transformation related pathway analysis |
| Find out the enriched GO biological processes and KEGG pathways involved in transition from healthy to precancer to cancer |
| Tissue | Disease Stage | Enriched GO biological Processes |
| Colorectum | AD |  |
| Colorectum | SER |  |
| Colorectum | MSS |  |
| Colorectum | MSI-H |  |
| Colorectum | FAP |  |
| ∗Top 15 enriched GO BP terms are showed in the bar plot of each disease state in each tissue. Each row represents a significant GO biological process which is colored according to the -log10(p.adjust). |
| Page: 1 2 3 4 5 6 7 8 9 |
| GO ID | Tissue | Disease Stage | Description | Gene Ratio | Bg Ratio | pvalue | p.adjust | Count |
| GO:0010563 | Colorectum | AD | negative regulation of phosphorus metabolic process | 130/3918 | 442/18723 | 1.26e-05 | 2.76e-04 | 130 |
| GO:0045936 | Colorectum | AD | negative regulation of phosphate metabolic process | 129/3918 | 441/18723 | 1.81e-05 | 3.76e-04 | 129 |
| GO:0019318 | Colorectum | AD | hexose metabolic process | 77/3918 | 237/18723 | 1.96e-05 | 4.01e-04 | 77 |
| GO:0051348 | Colorectum | AD | negative regulation of transferase activity | 85/3918 | 268/18723 | 2.07e-05 | 4.19e-04 | 85 |
| GO:0044262 | Colorectum | AD | cellular carbohydrate metabolic process | 87/3918 | 283/18723 | 6.00e-05 | 1.01e-03 | 87 |
| GO:0050708 | Colorectum | AD | regulation of protein secretion | 83/3918 | 268/18723 | 6.59e-05 | 1.07e-03 | 83 |
| GO:0005996 | Colorectum | AD | monosaccharide metabolic process | 80/3918 | 257/18723 | 7.31e-05 | 1.17e-03 | 80 |
| GO:0042326 | Colorectum | AD | negative regulation of phosphorylation | 112/3918 | 385/18723 | 8.02e-05 | 1.27e-03 | 112 |
| GO:0009306 | Colorectum | AD | protein secretion | 105/3918 | 359/18723 | 1.05e-04 | 1.57e-03 | 105 |
| GO:0035592 | Colorectum | AD | establishment of protein localization to extracellular region | 105/3918 | 360/18723 | 1.18e-04 | 1.73e-03 | 105 |
| GO:0071692 | Colorectum | AD | protein localization to extracellular region | 106/3918 | 368/18723 | 1.86e-04 | 2.49e-03 | 106 |
| GO:0050796 | Colorectum | AD | regulation of insulin secretion | 54/3918 | 165/18723 | 2.60e-04 | 3.25e-03 | 54 |
| GO:0006006 | Colorectum | AD | glucose metabolic process | 62/3918 | 196/18723 | 2.76e-04 | 3.39e-03 | 62 |
| GO:0030073 | Colorectum | AD | insulin secretion | 61/3918 | 195/18723 | 4.28e-04 | 4.81e-03 | 61 |
| GO:0033673 | Colorectum | AD | negative regulation of kinase activity | 71/3918 | 237/18723 | 6.18e-04 | 6.47e-03 | 71 |
| GO:0015833 | Colorectum | AD | peptide transport | 77/3918 | 264/18723 | 8.90e-04 | 8.60e-03 | 77 |
| GO:0006109 | Colorectum | AD | regulation of carbohydrate metabolic process | 55/3918 | 178/18723 | 1.10e-03 | 1.01e-02 | 55 |
| GO:0062012 | Colorectum | AD | regulation of small molecule metabolic process | 93/3918 | 334/18723 | 1.46e-03 | 1.24e-02 | 93 |
| GO:0090087 | Colorectum | AD | regulation of peptide transport | 60/3918 | 202/18723 | 1.94e-03 | 1.58e-02 | 60 |
| GO:0030072 | Colorectum | AD | peptide hormone secretion | 68/3918 | 236/18723 | 2.39e-03 | 1.85e-02 | 68 |
| Page: 1 2 3 4 5 6 7 8 9 10 11 12 13 14 15 16 17 18 19 |
| Pathway ID | Tissue | Disease Stage | Description | Gene Ratio | Bg Ratio | pvalue | p.adjust | qvalue | Count |
| Page: 1 |
Top |
Cell-cell communication analysis |
| Identification of potential cell-cell interactions between two cell types and their ligand-receptor pairs for different disease states |
| Ligand | Receptor | LRpair | Pathway | Tissue | Disease Stage |
| Page: 1 |
Top |
Single-cell gene regulatory network inference analysis |
| Find out the significant the regulons (TFs) and the target genes of each regulon across cell types for different disease states |
| TF | Cell Type | Tissue | Disease Stage | Target Gene | RSS | Regulon Activity |
| ∗The dot plots of a searched regulon are shown for all cell subpopulations in each disease state of each tissue based on the regulon specific score inferred using pySCENIC and by calculating the average expression. |
| Page: 1 |
Top |
Somatic mutation of malignant transformation related genes |
| Annotation of somatic variants for genes involved in malignant transformation |
| Hugo Symbol | Variant Class | Variant Classification | dbSNP RS | HGVSc | HGVSp | HGVSp Short | SWISSPROT | BIOTYPE | SIFT | PolyPhen | Tumor Sample Barcode | Tissue | Histology | Sex | Age | Stage | Therapy Types | Drugs | Outcome |
| MIDN | SNV | Missense_Mutation | novel | c.587N>T | p.Ser196Phe | p.S196F | Q504T8 | protein_coding | deleterious(0.01) | benign(0) | TCGA-AR-A2LN-01 | Breast | breast invasive carcinoma | Female | >=65 | I/II | Hormone Therapy | letrozole | SD |
| MIDN | SNV | Missense_Mutation | c.878N>T | p.Gln293Leu | p.Q293L | Q504T8 | protein_coding | deleterious(0) | benign(0.164) | TCGA-D8-A1XK-01 | Breast | breast invasive carcinoma | Female | <65 | I/II | Chemotherapy | doxorubicine+cyclophosphamide | SD | |
| MIDN | SNV | Missense_Mutation | rs746153442 | c.946G>A | p.Ala316Thr | p.A316T | Q504T8 | protein_coding | deleterious(0) | benign(0.187) | TCGA-4T-AA8H-01 | Colorectum | colon adenocarcinoma | Female | <65 | I/II | Unknown | Unknown | SD |
| MIDN | SNV | Missense_Mutation | rs766876307 | c.826G>A | p.Ala276Thr | p.A276T | Q504T8 | protein_coding | deleterious(0.02) | possibly_damaging(0.889) | TCGA-A6-6649-01 | Colorectum | colon adenocarcinoma | Male | >=65 | III/IV | Chemotherapy | fluorouracil | SD |
| MIDN | SNV | Missense_Mutation | novel | c.282C>A | p.Ser94Arg | p.S94R | Q504T8 | protein_coding | deleterious(0) | probably_damaging(0.997) | TCGA-AZ-4682-01 | Colorectum | colon adenocarcinoma | Male | <65 | I/II | Chemotherapy | camptosar | PD |
| MIDN | SNV | Missense_Mutation | rs753884875 | c.992N>A | p.Arg331His | p.R331H | Q504T8 | protein_coding | deleterious(0) | possibly_damaging(0.65) | TCGA-D5-6928-01 | Colorectum | colon adenocarcinoma | Male | >=65 | I/II | Unknown | Unknown | SD |
| MIDN | SNV | Missense_Mutation | rs764769740 | c.1339N>A | p.Asp447Asn | p.D447N | Q504T8 | protein_coding | deleterious_low_confidence(0) | probably_damaging(0.99) | TCGA-D5-6928-01 | Colorectum | colon adenocarcinoma | Male | >=65 | I/II | Unknown | Unknown | SD |
| MIDN | SNV | Missense_Mutation | c.162N>C | p.Glu54Asp | p.E54D | Q504T8 | protein_coding | tolerated(0.12) | benign(0.007) | TCGA-DM-A1DA-01 | Colorectum | colon adenocarcinoma | Female | >=65 | III/IV | Unknown | Unknown | SD | |
| MIDN | SNV | Missense_Mutation | rs138120774 | c.802G>A | p.Val268Ile | p.V268I | Q504T8 | protein_coding | tolerated(0.43) | benign(0.099) | TCGA-G4-6309-01 | Colorectum | colon adenocarcinoma | Female | <65 | III/IV | Chemotherapy | xeloda | PD |
| MIDN | deletion | Frame_Shift_Del | c.1297delN | p.Gly434AlafsTer91 | p.G434Afs*91 | Q504T8 | protein_coding | TCGA-AA-3492-01 | Colorectum | colon adenocarcinoma | Female | >=65 | I/II | Unknown | Unknown | SD |
| Page: 1 2 3 4 |
Top |
Related drugs of malignant transformation related genes |
| Identification of chemicals and drugs interact with genes involved in malignant transfromation |
| (DGIdb 4.0) |
| Entrez ID | Symbol | Category | Interaction Types | Drug Claim Name | Drug Name | PMIDs |
| Page: 1 |

Copyright 2023-Present -The University of Texas Health Science Center at Houston |