
|
|||||
|
 | |
| |
| |
| |
| |
| |
|
Gene: MID1IP1 |
Gene summary for MID1IP1 |
| Gene information | Species | Human | Gene symbol | MID1IP1 | Gene ID | 58526 |
| Gene name | MID1 interacting protein 1 | |
| Gene Alias | G12-like | |
| Cytomap | Xp11.4 | |
| Gene Type | protein-coding | GO ID | GO:0000226 | UniProtAcc | Q9NPA3 |
Top |
Malignant transformation analysis |
| Identification of the aberrant gene expression in precancerous and cancerous lesions by comparing the gene expression of stem-like cells in diseased tissues with normal stem cells |
| Entrez ID | Symbol | Replicates | Species | Organ | Tissue | Adj P-value | Log2FC | Malignancy |
| 58526 | MID1IP1 | LZE4T | Human | Esophagus | ESCC | 1.34e-04 | 2.16e-01 | 0.0811 |
| 58526 | MID1IP1 | LZE7T | Human | Esophagus | ESCC | 4.49e-04 | 7.26e-01 | 0.0667 |
| 58526 | MID1IP1 | LZE8T | Human | Esophagus | ESCC | 1.13e-07 | 4.19e-01 | 0.067 |
| 58526 | MID1IP1 | LZE20T | Human | Esophagus | ESCC | 2.70e-03 | 1.98e-02 | 0.0662 |
| 58526 | MID1IP1 | LZE21T | Human | Esophagus | ESCC | 1.48e-03 | 3.10e-01 | 0.0655 |
| 58526 | MID1IP1 | P2T-E | Human | Esophagus | ESCC | 4.43e-15 | 4.50e-01 | 0.1177 |
| 58526 | MID1IP1 | P4T-E | Human | Esophagus | ESCC | 8.41e-14 | 4.21e-01 | 0.1323 |
| 58526 | MID1IP1 | P5T-E | Human | Esophagus | ESCC | 4.17e-14 | 6.76e-01 | 0.1327 |
| 58526 | MID1IP1 | P8T-E | Human | Esophagus | ESCC | 6.23e-29 | 5.96e-01 | 0.0889 |
| 58526 | MID1IP1 | P9T-E | Human | Esophagus | ESCC | 1.26e-02 | 3.58e-01 | 0.1131 |
| 58526 | MID1IP1 | P10T-E | Human | Esophagus | ESCC | 8.81e-24 | 4.05e-01 | 0.116 |
| 58526 | MID1IP1 | P11T-E | Human | Esophagus | ESCC | 4.80e-09 | 8.60e-01 | 0.1426 |
| 58526 | MID1IP1 | P12T-E | Human | Esophagus | ESCC | 3.98e-11 | 1.02e-01 | 0.1122 |
| 58526 | MID1IP1 | P15T-E | Human | Esophagus | ESCC | 5.56e-15 | 5.38e-01 | 0.1149 |
| 58526 | MID1IP1 | P16T-E | Human | Esophagus | ESCC | 2.86e-10 | 1.63e-01 | 0.1153 |
| 58526 | MID1IP1 | P17T-E | Human | Esophagus | ESCC | 2.47e-04 | 5.04e-01 | 0.1278 |
| 58526 | MID1IP1 | P19T-E | Human | Esophagus | ESCC | 3.06e-05 | 1.33e+00 | 0.1662 |
| 58526 | MID1IP1 | P20T-E | Human | Esophagus | ESCC | 2.00e-04 | 1.91e-01 | 0.1124 |
| 58526 | MID1IP1 | P21T-E | Human | Esophagus | ESCC | 1.35e-19 | 4.14e-01 | 0.1617 |
| 58526 | MID1IP1 | P22T-E | Human | Esophagus | ESCC | 1.90e-10 | 2.76e-01 | 0.1236 |
| Page: 1 2 3 4 5 |
| Tissue | Expression Dynamics | Abbreviation |
| Esophagus | 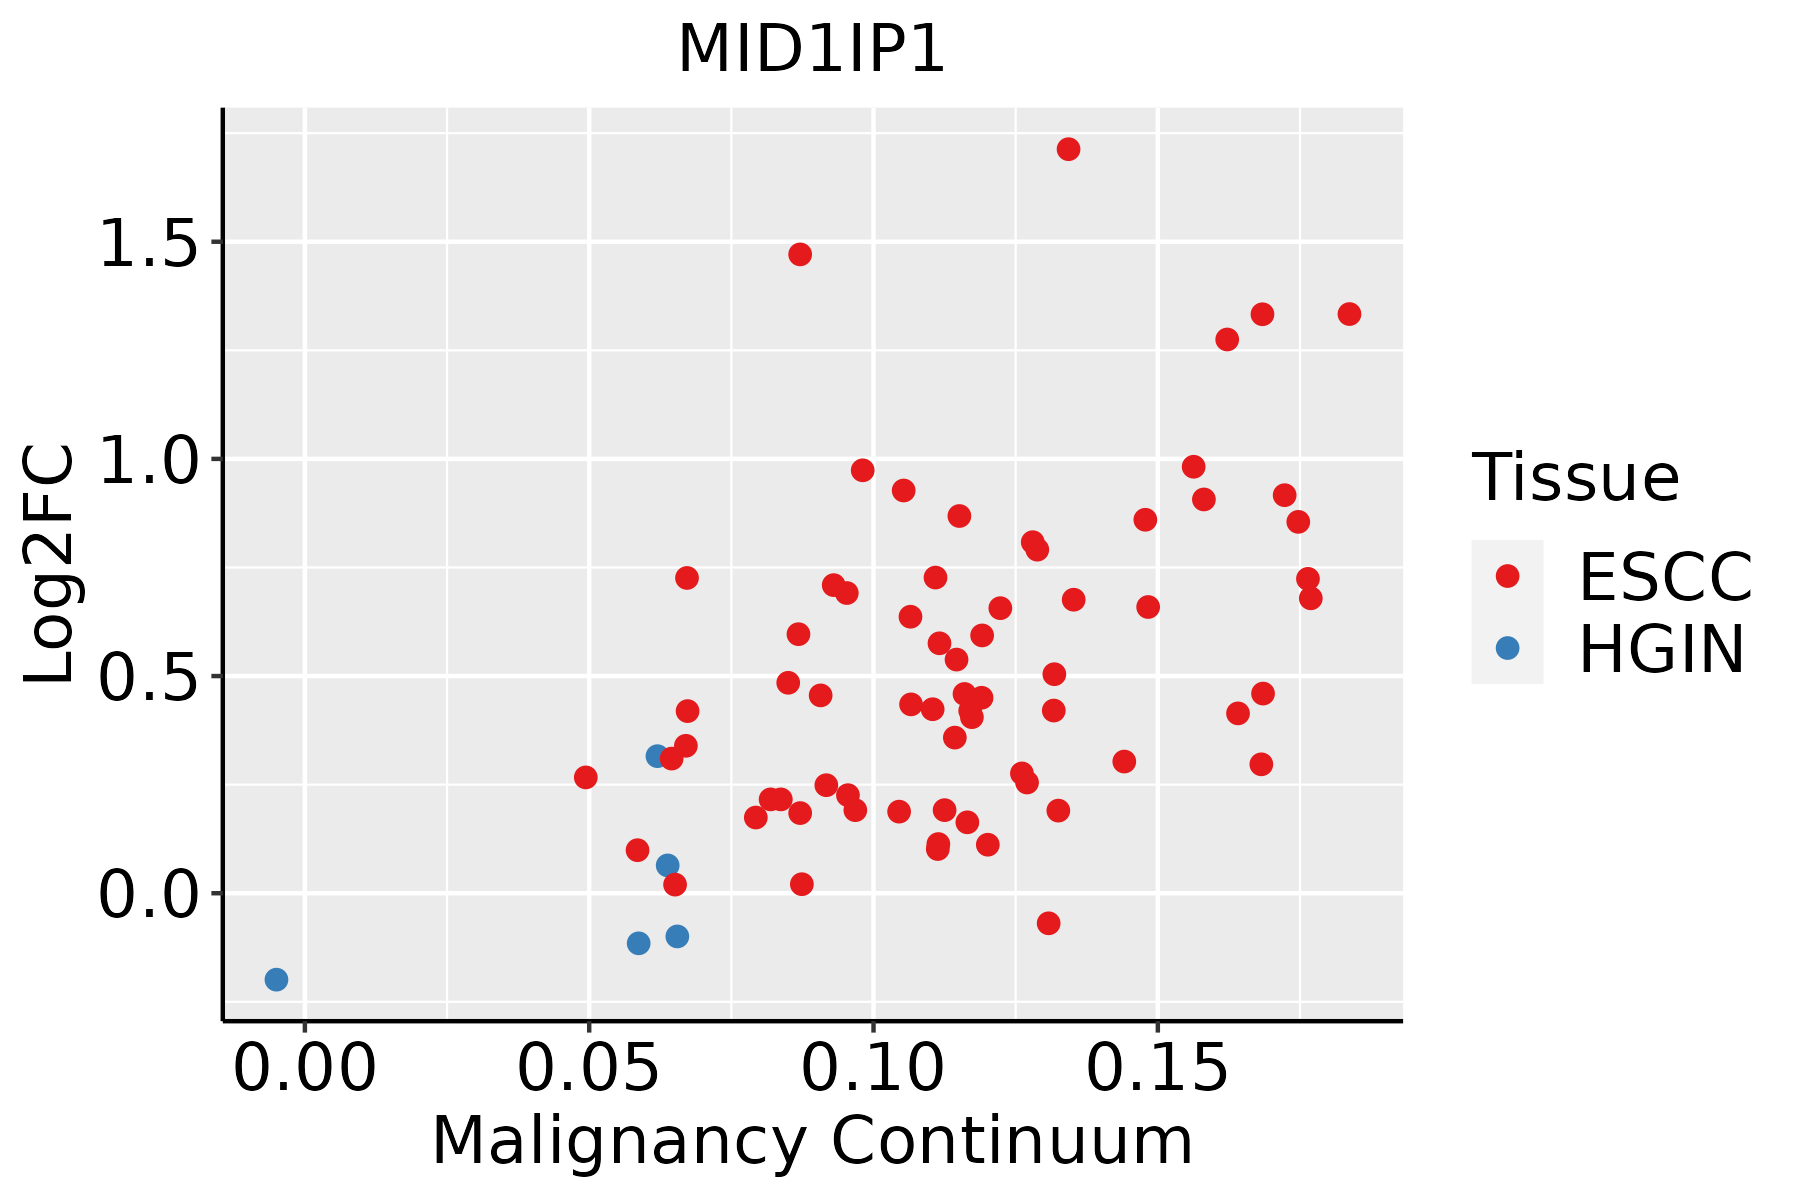 | ESCC: Esophageal squamous cell carcinoma |
| HGIN: High-grade intraepithelial neoplasias | ||
| LGIN: Low-grade intraepithelial neoplasias | ||
| Liver | 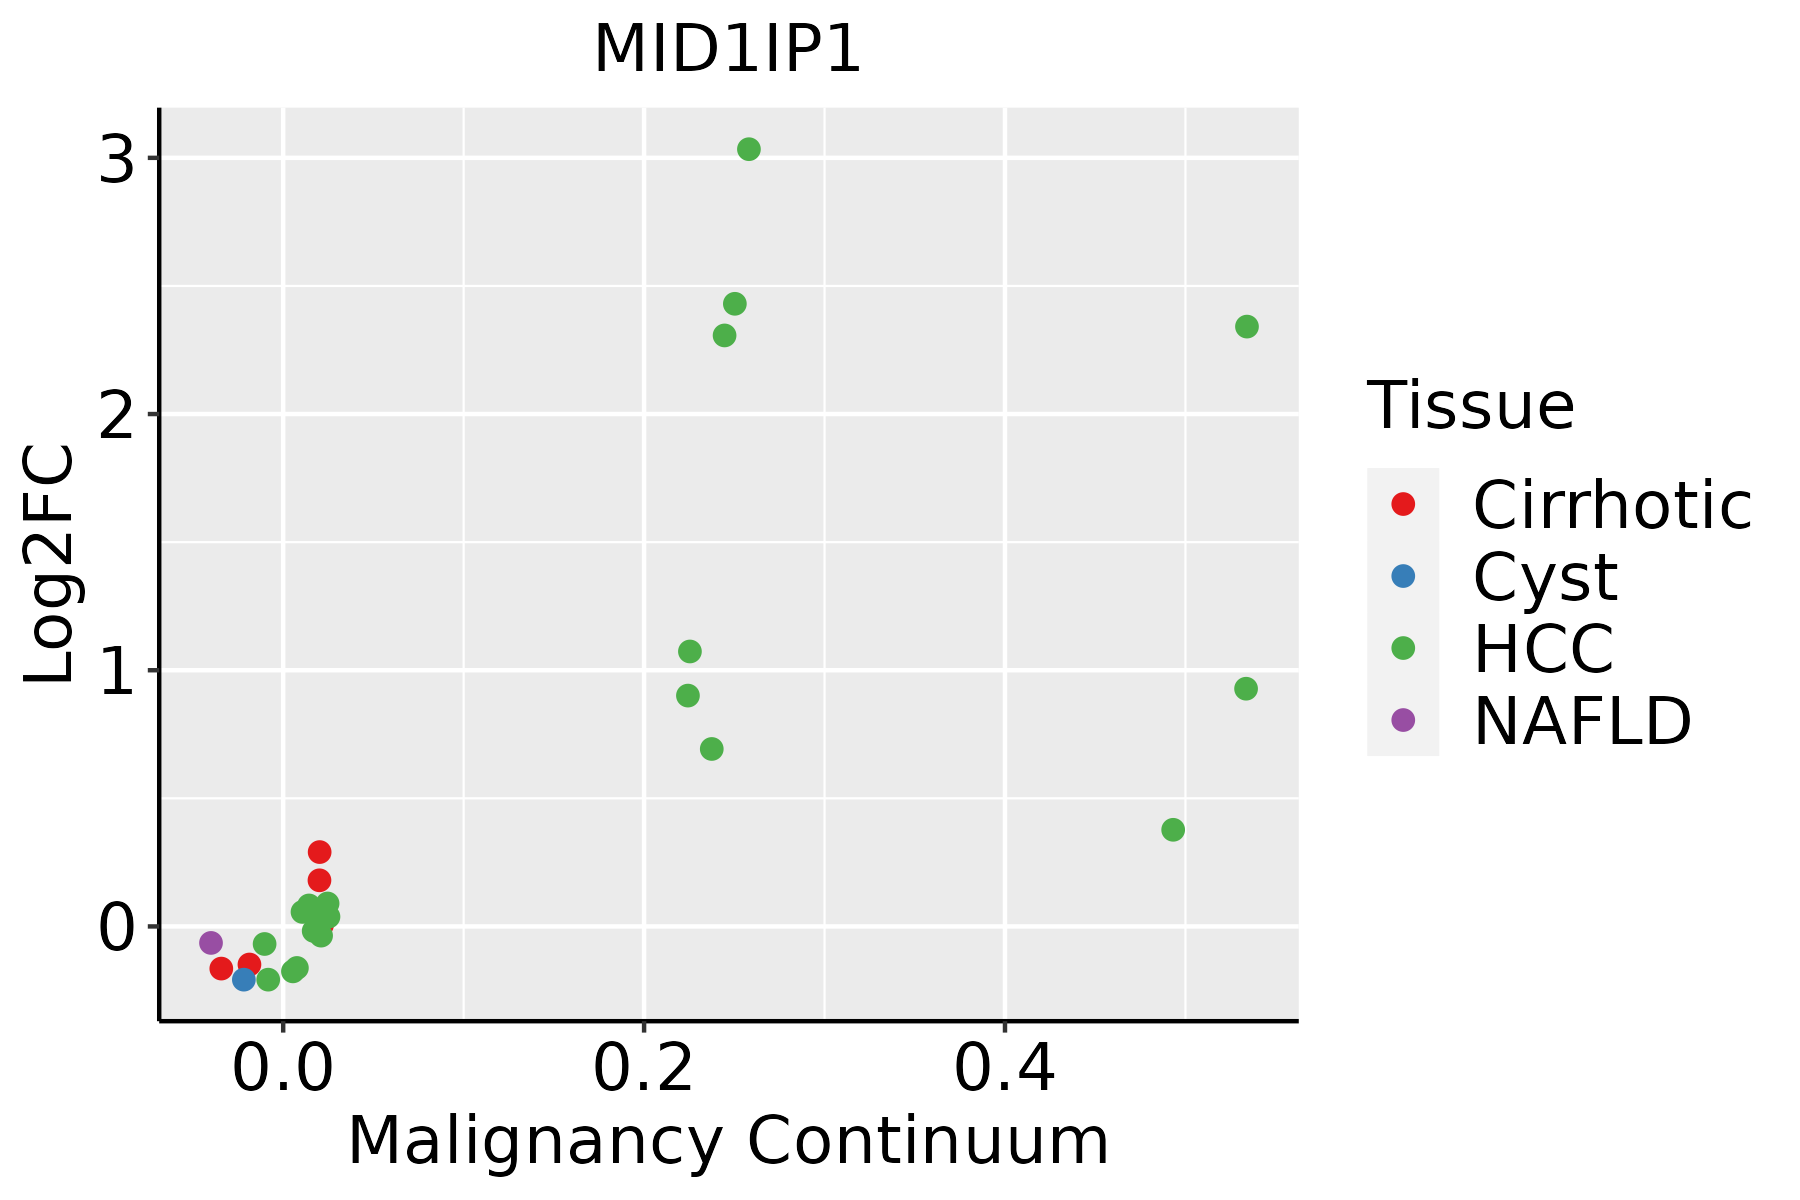 | HCC: Hepatocellular carcinoma |
| NAFLD: Non-alcoholic fatty liver disease | ||
| Oral Cavity | 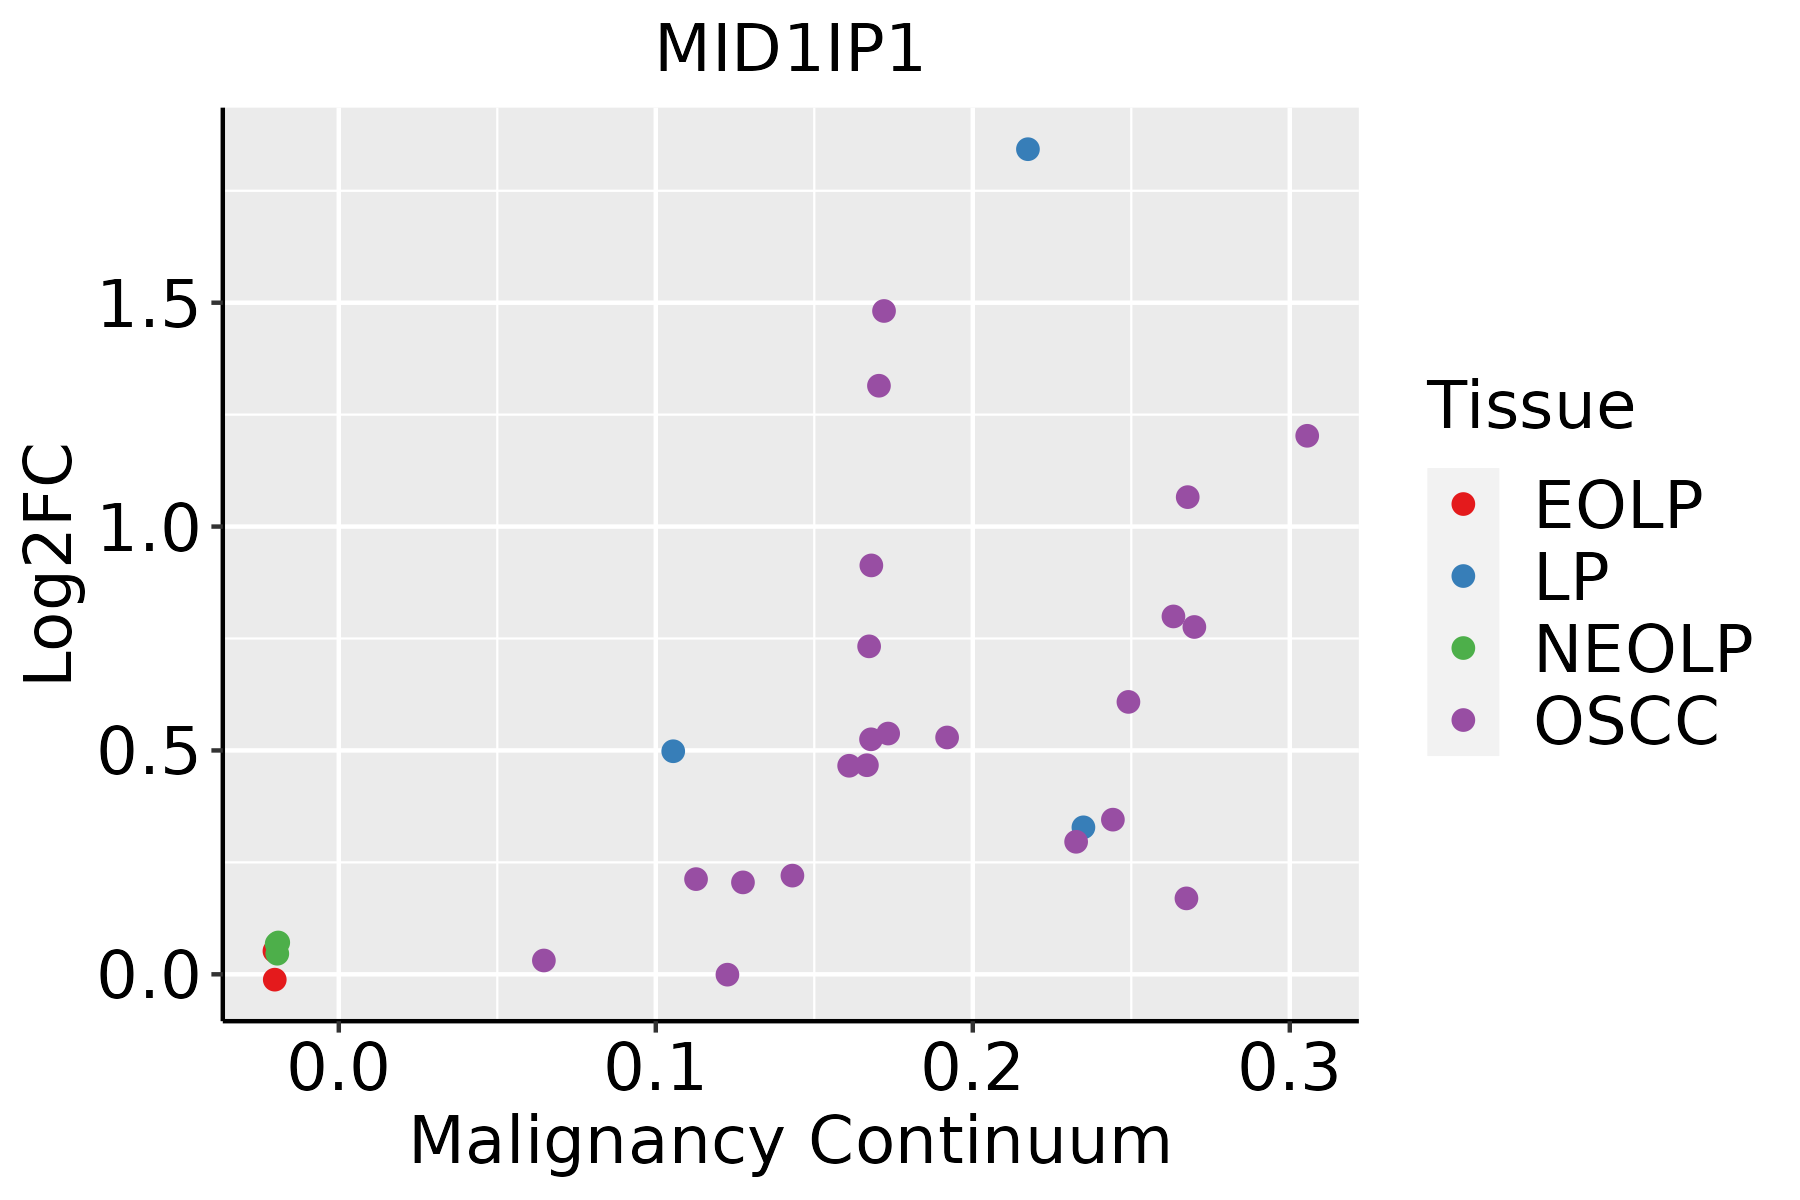 | EOLP: Erosive Oral lichen planus |
| LP: leukoplakia | ||
| NEOLP: Non-erosive oral lichen planus | ||
| OSCC: Oral squamous cell carcinoma | ||
| Thyroid | 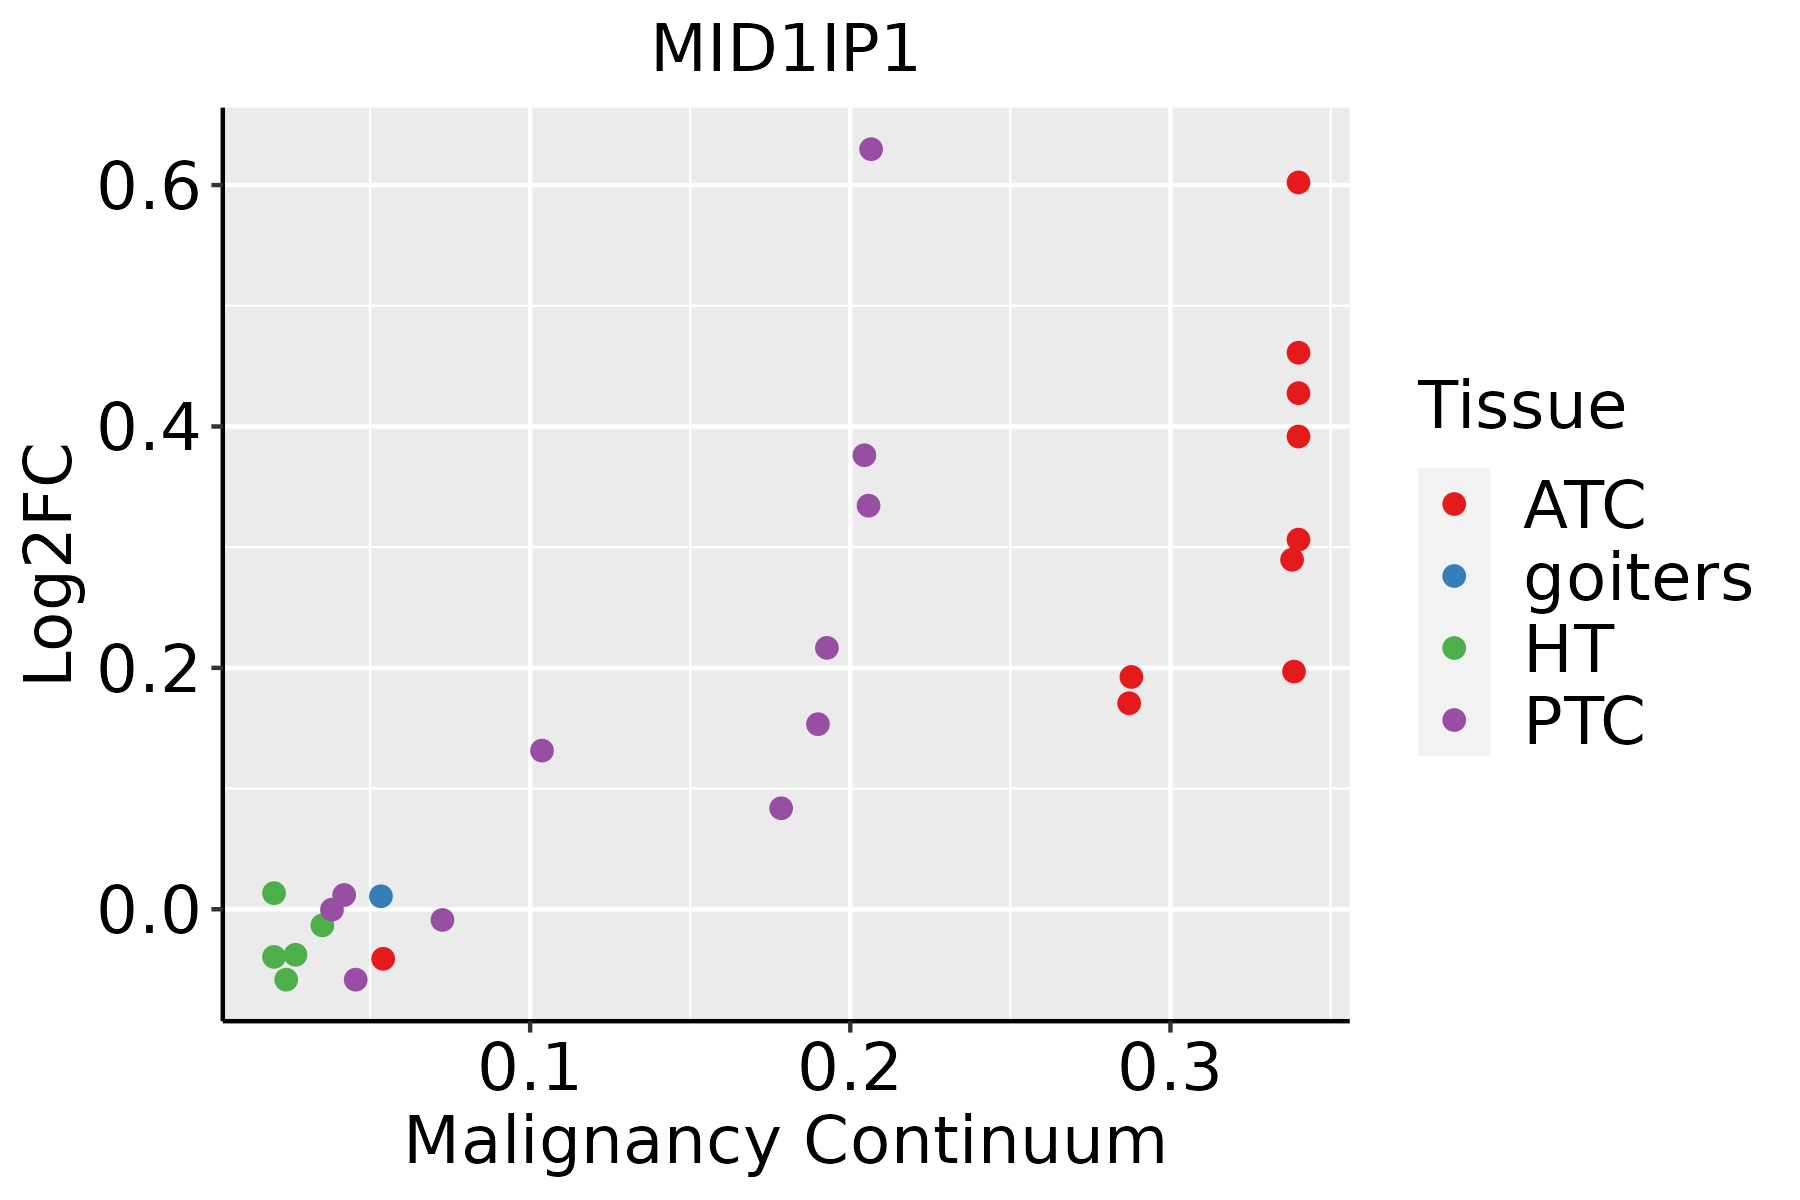 | ATC: Anaplastic thyroid cancer |
| HT: Hashimoto's thyroiditis | ||
| PTC: Papillary thyroid cancer |
| ∗log2FC in expression of this searched gene in stem-like cells from each diseased tissue sample relative to stem-like cells in normal samples in each tissue plotted against the malignancy continuum. Samples are colored based on if they are from different disease stage. |
Top |
Malignant transformation related pathway analysis |
| Find out the enriched GO biological processes and KEGG pathways involved in transition from healthy to precancer to cancer |
| Tissue | Disease Stage | Enriched GO biological Processes |
| Colorectum | AD |  |
| Colorectum | SER |  |
| Colorectum | MSS |  |
| Colorectum | MSI-H |  |
| Colorectum | FAP |  |
| ∗Top 15 enriched GO BP terms are showed in the bar plot of each disease state in each tissue. Each row represents a significant GO biological process which is colored according to the -log10(p.adjust). |
| Page: 1 2 3 4 5 6 7 8 9 |
| GO ID | Tissue | Disease Stage | Description | Gene Ratio | Bg Ratio | pvalue | p.adjust | Count |
| GO:0022411111 | Esophagus | ESCC | cellular component disassembly | 305/8552 | 443/18723 | 1.94e-23 | 4.57e-21 | 305 |
| GO:003298416 | Esophagus | ESCC | protein-containing complex disassembly | 151/8552 | 224/18723 | 3.45e-11 | 1.15e-09 | 151 |
| GO:1902903111 | Esophagus | ESCC | regulation of supramolecular fiber organization | 237/8552 | 383/18723 | 9.06e-11 | 2.75e-09 | 237 |
| GO:0010639110 | Esophagus | ESCC | negative regulation of organelle organization | 215/8552 | 348/18723 | 8.20e-10 | 2.01e-08 | 215 |
| GO:0051258111 | Esophagus | ESCC | protein polymerization | 183/8552 | 297/18723 | 1.94e-08 | 3.75e-07 | 183 |
| GO:00705078 | Esophagus | ESCC | regulation of microtubule cytoskeleton organization | 99/8552 | 148/18723 | 1.43e-07 | 2.29e-06 | 99 |
| GO:00066318 | Esophagus | ESCC | fatty acid metabolic process | 217/8552 | 390/18723 | 4.21e-05 | 3.39e-04 | 217 |
| GO:00311094 | Esophagus | ESCC | microtubule polymerization or depolymerization | 77/8552 | 122/18723 | 7.60e-05 | 5.68e-04 | 77 |
| GO:00463948 | Esophagus | ESCC | carboxylic acid biosynthetic process | 175/8552 | 314/18723 | 1.98e-04 | 1.26e-03 | 175 |
| GO:00432446 | Esophagus | ESCC | regulation of protein-containing complex disassembly | 75/8552 | 121/18723 | 2.17e-04 | 1.36e-03 | 75 |
| GO:00311104 | Esophagus | ESCC | regulation of microtubule polymerization or depolymerization | 57/8552 | 88/18723 | 2.32e-04 | 1.44e-03 | 57 |
| GO:00160538 | Esophagus | ESCC | organic acid biosynthetic process | 175/8552 | 316/18723 | 3.04e-04 | 1.82e-03 | 175 |
| GO:00620129 | Esophagus | ESCC | regulation of small molecule metabolic process | 184/8552 | 334/18723 | 3.11e-04 | 1.85e-03 | 184 |
| GO:00421805 | Esophagus | ESCC | cellular ketone metabolic process | 120/8552 | 211/18723 | 6.70e-04 | 3.55e-03 | 120 |
| GO:00328864 | Esophagus | ESCC | regulation of microtubule-based process | 134/8552 | 240/18723 | 9.44e-04 | 4.80e-03 | 134 |
| GO:00436245 | Esophagus | ESCC | cellular protein complex disassembly | 78/8552 | 136/18723 | 4.00e-03 | 1.62e-02 | 78 |
| GO:00192168 | Esophagus | ESCC | regulation of lipid metabolic process | 172/8552 | 331/18723 | 1.20e-02 | 4.02e-02 | 172 |
| GO:000663112 | Liver | Cirrhotic | fatty acid metabolic process | 165/4634 | 390/18723 | 1.29e-14 | 1.26e-12 | 165 |
| GO:00224117 | Liver | Cirrhotic | cellular component disassembly | 182/4634 | 443/18723 | 1.59e-14 | 1.54e-12 | 182 |
| GO:001605312 | Liver | Cirrhotic | organic acid biosynthetic process | 139/4634 | 316/18723 | 4.28e-14 | 3.83e-12 | 139 |
| Page: 1 2 3 4 5 6 |
| Pathway ID | Tissue | Disease Stage | Description | Gene Ratio | Bg Ratio | pvalue | p.adjust | qvalue | Count |
| Page: 1 |
Top |
Cell-cell communication analysis |
| Identification of potential cell-cell interactions between two cell types and their ligand-receptor pairs for different disease states |
| Ligand | Receptor | LRpair | Pathway | Tissue | Disease Stage |
| Page: 1 |
Top |
Single-cell gene regulatory network inference analysis |
| Find out the significant the regulons (TFs) and the target genes of each regulon across cell types for different disease states |
| TF | Cell Type | Tissue | Disease Stage | Target Gene | RSS | Regulon Activity |
| ∗The dot plots of a searched regulon are shown for all cell subpopulations in each disease state of each tissue based on the regulon specific score inferred using pySCENIC and by calculating the average expression. |
| Page: 1 |
Top |
Somatic mutation of malignant transformation related genes |
| Annotation of somatic variants for genes involved in malignant transformation |
| Hugo Symbol | Variant Class | Variant Classification | dbSNP RS | HGVSc | HGVSp | HGVSp Short | SWISSPROT | BIOTYPE | SIFT | PolyPhen | Tumor Sample Barcode | Tissue | Histology | Sex | Age | Stage | Therapy Types | Drugs | Outcome |
| MID1IP1 | SNV | Missense_Mutation | c.90G>C | p.Gln30His | p.Q30H | Q9NPA3 | protein_coding | deleterious(0) | probably_damaging(0.995) | TCGA-BH-A209-01 | Breast | breast invasive carcinoma | Female | >=65 | I/II | Unknown | Unknown | SD | |
| MID1IP1 | SNV | Missense_Mutation | novel | c.85N>A | p.Asp29Asn | p.D29N | Q9NPA3 | protein_coding | deleterious(0.02) | probably_damaging(0.997) | TCGA-JW-A5VL-01 | Cervix | cervical & endocervical cancer | Female | <65 | I/II | Unknown | Unknown | SD |
| MID1IP1 | SNV | Missense_Mutation | c.30N>T | p.Gln10His | p.Q10H | Q9NPA3 | protein_coding | deleterious(0.04) | probably_damaging(1) | TCGA-A6-6650-01 | Colorectum | colon adenocarcinoma | Female | >=65 | I/II | Unknown | Unknown | SD | |
| MID1IP1 | SNV | Missense_Mutation | c.313N>A | p.Val105Ile | p.V105I | Q9NPA3 | protein_coding | tolerated(0.07) | benign(0.376) | TCGA-AA-3492-01 | Colorectum | colon adenocarcinoma | Female | >=65 | I/II | Unknown | Unknown | SD | |
| MID1IP1 | SNV | Missense_Mutation | c.54G>A | p.Met18Ile | p.M18I | Q9NPA3 | protein_coding | deleterious(0) | benign(0.372) | TCGA-AA-3966-01 | Colorectum | colon adenocarcinoma | Female | >=65 | I/II | Unknown | Unknown | SD | |
| MID1IP1 | SNV | Missense_Mutation | c.67N>T | p.Gly23Cys | p.G23C | Q9NPA3 | protein_coding | deleterious(0.04) | probably_damaging(0.998) | TCGA-AZ-6598-01 | Colorectum | colon adenocarcinoma | Female | >=65 | I/II | Unknown | Unknown | SD | |
| MID1IP1 | SNV | Missense_Mutation | c.118N>A | p.Asp40Asn | p.D40N | Q9NPA3 | protein_coding | deleterious(0.02) | probably_damaging(1) | TCGA-AG-3892-01 | Colorectum | rectum adenocarcinoma | Female | <65 | I/II | Unknown | Unknown | SD | |
| MID1IP1 | SNV | Missense_Mutation | novel | c.32N>G | p.Lys11Arg | p.K11R | Q9NPA3 | protein_coding | deleterious(0) | possibly_damaging(0.64) | TCGA-A5-A0G2-01 | Endometrium | uterine corpus endometrioid carcinoma | Female | <65 | III/IV | Unknown | Unknown | SD |
| MID1IP1 | SNV | Missense_Mutation | c.277C>T | p.Leu93Phe | p.L93F | Q9NPA3 | protein_coding | deleterious(0.02) | probably_damaging(0.93) | TCGA-A5-A1OF-01 | Endometrium | uterine corpus endometrioid carcinoma | Female | <65 | I/II | Unknown | Unknown | SD | |
| MID1IP1 | SNV | Missense_Mutation | c.454N>T | p.Arg152Cys | p.R152C | Q9NPA3 | protein_coding | deleterious(0.03) | possibly_damaging(0.892) | TCGA-AX-A0J1-01 | Endometrium | uterine corpus endometrioid carcinoma | Female | >=65 | I/II | Unknown | Unknown | SD |
| Page: 1 2 3 |
Top |
Related drugs of malignant transformation related genes |
| Identification of chemicals and drugs interact with genes involved in malignant transfromation |
| (DGIdb 4.0) |
| Entrez ID | Symbol | Category | Interaction Types | Drug Claim Name | Drug Name | PMIDs |
| Page: 1 |

Copyright 2023-Present -The University of Texas Health Science Center at Houston |