Schematic overview of the cellular and molecular mechanisms involved in the cancer progression, including the proposed cellular and molecular mechanisms in cancer cells trajectory. AT1: alveolar type 1 cells; AT2: alveolar type 2 cells; AAH: atypical adenomatous hyperplasia; AIS: adenocarcinoma in situ; MIA: minimally invasive adenocarcinoma; IA: invasive adenocarcinoma; EMT: epithelial-mesenchymal transition

Home

Download

Statistics

Help

Contact

Center for Computational Systems Medicine
leaf

Gene summary

leaf

Malignant transformation analysis

leaf

Malignant transformation related pathway analysis

leaf

Cell-cell communication analysis

leaf

Single-cell gene regulatory network inference analysis

leaf

Somatic mutation of malignant transformation related genes

leaf

Related drugs of malignant transformation related genes

Gene: MICU1

Gene summary for MICU1

check button Gene summary.

Gene informationSpeciesHuman
Gene symbol

MICU1

Gene ID

10367

Gene namemitochondrial calcium uptake 1
Gene AliasCALC
Cytomap10q22.1
Gene Typeprotein-coding
GO ID

GO:0006810

UniProtAcc

Q9BPX6


Top

Malignant transformation analysis

check button Identification of the aberrant gene expression in precancerous and cancerous lesions by comparing the gene expression of stem-like cells in diseased tissues with normal stem cells
check button Malignant transformation involving gene list.
Entrez IDSymbolReplicatesSpeciesOrganTissueAdj P-valueLog2FCMalignancy
10367MICU1HTA11_3410_2000001011HumanColorectumAD1.70e-08-2.47e-010.0155
10367MICU1HTA11_411_2000001011HumanColorectumSER2.84e-025.79e-01-0.2602
10367MICU1HTA11_5212_2000001011HumanColorectumAD2.74e-02-2.93e-01-0.2061
10367MICU1HTA11_99999974143_84620HumanColorectumMSS6.28e-11-4.82e-010.3005
10367MICU1A001-C-207HumanColorectumFAP2.32e-02-1.87e-010.1278
10367MICU1A015-C-203HumanColorectumFAP2.32e-21-3.39e-01-0.1294
10367MICU1A015-C-204HumanColorectumFAP1.72e-06-3.08e-01-0.0228
10367MICU1A014-C-040HumanColorectumFAP3.96e-05-2.56e-01-0.1184
10367MICU1A002-C-201HumanColorectumFAP1.60e-11-3.20e-010.0324
10367MICU1A002-C-203HumanColorectumFAP5.09e-03-1.56e-010.2786
10367MICU1A001-C-119HumanColorectumFAP1.29e-04-1.41e-01-0.1557
10367MICU1A001-C-108HumanColorectumFAP9.89e-14-2.22e-01-0.0272
10367MICU1A002-C-205HumanColorectumFAP1.63e-19-2.74e-01-0.1236
10367MICU1A015-C-005HumanColorectumFAP1.31e-02-1.37e-01-0.0336
10367MICU1A015-C-006HumanColorectumFAP1.36e-14-3.40e-01-0.0994
10367MICU1A015-C-106HumanColorectumFAP6.73e-09-2.19e-01-0.0511
10367MICU1A002-C-114HumanColorectumFAP9.92e-18-3.48e-01-0.1561
10367MICU1A015-C-104HumanColorectumFAP1.68e-24-2.16e-01-0.1899
10367MICU1A001-C-014HumanColorectumFAP2.39e-14-2.74e-010.0135
10367MICU1A002-C-016HumanColorectumFAP1.57e-20-3.53e-010.0521
Page: 1 2 3 4 5 6 7 8 

check button Transcriptomic changes along malignancy continuum.
TissueExpression DynamicsAbbreviation
Colorectum (GSE201348)The image shows the transcriptomic changes along malignancy continuum.log2FC in expression of this searched gene in stem-like cells from each diseased tissue sample relative to stem-like cells in normal samples in each tissue plotted against the malignancy continuum. Samples are colored based on if they are from different disease stage.FAP: Familial adenomatous polyposis
CRC: Colorectal cancer
Colorectum (HTA11)The image shows the transcriptomic changes along malignancy continuum.log2FC in expression of this searched gene in stem-like cells from each diseased tissue sample relative to stem-like cells in normal samples in each tissue plotted against the malignancy continuum. Samples are colored based on if they are from different disease stage.AD: Adenomas
SER: Sessile serrated lesions
MSI-H: Microsatellite-high colorectal cancer
MSS: Microsatellite stable colorectal cancer
EndometriumThe image shows the transcriptomic changes along malignancy continuum.log2FC in expression of this searched gene in stem-like cells from each diseased tissue sample relative to stem-like cells in normal samples in each tissue plotted against the malignancy continuum. Samples are colored based on if they are from different disease stage.AEH: Atypical endometrial hyperplasia
EEC: Endometrioid Cancer
EsophagusThe image shows the transcriptomic changes along malignancy continuum.log2FC in expression of this searched gene in stem-like cells from each diseased tissue sample relative to stem-like cells in normal samples in each tissue plotted against the malignancy continuum. Samples are colored based on if they are from different disease stage.
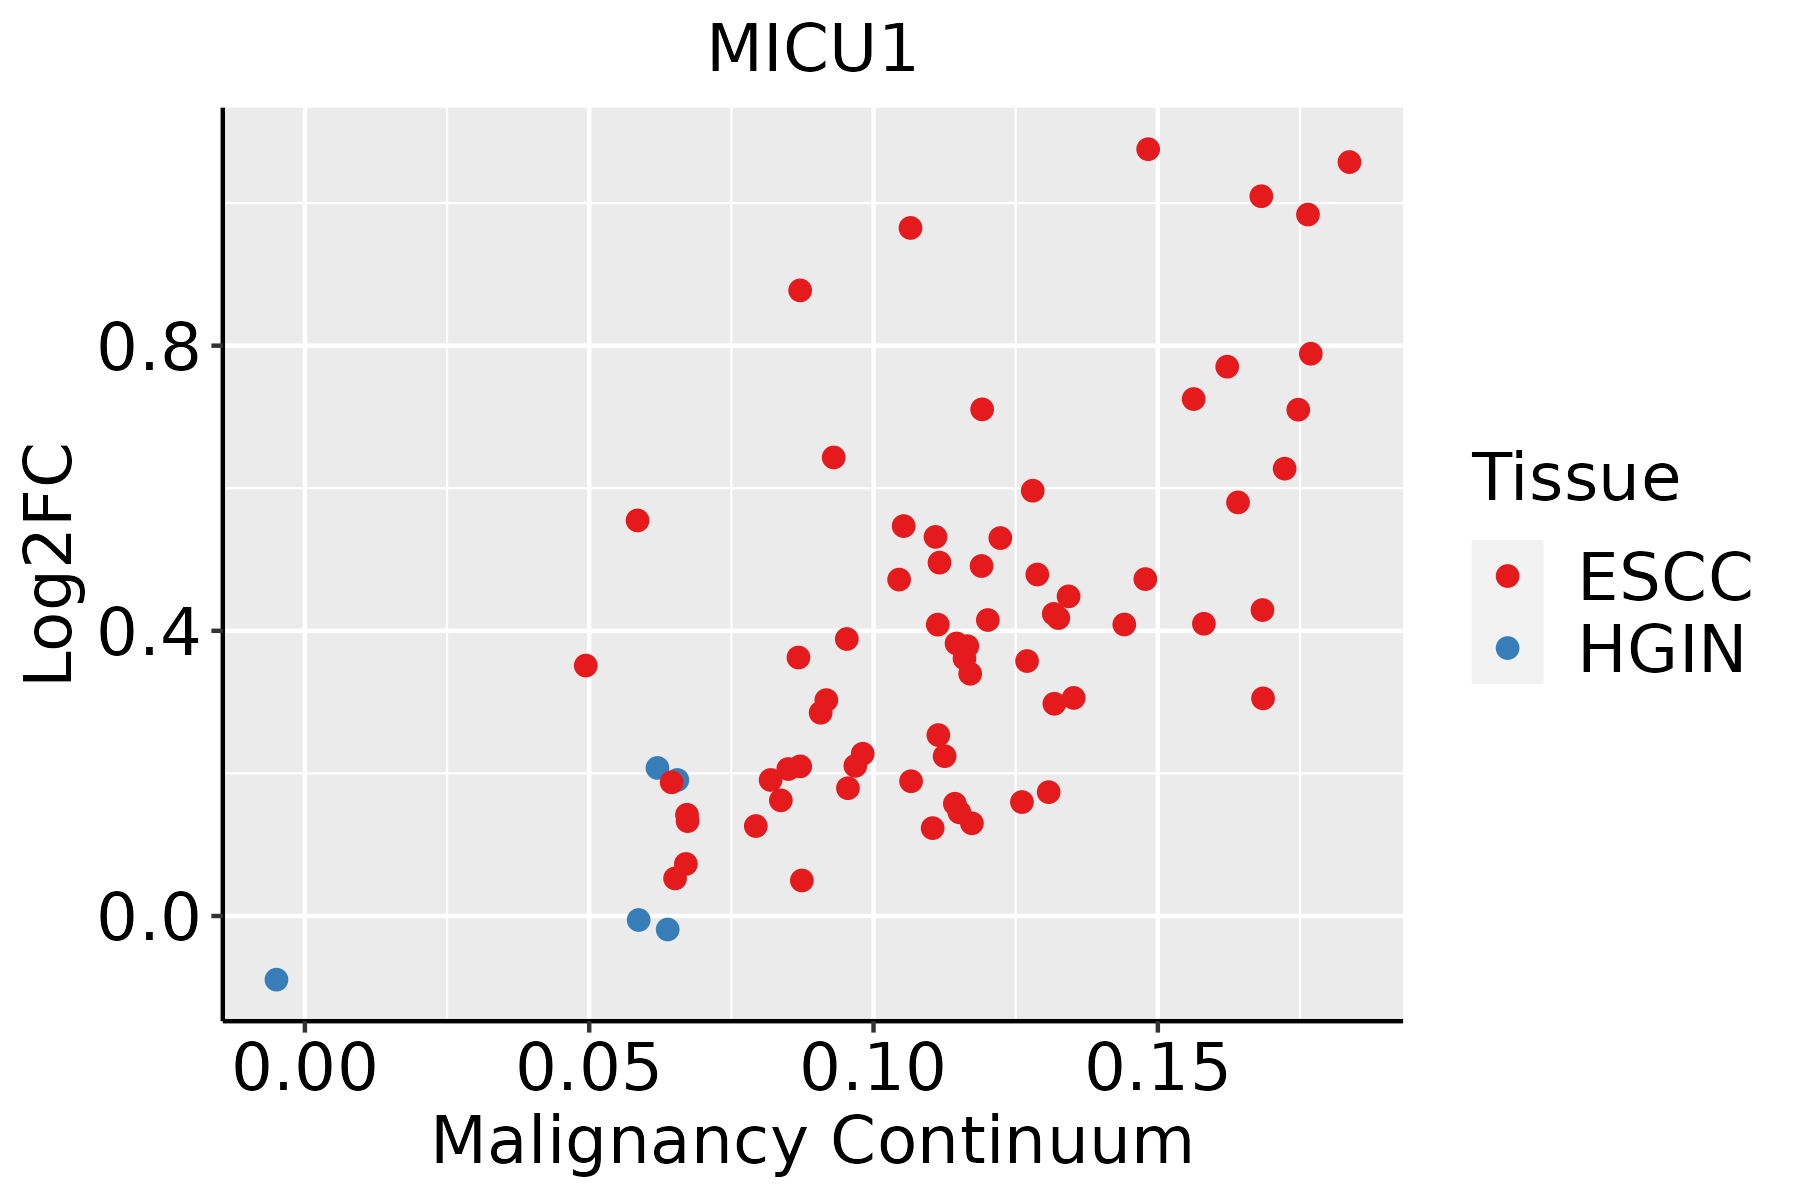
ESCC: Esophageal squamous cell carcinoma
HGIN: High-grade intraepithelial neoplasias
LGIN: Low-grade intraepithelial neoplasias
LiverThe image shows the transcriptomic changes along malignancy continuum.log2FC in expression of this searched gene in stem-like cells from each diseased tissue sample relative to stem-like cells in normal samples in each tissue plotted against the malignancy continuum. Samples are colored based on if they are from different disease stage.
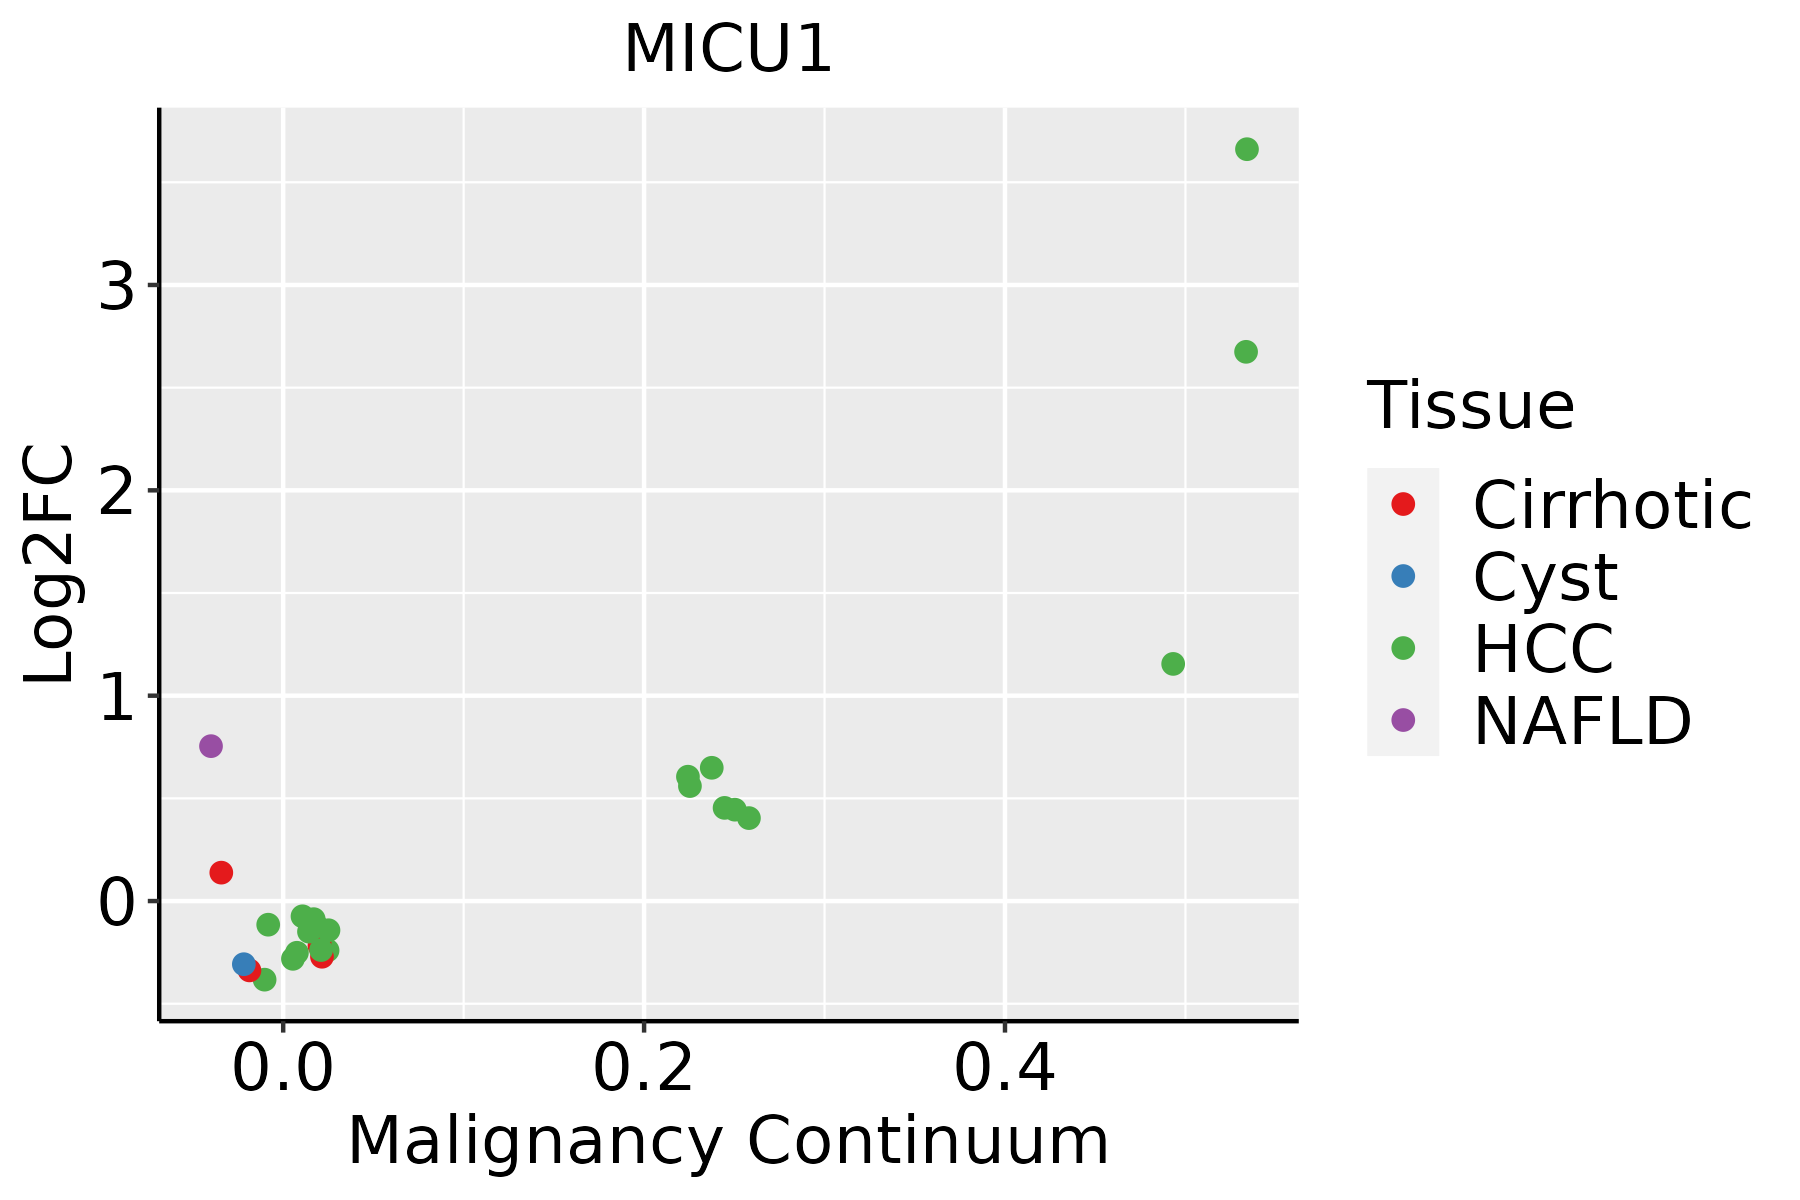
HCC: Hepatocellular carcinoma
NAFLD: Non-alcoholic fatty liver disease
LungThe image shows the transcriptomic changes along malignancy continuum.log2FC in expression of this searched gene in stem-like cells from each diseased tissue sample relative to stem-like cells in normal samples in each tissue plotted against the malignancy continuum. Samples are colored based on if they are from different disease stage.
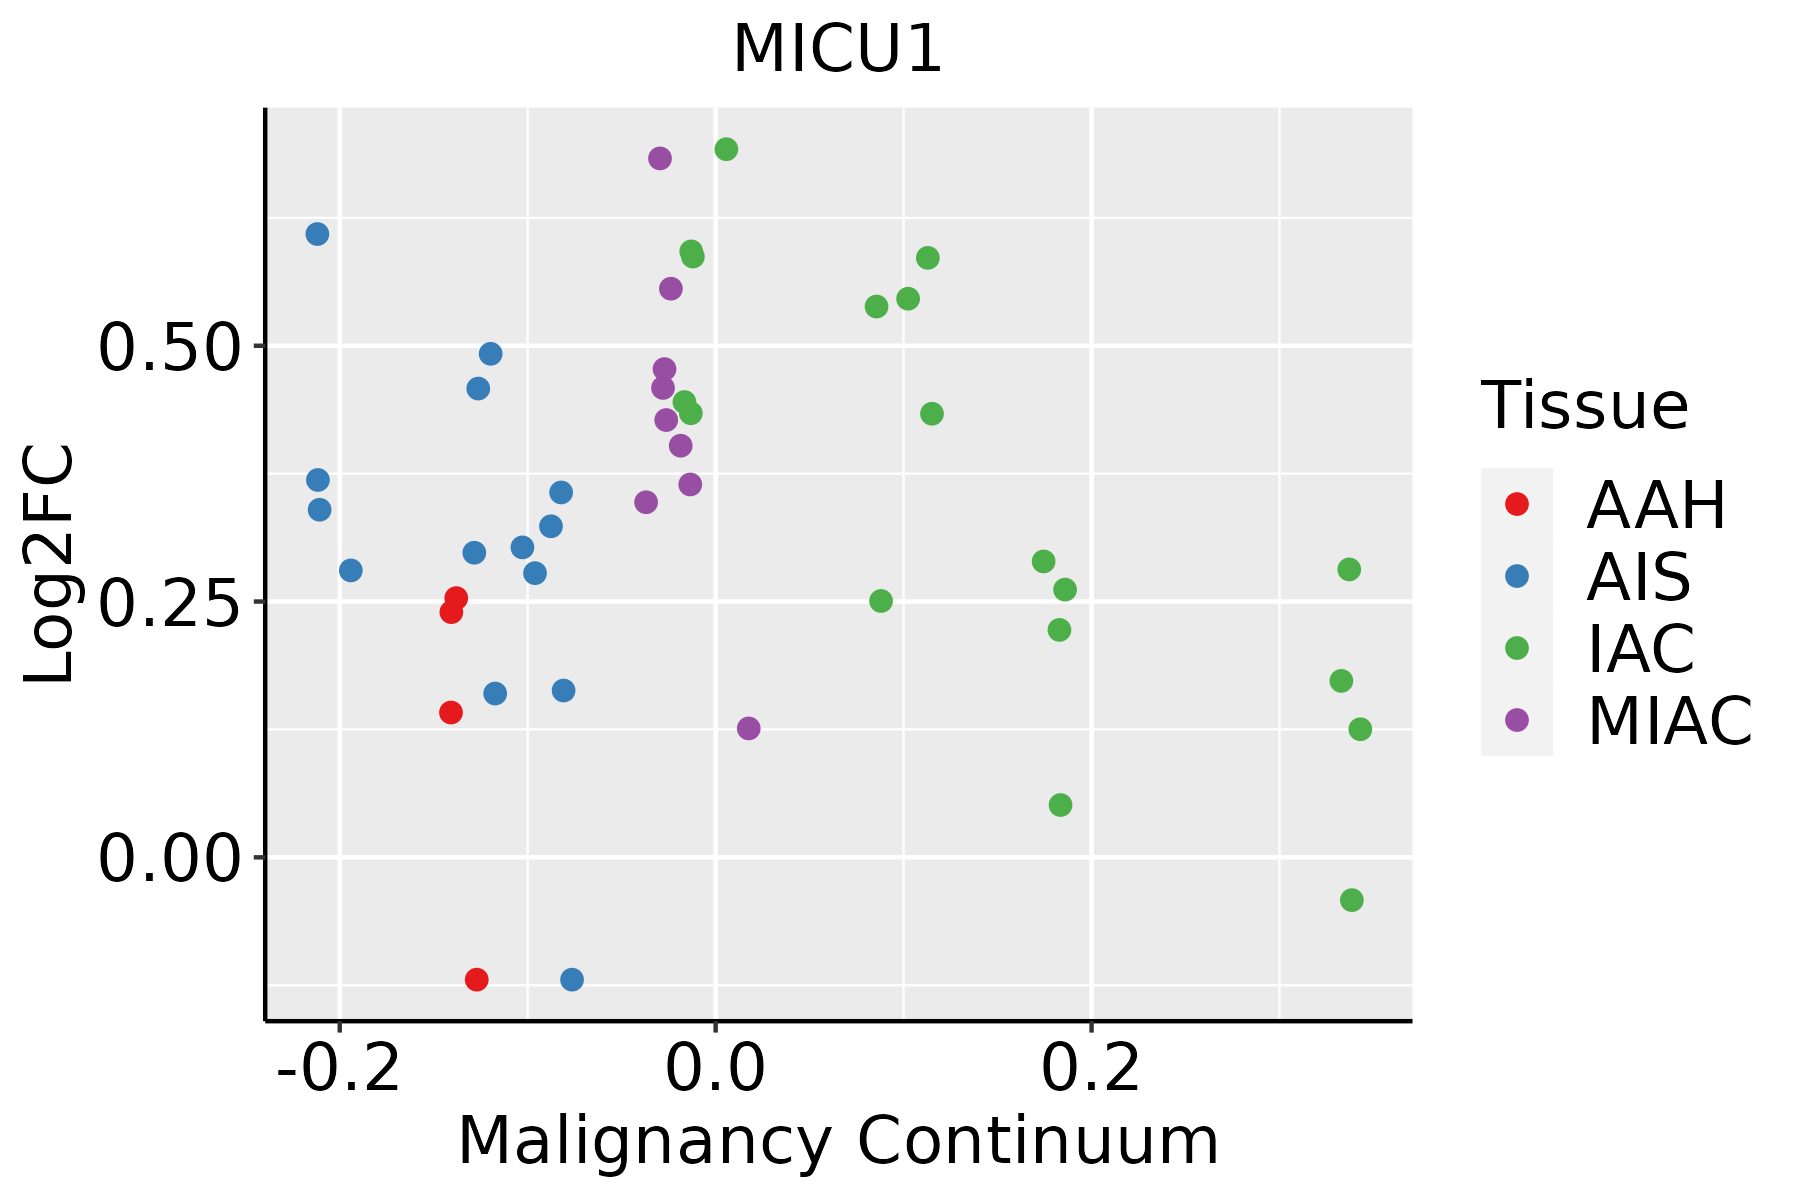
AAH: Atypical adenomatous hyperplasia
AIS: Adenocarcinoma in situ
IAC: Invasive lung adenocarcinoma
MIA: Minimally invasive adenocarcinoma
Oral CavityThe image shows the transcriptomic changes along malignancy continuum.log2FC in expression of this searched gene in stem-like cells from each diseased tissue sample relative to stem-like cells in normal samples in each tissue plotted against the malignancy continuum. Samples are colored based on if they are from different disease stage.EOLP: Erosive Oral lichen planus
LP: leukoplakia
NEOLP: Non-erosive oral lichen planus
OSCC: Oral squamous cell carcinoma
ThyroidThe image shows the transcriptomic changes along malignancy continuum.log2FC in expression of this searched gene in stem-like cells from each diseased tissue sample relative to stem-like cells in normal samples in each tissue plotted against the malignancy continuum. Samples are colored based on if they are from different disease stage.
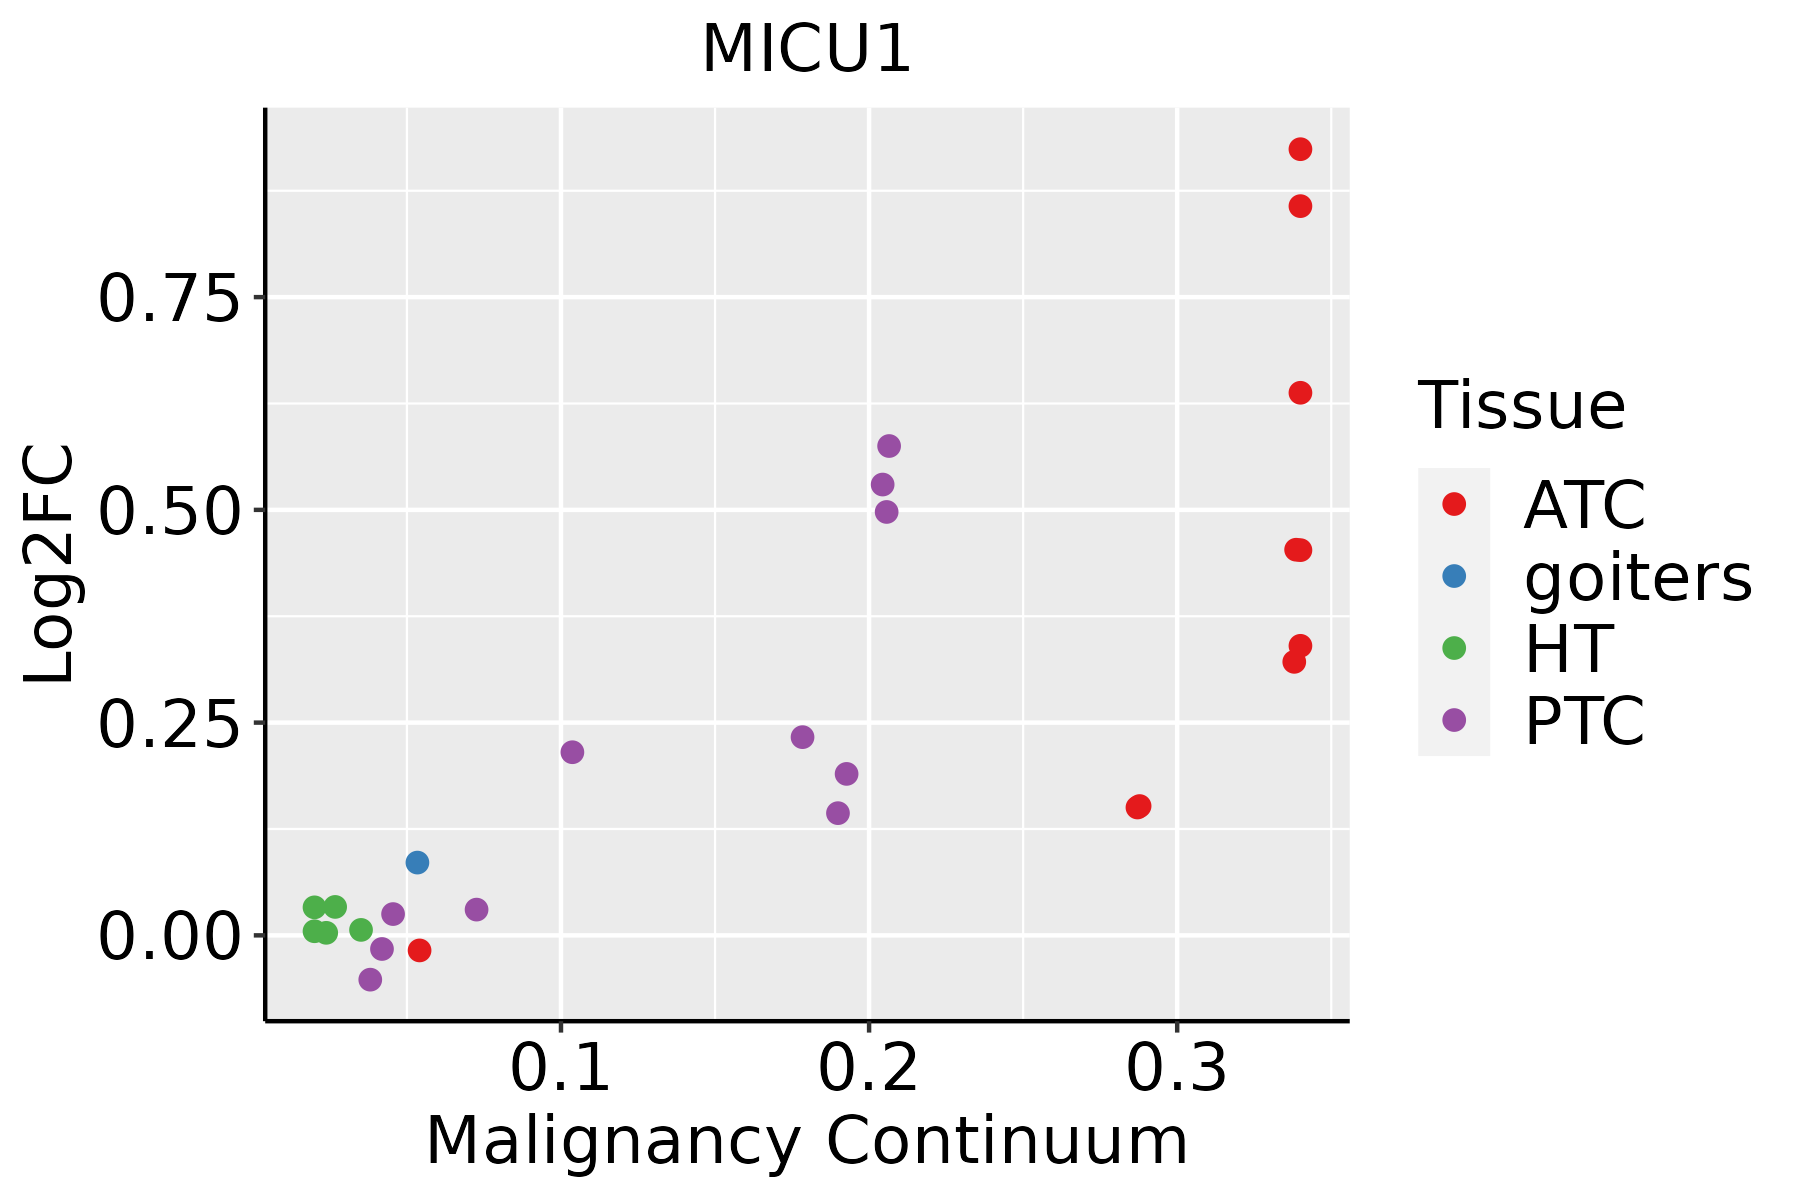
ATC: Anaplastic thyroid cancer
HT: Hashimoto's thyroiditis
PTC: Papillary thyroid cancer
∗log2FC in expression of this searched gene in stem-like cells from each diseased tissue sample relative to stem-like cells in normal samples in each tissue plotted against the malignancy continuum. Samples are colored based on if they are from different disease stage.

Top

Malignant transformation related pathway analysis

check buttonFind out the enriched GO biological processes and KEGG pathways involved in transition from healthy to precancer to cancer
check button Figure of enriched GO biological processes.
TissueDisease StageEnriched GO biological Processes
ColorectumADGO analysis - Figure of enriched GO biological processes: Top 15 enriched GO BP terms are showed in the bar plot of each disease state in each tissue. Each row represents a significant GO biological process which is colored according to the -log10(p.adjust).
ColorectumSERGO analysis - Figure of enriched GO biological processes: Top 15 enriched GO BP terms are showed in the bar plot of each disease state in each tissue. Each row represents a significant GO biological process which is colored according to the -log10(p.adjust).
ColorectumMSSGO analysis - Figure of enriched GO biological processes: Top 15 enriched GO BP terms are showed in the bar plot of each disease state in each tissue. Each row represents a significant GO biological process which is colored according to the -log10(p.adjust).
ColorectumMSI-HGO analysis - Figure of enriched GO biological processes: Top 15 enriched GO BP terms are showed in the bar plot of each disease state in each tissue. Each row represents a significant GO biological process which is colored according to the -log10(p.adjust).
ColorectumFAPGO analysis - Figure of enriched GO biological processes: Top 15 enriched GO BP terms are showed in the bar plot of each disease state in each tissue. Each row represents a significant GO biological process which is colored according to the -log10(p.adjust).
∗Top 15 enriched GO BP terms are showed in the bar plot of each disease state in each tissue. Each row represents a significant GO biological process which is colored according to the -log10(p.adjust).
Page: 1 2 3 4 5 6 7 8 9 

check button Enriched GO biological processes.
GO IDTissueDisease StageDescriptionGene RatioBg Ratiopvaluep.adjustCount
GO:0006839ColorectumADmitochondrial transport102/3918254/187231.87e-123.08e-10102
GO:1990542ColorectumADmitochondrial transmembrane transport47/3918102/187231.09e-086.52e-0747
GO:0062197ColorectumADcellular response to chemical stress109/3918337/187235.33e-071.95e-05109
GO:0051560ColorectumADmitochondrial calcium ion homeostasis13/391826/187239.41e-048.92e-0313
GO:0036444ColorectumADcalcium import into the mitochondrion8/391814/187233.23e-032.38e-028
GO:0006851ColorectumADmitochondrial calcium ion transmembrane transport10/391820/187233.67e-032.60e-0210
GO:0071472ColorectumADcellular response to salt stress7/391812/187235.09e-033.38e-027
GO:00068391ColorectumSERmitochondrial transport87/2897254/187237.91e-143.03e-1187
GO:19905421ColorectumSERmitochondrial transmembrane transport42/2897102/187233.65e-104.77e-0842
GO:00621971ColorectumSERcellular response to chemical stress87/2897337/187235.33e-072.59e-0587
GO:00068511ColorectumSERmitochondrial calcium ion transmembrane transport10/289720/187233.20e-045.15e-0310
GO:00364441ColorectumSERcalcium import into the mitochondrion8/289714/187234.06e-046.07e-038
GO:00515601ColorectumSERmitochondrial calcium ion homeostasis11/289726/187239.60e-041.15e-0211
GO:0051561ColorectumSERpositive regulation of mitochondrial calcium ion concentration6/289711/187233.12e-032.70e-026
GO:0006970ColorectumSERresponse to osmotic stress23/289784/187233.61e-033.03e-0223
GO:00714721ColorectumSERcellular response to salt stress6/289712/187235.42e-034.03e-026
GO:00068392ColorectumMSSmitochondrial transport93/3467254/187236.14e-129.82e-1093
GO:00621972ColorectumMSScellular response to chemical stress102/3467337/187239.73e-084.71e-06102
GO:19905422ColorectumMSSmitochondrial transmembrane transport41/3467102/187232.70e-071.11e-0541
GO:00515602ColorectumMSSmitochondrial calcium ion homeostasis12/346726/187231.16e-031.12e-0212
Page: 1 2 3 4 5 6 7 8 

check button Enriched KEGG pathways.
Pathway IDTissueDisease StageDescriptionGene RatioBg Ratiopvaluep.adjustqvalueCount
Page: 1 

Top

Cell-cell communication analysis

check buttonIdentification of potential cell-cell interactions between two cell types and their ligand-receptor pairs for different disease states
LigandReceptorLRpairPathwayTissueDisease Stage
Page: 1 

Top

Single-cell gene regulatory network inference analysis

check buttonFind out the significant the regulons (TFs) and the target genes of each regulon across cell types for different disease states
TFCell TypeTissueDisease StageTarget GeneRSSRegulon Activity
∗The dot plots of a searched regulon are shown for all cell subpopulations in each disease state of each tissue based on the regulon specific score inferred using pySCENIC and by calculating the average expression.
Page: 1 

Top

Somatic mutation of malignant transformation related genes

check buttonAnnotation of somatic variants for genes involved in malignant transformation
Hugo SymbolVariant ClassVariant ClassificationdbSNP RSHGVScHGVSpHGVSp ShortSWISSPROTBIOTYPESIFTPolyPhenTumor Sample BarcodeTissueHistologySexAgeStageTherapy TypesDrugsOutcome
MICU1SNVMissense_Mutationnovelc.395N>Ap.Ala132Aspp.A132DQ9BPX6protein_codingdeleterious(0)probably_damaging(0.997)TCGA-A2-A25A-01Breastbreast invasive carcinomaFemale<65I/IIUnspecificCytoxanSD
MICU1SNVMissense_Mutationnovelc.218N>Cp.Lys73Thrp.K73TQ9BPX6protein_codingtolerated_low_confidence(0.12)benign(0.001)TCGA-AN-A046-01Breastbreast invasive carcinomaFemale>=65I/IIUnknownUnknownSD
MICU1SNVMissense_Mutationrs754124319c.523C>Tp.Arg175Cysp.R175CQ9BPX6protein_codingdeleterious(0)probably_damaging(0.917)TCGA-D8-A1XK-01Breastbreast invasive carcinomaFemale<65I/IIChemotherapydoxorubicine+cyclophosphamideSD
MICU1SNVMissense_Mutationc.232G>Cp.Asp78Hisp.D78HQ9BPX6protein_codingdeleterious(0.03)benign(0)TCGA-EW-A6SD-01Breastbreast invasive carcinomaFemale<65I/IIChemotherapytchSD
MICU1SNVMissense_Mutationnovelc.23N>Tp.Ser8Phep.S8FQ9BPX6protein_codingdeleterious_low_confidence(0.03)benign(0.365)TCGA-PE-A5DC-01Breastbreast invasive carcinomaFemale>=65III/IVUnknownUnknownSD
MICU1deletionFrame_Shift_Delnovelc.721delNp.Glu241LysfsTer47p.E241Kfs*47Q9BPX6protein_codingTCGA-BH-A1EN-01Breastbreast invasive carcinomaFemale>=65I/IIUnknownUnknownSD
MICU1SNVMissense_Mutationrs367648335c.775C>Tp.Arg259Cysp.R259CQ9BPX6protein_codingdeleterious(0.01)probably_damaging(0.999)TCGA-VS-A9UI-01Cervixcervical & endocervical cancerFemale>=65I/IIUnknownUnknownSD
MICU1SNVMissense_Mutationrs752729268c.524N>Ap.Arg175Hisp.R175HQ9BPX6protein_codingdeleterious(0.04)benign(0.072)TCGA-AA-3949-01Colorectumcolon adenocarcinomaFemale>=65III/IVUnknownUnknownSD
MICU1SNVMissense_Mutationc.451N>Tp.Asp151Tyrp.D151YQ9BPX6protein_codingdeleterious(0)probably_damaging(1)TCGA-AZ-4616-01Colorectumcolon adenocarcinomaFemale>=65III/IVChemotherapyxelodaPD
MICU1SNVMissense_Mutationrs750157034c.776N>Ap.Arg259Hisp.R259HQ9BPX6protein_codingdeleterious(0)probably_damaging(0.993)TCGA-AZ-6601-01Colorectumcolon adenocarcinomaMale>=65I/IIUnknownUnknownPD
Page: 1 2 3 4 5 

Top

Related drugs of malignant transformation related genes

check buttonIdentification of chemicals and drugs interact with genes involved in malignant transfromation
(DGIdb 4.0)
Entrez IDSymbolCategoryInteraction TypesDrug Claim NameDrug NamePMIDs
10367MICU1TRANSPORTERALD-403EPTINEZUMAB
10367MICU1TRANSPORTERPF-4427429
Page: 1