
|
|||||
|
 | |
| |
| |
| |
| |
| |
|
Gene: MICB |
Gene summary for MICB |
| Gene information | Species | Human | Gene symbol | MICB | Gene ID | 4277 |
| Gene name | MHC class I polypeptide-related sequence B | |
| Gene Alias | PERB11.2 | |
| Cytomap | 6p21.33 | |
| Gene Type | protein-coding | GO ID | GO:0001775 | UniProtAcc | B4DUT9 |
Top |
Malignant transformation analysis |
| Identification of the aberrant gene expression in precancerous and cancerous lesions by comparing the gene expression of stem-like cells in diseased tissues with normal stem cells |
| Entrez ID | Symbol | Replicates | Species | Organ | Tissue | Adj P-value | Log2FC | Malignancy |
| 4277 | MICB | P4T-E | Human | Esophagus | ESCC | 2.92e-11 | 2.96e-01 | 0.1323 |
| 4277 | MICB | P5T-E | Human | Esophagus | ESCC | 1.96e-05 | 1.41e-01 | 0.1327 |
| 4277 | MICB | P8T-E | Human | Esophagus | ESCC | 7.90e-03 | 6.56e-02 | 0.0889 |
| 4277 | MICB | P21T-E | Human | Esophagus | ESCC | 3.72e-07 | 1.00e-01 | 0.1617 |
| 4277 | MICB | P23T-E | Human | Esophagus | ESCC | 5.26e-05 | 9.51e-02 | 0.108 |
| 4277 | MICB | P24T-E | Human | Esophagus | ESCC | 9.56e-08 | 1.74e-01 | 0.1287 |
| 4277 | MICB | P27T-E | Human | Esophagus | ESCC | 1.66e-02 | 9.49e-02 | 0.1055 |
| 4277 | MICB | P32T-E | Human | Esophagus | ESCC | 3.97e-04 | 1.23e-01 | 0.1666 |
| 4277 | MICB | P36T-E | Human | Esophagus | ESCC | 1.35e-03 | 1.50e-01 | 0.1187 |
| 4277 | MICB | P40T-E | Human | Esophagus | ESCC | 4.85e-03 | 1.54e-01 | 0.109 |
| 4277 | MICB | P47T-E | Human | Esophagus | ESCC | 4.17e-05 | 1.06e-01 | 0.1067 |
| 4277 | MICB | P49T-E | Human | Esophagus | ESCC | 2.60e-02 | 3.97e-01 | 0.1768 |
| 4277 | MICB | P52T-E | Human | Esophagus | ESCC | 7.98e-13 | 2.80e-01 | 0.1555 |
| 4277 | MICB | P54T-E | Human | Esophagus | ESCC | 9.33e-03 | 1.08e-01 | 0.0975 |
| 4277 | MICB | P74T-E | Human | Esophagus | ESCC | 3.15e-07 | 2.30e-01 | 0.1479 |
| 4277 | MICB | P75T-E | Human | Esophagus | ESCC | 4.17e-05 | 1.26e-01 | 0.1125 |
| 4277 | MICB | P80T-E | Human | Esophagus | ESCC | 9.62e-21 | 6.57e-01 | 0.155 |
| 4277 | MICB | P83T-E | Human | Esophagus | ESCC | 2.81e-14 | 4.42e-01 | 0.1738 |
| 4277 | MICB | P89T-E | Human | Esophagus | ESCC | 3.90e-10 | 4.51e-01 | 0.1752 |
| 4277 | MICB | P107T-E | Human | Esophagus | ESCC | 7.75e-04 | 9.48e-02 | 0.171 |
| Page: 1 2 |
| Tissue | Expression Dynamics | Abbreviation |
| Esophagus | 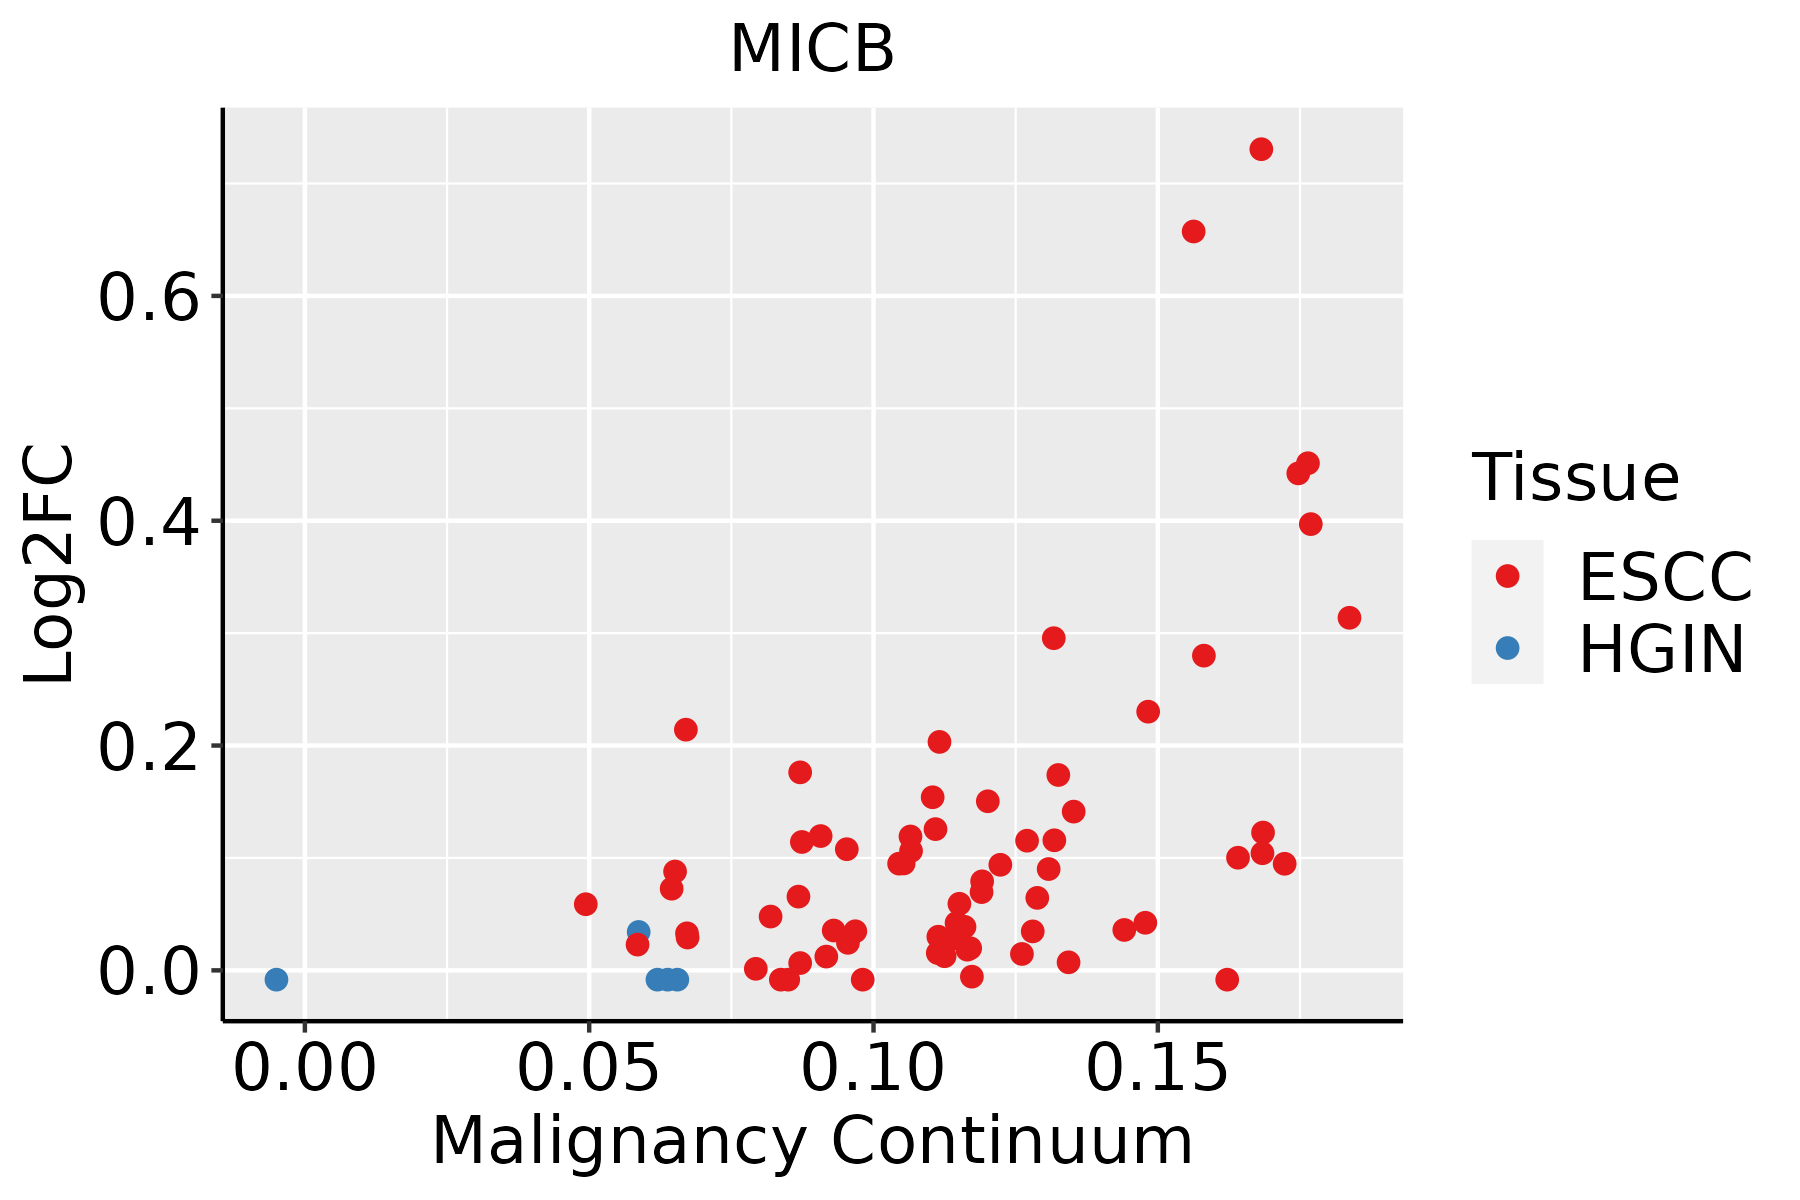 | ESCC: Esophageal squamous cell carcinoma |
| HGIN: High-grade intraepithelial neoplasias | ||
| LGIN: Low-grade intraepithelial neoplasias |
| ∗log2FC in expression of this searched gene in stem-like cells from each diseased tissue sample relative to stem-like cells in normal samples in each tissue plotted against the malignancy continuum. Samples are colored based on if they are from different disease stage. |
Top |
Malignant transformation related pathway analysis |
| Find out the enriched GO biological processes and KEGG pathways involved in transition from healthy to precancer to cancer |
| Tissue | Disease Stage | Enriched GO biological Processes |
| Colorectum | AD |  |
| Colorectum | SER |  |
| Colorectum | MSS |  |
| Colorectum | MSI-H |  |
| Colorectum | FAP |  |
| ∗Top 15 enriched GO BP terms are showed in the bar plot of each disease state in each tissue. Each row represents a significant GO biological process which is colored according to the -log10(p.adjust). |
| Page: 1 2 3 4 5 6 7 8 9 |
| GO ID | Tissue | Disease Stage | Description | Gene Ratio | Bg Ratio | pvalue | p.adjust | Count |
| GO:0006979111 | Esophagus | ESCC | response to oxidative stress | 303/8552 | 446/18723 | 7.15e-22 | 1.30e-19 | 303 |
| GO:000961518 | Esophagus | ESCC | response to virus | 238/8552 | 367/18723 | 6.65e-14 | 3.32e-12 | 238 |
| GO:00516075 | Esophagus | ESCC | defense response to virus | 171/8552 | 265/18723 | 3.91e-10 | 1.05e-08 | 171 |
| GO:01405465 | Esophagus | ESCC | defense response to symbiont | 171/8552 | 265/18723 | 3.91e-10 | 1.05e-08 | 171 |
| GO:0009408110 | Esophagus | ESCC | response to heat | 77/8552 | 110/18723 | 2.01e-07 | 3.11e-06 | 77 |
| GO:00028318 | Esophagus | ESCC | regulation of response to biotic stimulus | 191/8552 | 327/18723 | 2.12e-06 | 2.45e-05 | 191 |
| GO:000283212 | Esophagus | ESCC | negative regulation of response to biotic stimulus | 72/8552 | 108/18723 | 8.36e-06 | 8.11e-05 | 72 |
| GO:000926619 | Esophagus | ESCC | response to temperature stimulus | 106/8552 | 178/18723 | 1.30e-04 | 8.84e-04 | 106 |
| GO:00507775 | Esophagus | ESCC | negative regulation of immune response | 112/8552 | 194/18723 | 4.67e-04 | 2.62e-03 | 112 |
| GO:00506884 | Esophagus | ESCC | regulation of defense response to virus | 45/8552 | 69/18723 | 8.26e-04 | 4.27e-03 | 45 |
| GO:000268316 | Esophagus | ESCC | negative regulation of immune system process | 231/8552 | 434/18723 | 8.48e-04 | 4.36e-03 | 231 |
| GO:004211018 | Esophagus | ESCC | T cell activation | 256/8552 | 487/18723 | 1.18e-03 | 5.87e-03 | 256 |
| GO:00506871 | Esophagus | ESCC | negative regulation of defense response to virus | 18/8552 | 24/18723 | 3.43e-03 | 1.41e-02 | 18 |
| GO:00325261 | Esophagus | ESCC | response to retinoic acid | 63/8552 | 107/18723 | 4.05e-03 | 1.62e-02 | 63 |
| Page: 1 |
| Pathway ID | Tissue | Disease Stage | Description | Gene Ratio | Bg Ratio | pvalue | p.adjust | qvalue | Count |
| hsa05167211 | Esophagus | ESCC | Kaposi sarcoma-associated herpesvirus infection | 136/4205 | 194/8465 | 4.28e-09 | 4.22e-08 | 2.16e-08 | 136 |
| hsa0516738 | Esophagus | ESCC | Kaposi sarcoma-associated herpesvirus infection | 136/4205 | 194/8465 | 4.28e-09 | 4.22e-08 | 2.16e-08 | 136 |
| Page: 1 |
Top |
Cell-cell communication analysis |
| Identification of potential cell-cell interactions between two cell types and their ligand-receptor pairs for different disease states |
| Ligand | Receptor | LRpair | Pathway | Tissue | Disease Stage |
| Page: 1 |
Top |
Single-cell gene regulatory network inference analysis |
| Find out the significant the regulons (TFs) and the target genes of each regulon across cell types for different disease states |
| TF | Cell Type | Tissue | Disease Stage | Target Gene | RSS | Regulon Activity |
| ∗The dot plots of a searched regulon are shown for all cell subpopulations in each disease state of each tissue based on the regulon specific score inferred using pySCENIC and by calculating the average expression. |
| Page: 1 |
Top |
Somatic mutation of malignant transformation related genes |
| Annotation of somatic variants for genes involved in malignant transformation |
| Hugo Symbol | Variant Class | Variant Classification | dbSNP RS | HGVSc | HGVSp | HGVSp Short | SWISSPROT | BIOTYPE | SIFT | PolyPhen | Tumor Sample Barcode | Tissue | Histology | Sex | Age | Stage | Therapy Types | Drugs | Outcome |
| MICB | SNV | Missense_Mutation | c.556G>C | p.Asp186His | p.D186H | protein_coding | deleterious(0.01) | possibly_damaging(0.868) | TCGA-AC-A23H-01 | Breast | breast invasive carcinoma | Female | >=65 | I/II | Unknown | Unknown | PD | ||
| MICB | SNV | Missense_Mutation | rs754021720 | c.523N>G | p.Lys175Glu | p.K175E | protein_coding | tolerated(0.18) | probably_damaging(0.999) | TCGA-AC-A6IW-01 | Breast | breast invasive carcinoma | Female | >=65 | I/II | Unknown | Unknown | SD | |
| MICB | SNV | Missense_Mutation | c.951N>A | p.Met317Ile | p.M317I | protein_coding | tolerated(0.42) | benign(0.066) | TCGA-BH-A0HF-01 | Breast | breast invasive carcinoma | Female | >=65 | I/II | Hormone Therapy | arimidex | SD | ||
| MICB | SNV | Missense_Mutation | novel | c.485N>T | p.Ala162Val | p.A162V | protein_coding | deleterious(0.04) | probably_damaging(0.995) | TCGA-AA-3984-01 | Colorectum | colon adenocarcinoma | Female | <65 | I/II | Unknown | Unknown | SD | |
| MICB | SNV | Missense_Mutation | rs775923426 | c.493N>A | p.Val165Ile | p.V165I | protein_coding | tolerated(1) | benign(0.006) | TCGA-NH-A50V-01 | Colorectum | colon adenocarcinoma | Male | >=65 | III/IV | Chemotherapy | fluorouracil | CR | |
| MICB | SNV | Missense_Mutation | rs760425014 | c.718N>T | p.Arg240Cys | p.R240C | protein_coding | tolerated(0.19) | probably_damaging(0.998) | TCGA-AG-A002-01 | Colorectum | rectum adenocarcinoma | Male | <65 | I/II | Unknown | Unknown | SD | |
| MICB | SNV | Missense_Mutation | c.502T>A | p.Phe168Ile | p.F168I | protein_coding | tolerated(0.42) | benign(0.44) | TCGA-AG-A01Y-01 | Colorectum | rectum adenocarcinoma | Female | <65 | I/II | Chemotherapy | 5-fluorouracil | CR | ||
| MICB | SNV | Missense_Mutation | novel | c.1055N>G | p.His352Arg | p.H352R | protein_coding | tolerated(0.38) | probably_damaging(0.964) | TCGA-A5-A0G2-01 | Endometrium | uterine corpus endometrioid carcinoma | Female | <65 | III/IV | Unknown | Unknown | SD | |
| MICB | SNV | Missense_Mutation | c.779G>T | p.Gly260Val | p.G260V | protein_coding | tolerated(0.17) | possibly_damaging(0.788) | TCGA-A5-A0GH-01 | Endometrium | uterine corpus endometrioid carcinoma | Female | <65 | I/II | Unknown | Unknown | SD | ||
| MICB | SNV | Missense_Mutation | novel | c.127N>C | p.Ser43Pro | p.S43P | protein_coding | tolerated(0.32) | probably_damaging(0.983) | TCGA-A5-A1OF-01 | Endometrium | uterine corpus endometrioid carcinoma | Female | <65 | I/II | Unknown | Unknown | SD |
| Page: 1 2 3 4 |
Top |
Related drugs of malignant transformation related genes |
| Identification of chemicals and drugs interact with genes involved in malignant transfromation |
| (DGIdb 4.0) |
| Entrez ID | Symbol | Category | Interaction Types | Drug Claim Name | Drug Name | PMIDs |
| 4277 | MICB | EXTERNAL SIDE OF PLASMA MEMBRANE, CELL SURFACE | peginterferon alfa-2a | |||
| 4277 | MICB | EXTERNAL SIDE OF PLASMA MEMBRANE, CELL SURFACE | ribavirin | RIBAVIRIN | ||
| 4277 | MICB | EXTERNAL SIDE OF PLASMA MEMBRANE, CELL SURFACE | peginterferon alfa-2b |
| Page: 1 |

Copyright 2023-Present -The University of Texas Health Science Center at Houston |