| Tissue | Expression Dynamics | Abbreviation |
| Cervix | 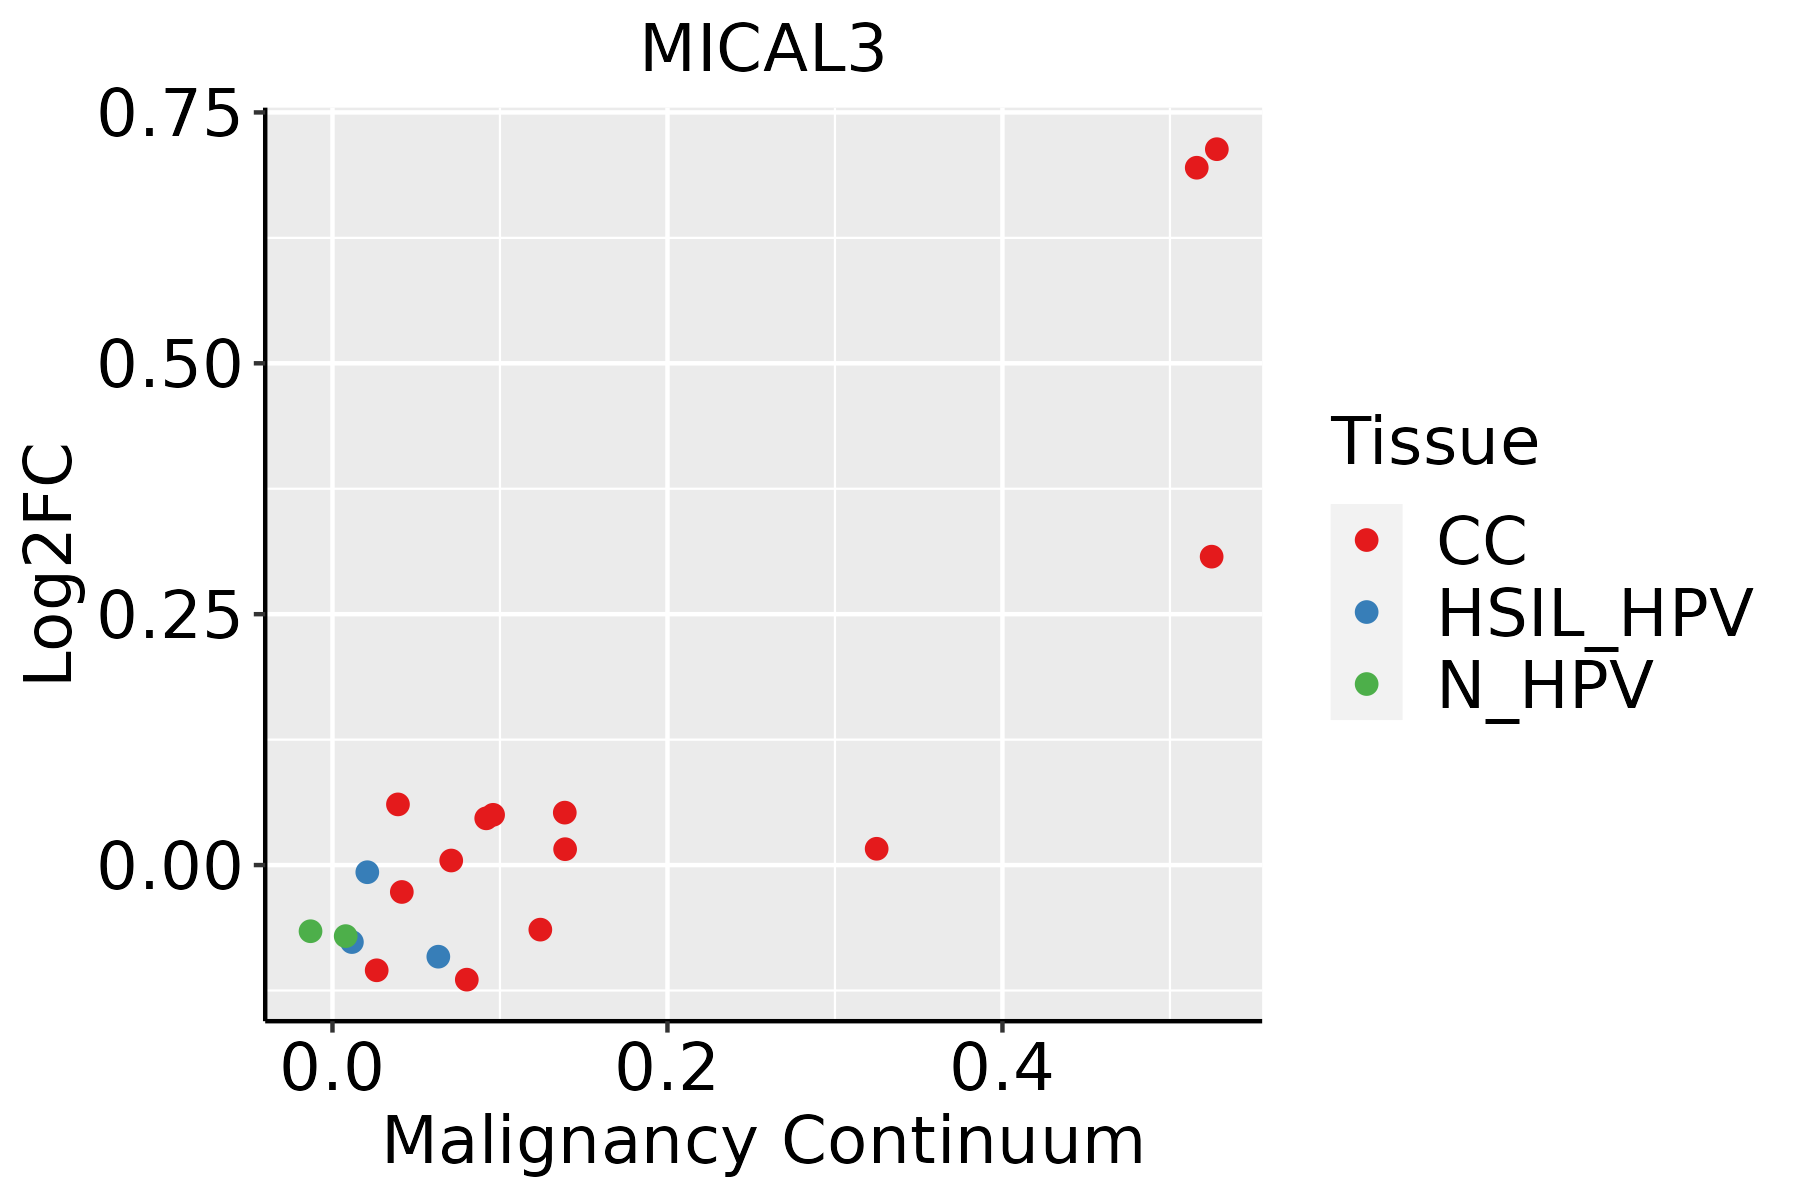 | CC: Cervix cancer |
| HSIL_HPV: HPV-infected high-grade squamous intraepithelial lesions |
| N_HPV: HPV-infected normal cervix |
| Colorectum (GSE201348) |  | FAP: Familial adenomatous polyposis |
| CRC: Colorectal cancer |
| Colorectum (HTA11) |  | AD: Adenomas |
| SER: Sessile serrated lesions |
| MSI-H: Microsatellite-high colorectal cancer |
| MSS: Microsatellite stable colorectal cancer |
| Endometrium | 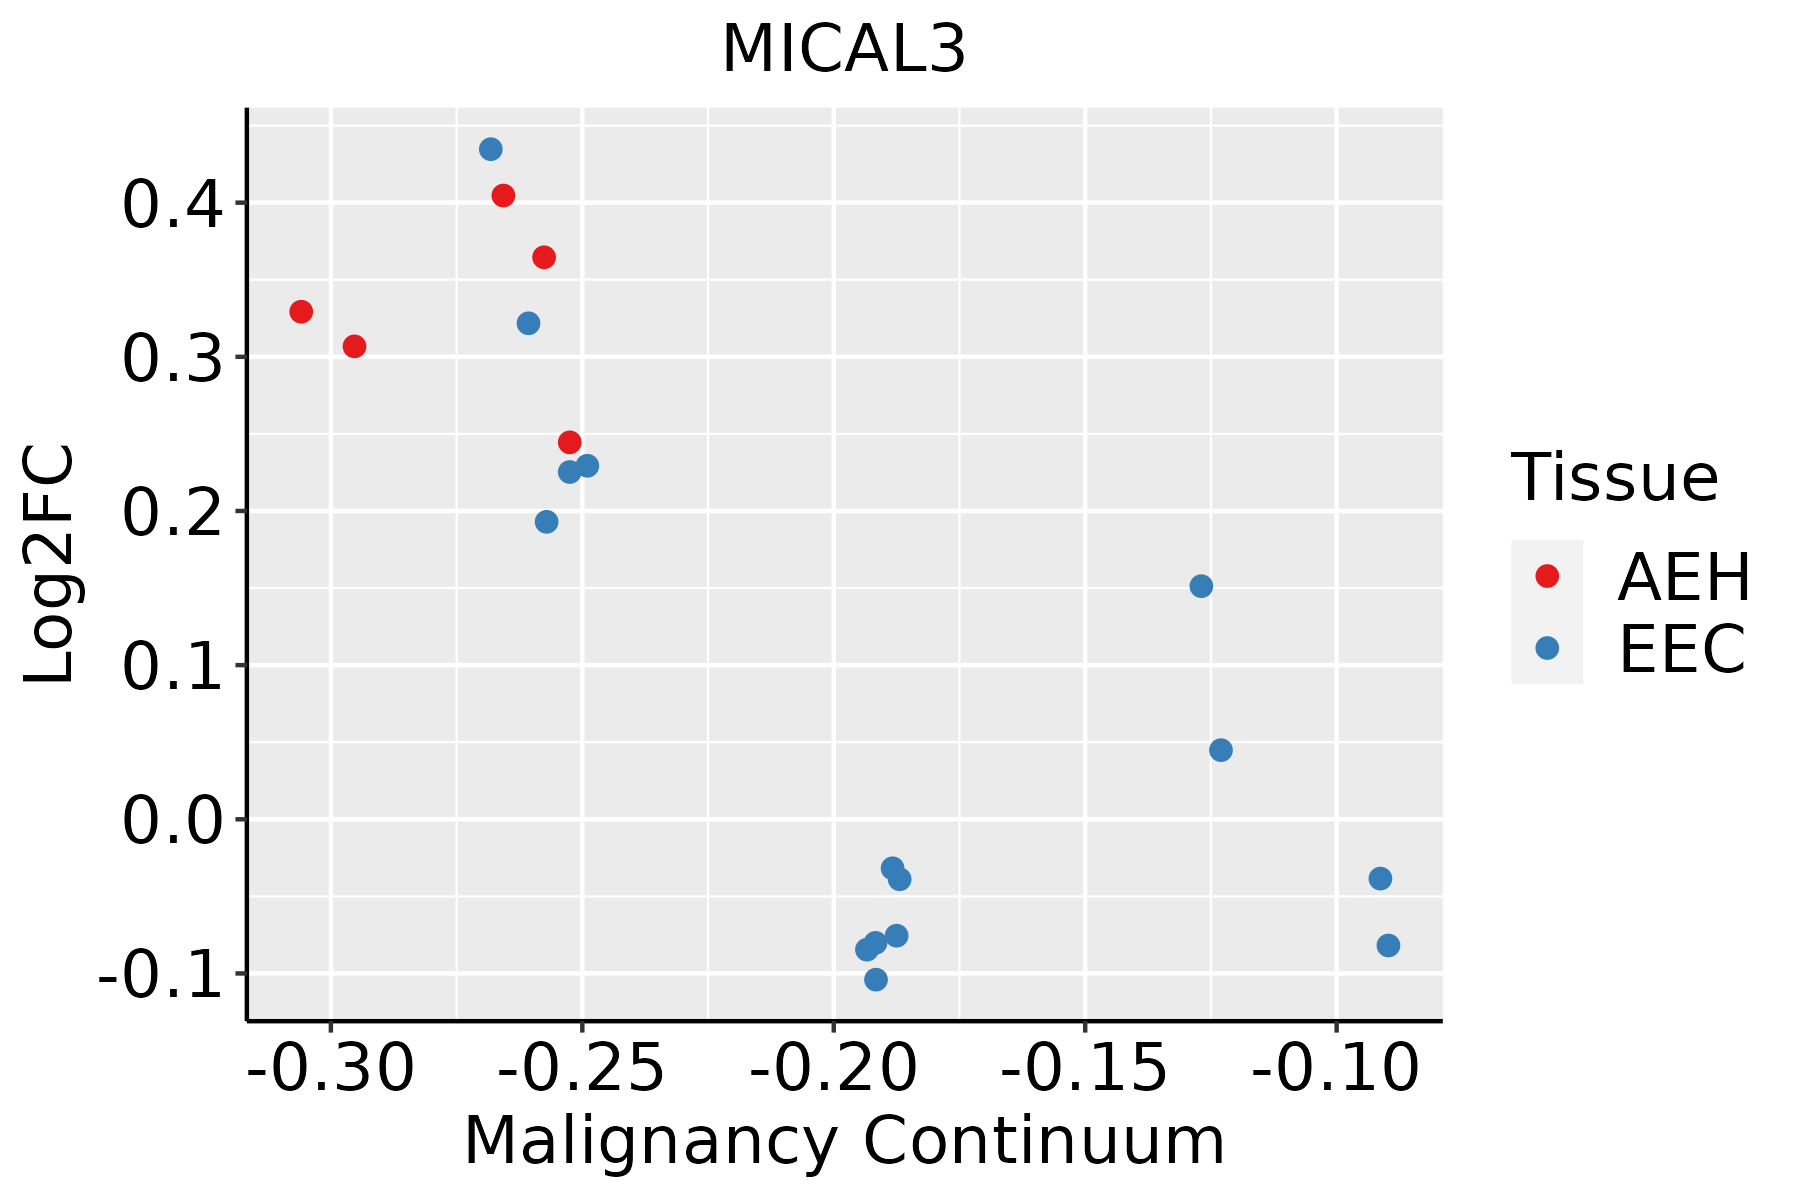 | AEH: Atypical endometrial hyperplasia |
| EEC: Endometrioid Cancer |
| Esophagus | 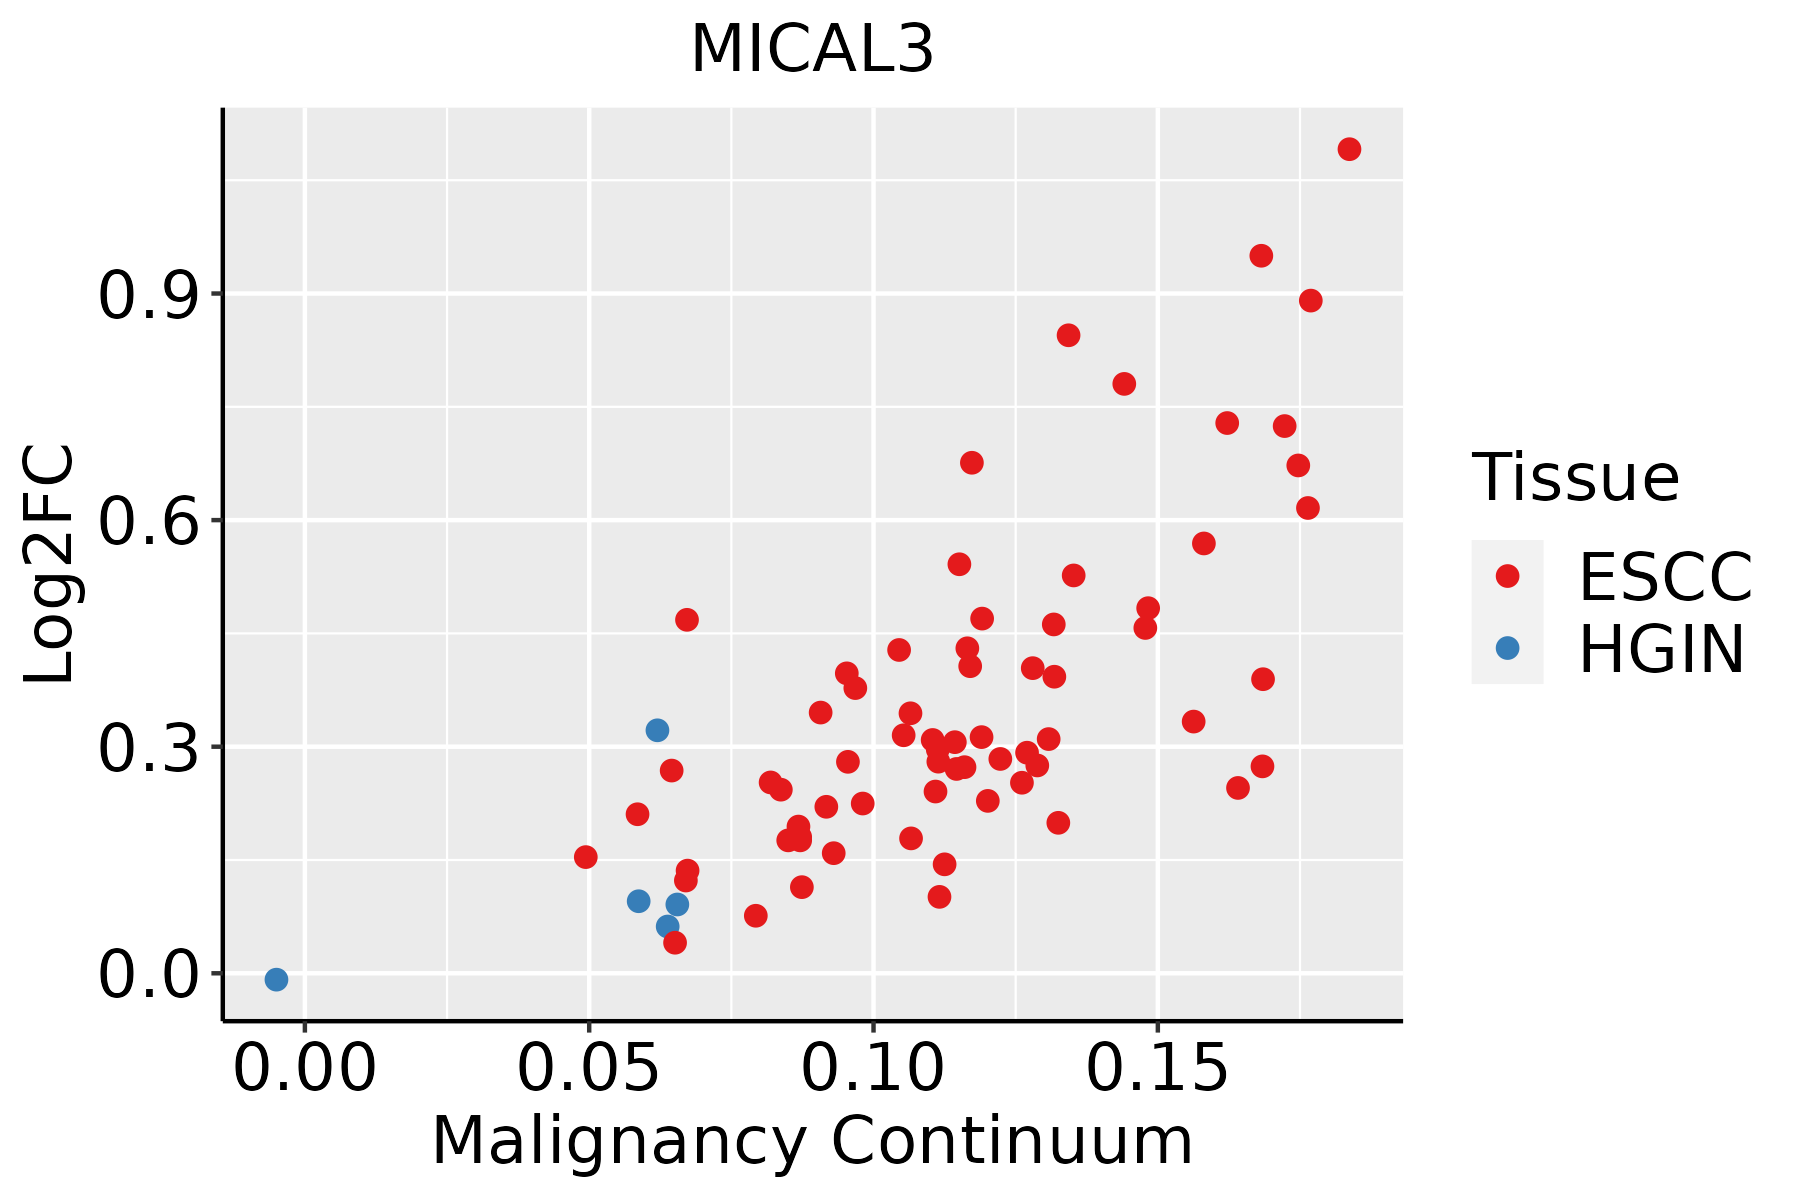 | ESCC: Esophageal squamous cell carcinoma |
| HGIN: High-grade intraepithelial neoplasias |
| LGIN: Low-grade intraepithelial neoplasias |
| Liver | 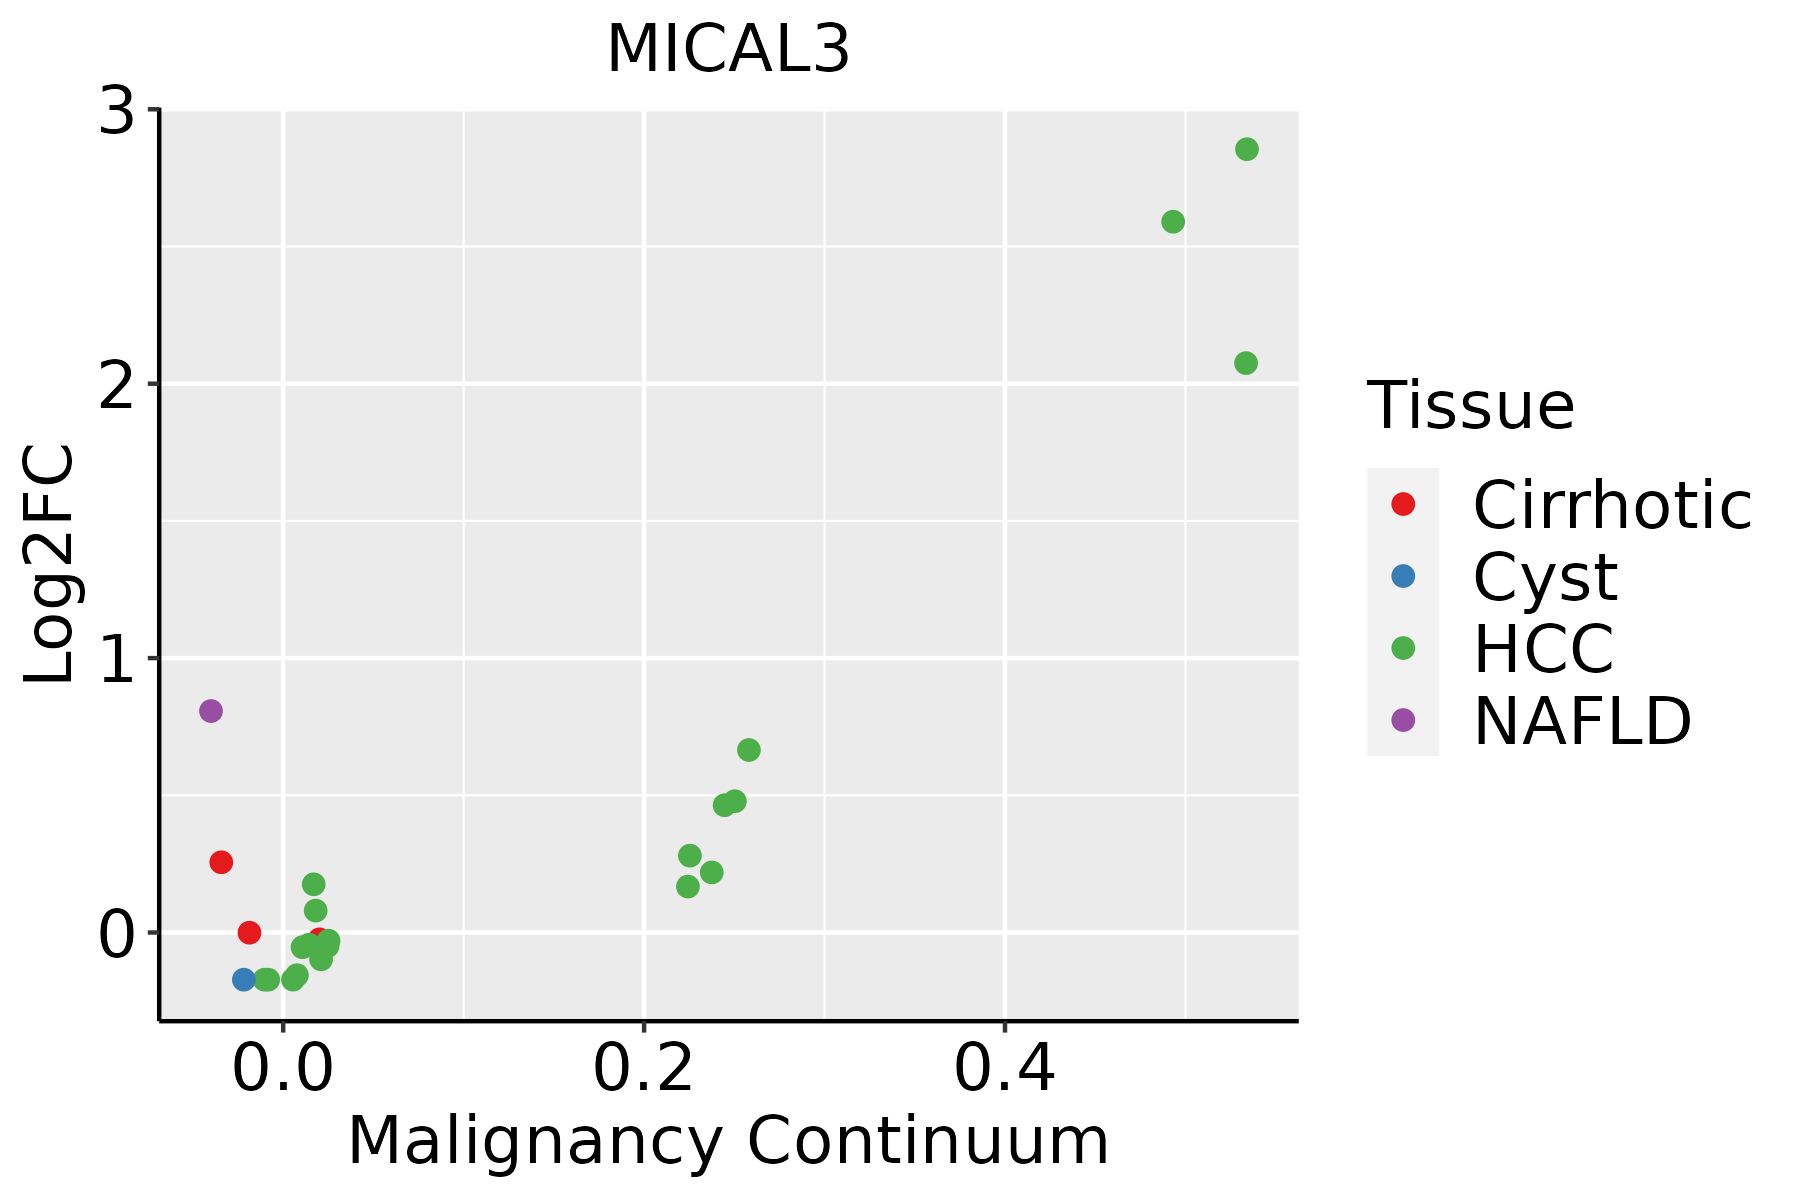 | HCC: Hepatocellular carcinoma |
| NAFLD: Non-alcoholic fatty liver disease |
| Prostate | 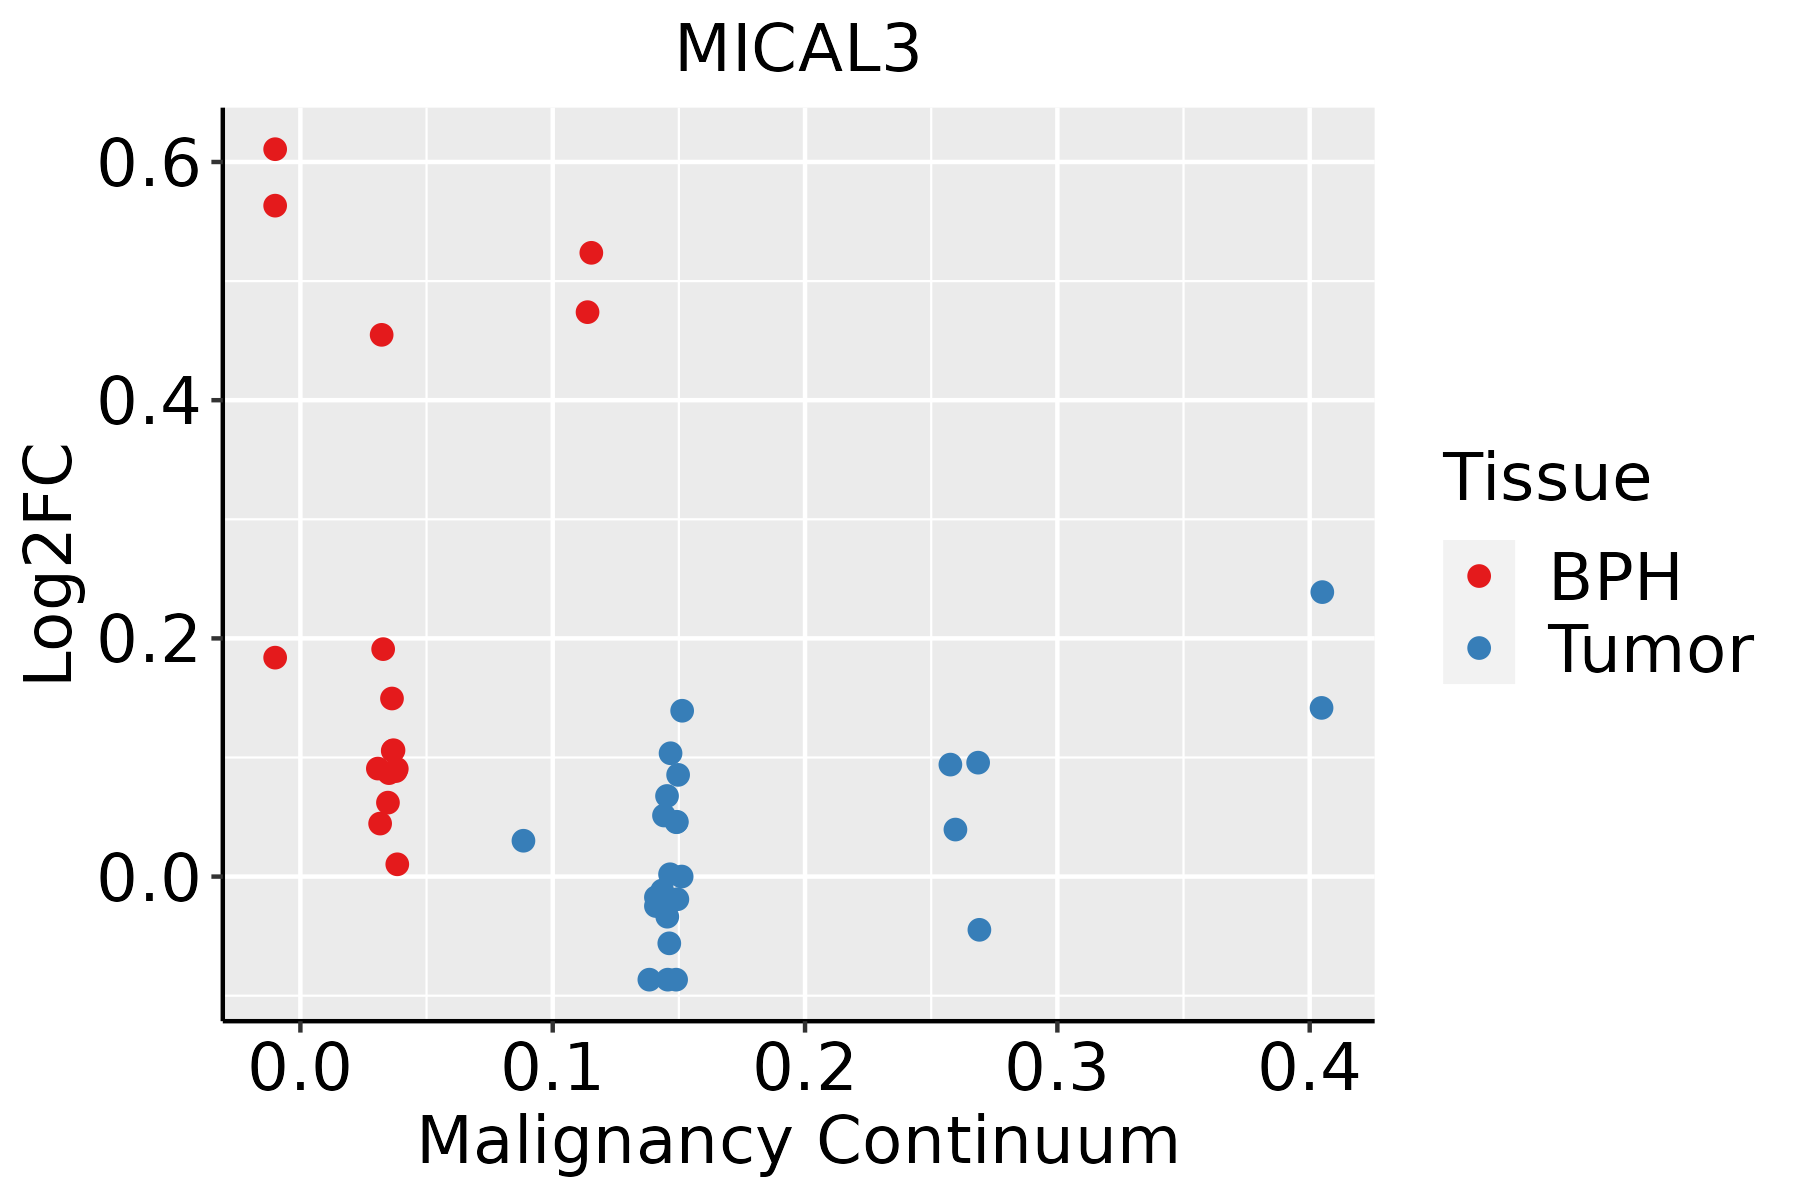 | BPH: Benign Prostatic Hyperplasia |
| Thyroid | 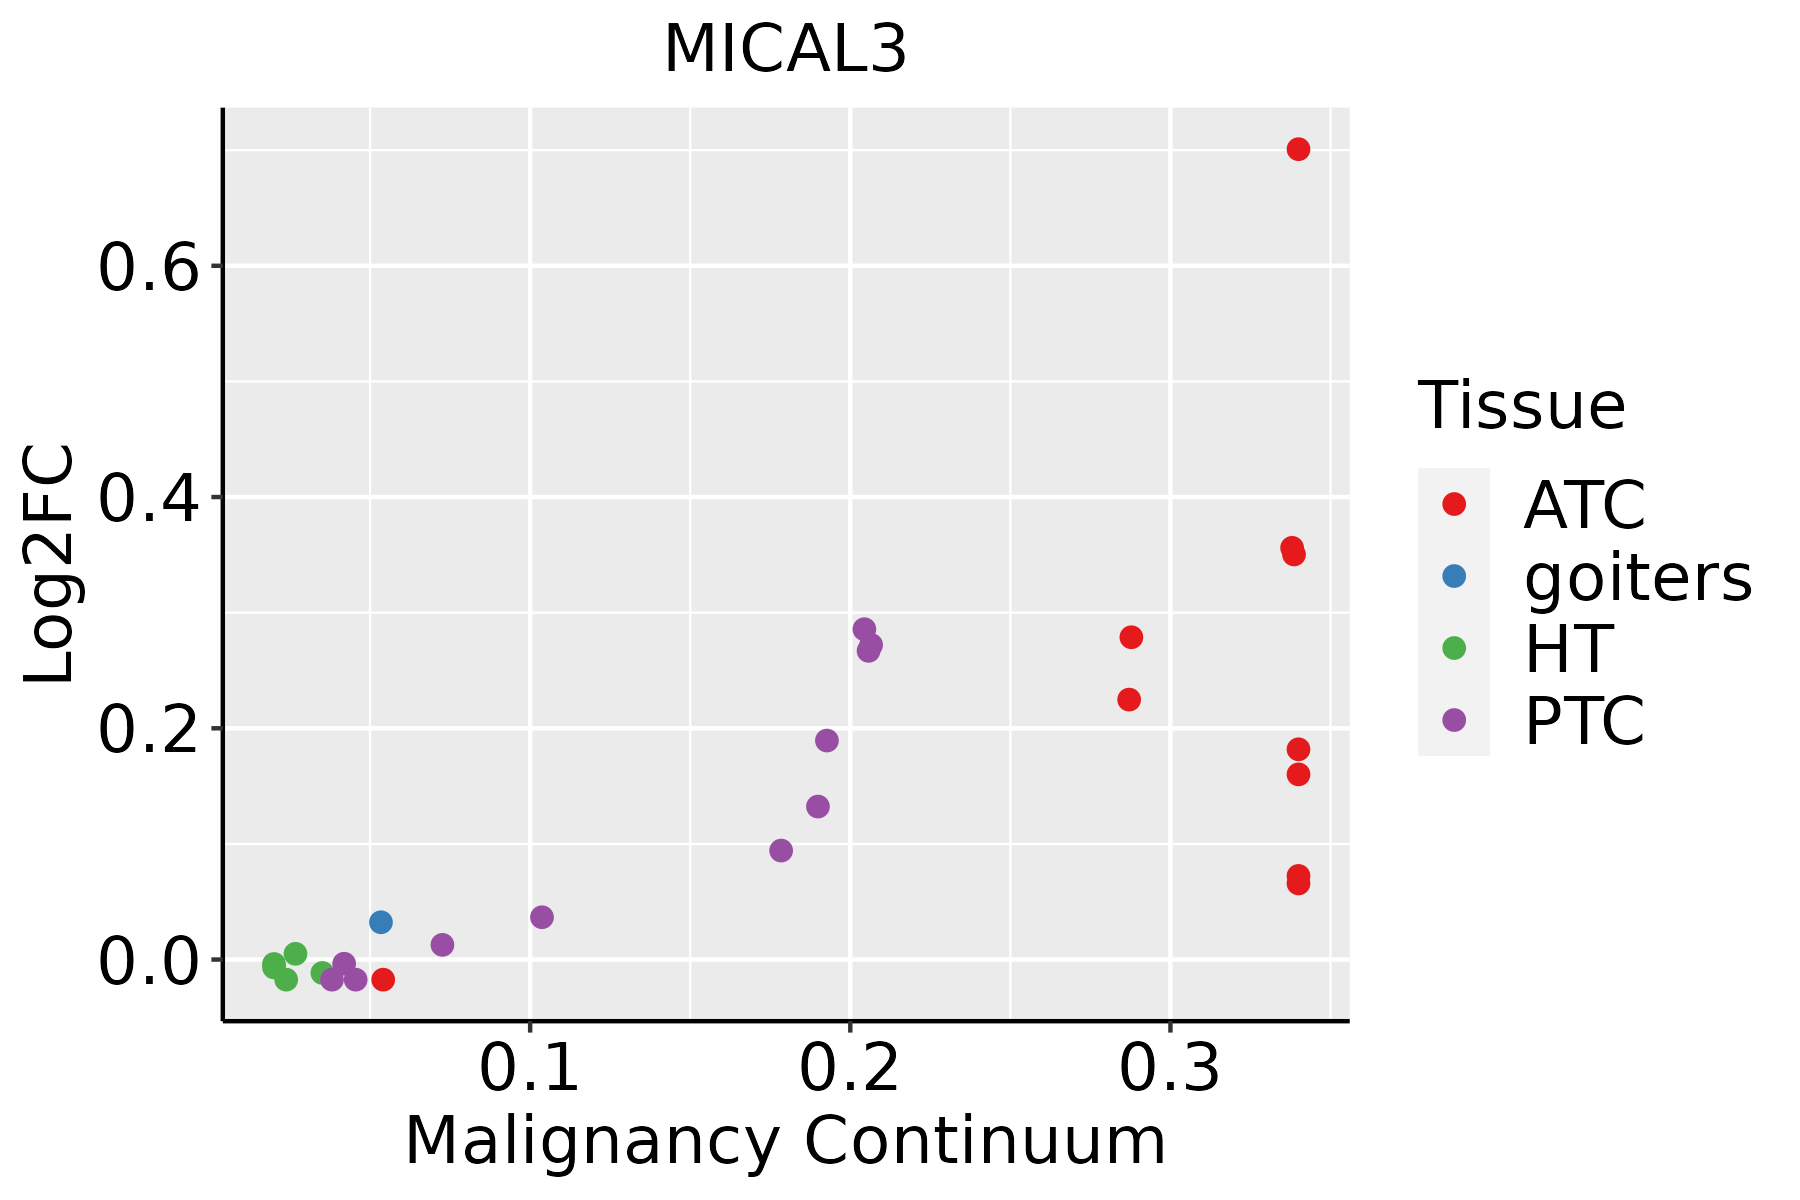 | ATC: Anaplastic thyroid cancer |
| HT: Hashimoto's thyroiditis |
| PTC: Papillary thyroid cancer |
| GO ID | Tissue | Disease Stage | Description | Gene Ratio | Bg Ratio | pvalue | p.adjust | Count |
| GO:000701510 | Cervix | CC | actin filament organization | 109/2311 | 442/18723 | 4.92e-13 | 2.45e-10 | 109 |
| GO:00081549 | Cervix | CC | actin polymerization or depolymerization | 51/2311 | 218/18723 | 4.05e-06 | 1.05e-04 | 51 |
| GO:002241110 | Cervix | CC | cellular component disassembly | 83/2311 | 443/18723 | 6.04e-05 | 8.68e-04 | 83 |
| GO:00329847 | Cervix | CC | protein-containing complex disassembly | 41/2311 | 224/18723 | 6.13e-03 | 3.48e-02 | 41 |
| GO:00068873 | Cervix | CC | exocytosis | 59/2311 | 352/18723 | 8.74e-03 | 4.48e-02 | 59 |
| GO:0007015 | Colorectum | AD | actin filament organization | 167/3918 | 442/18723 | 1.65e-16 | 7.94e-14 | 167 |
| GO:0008154 | Colorectum | AD | actin polymerization or depolymerization | 90/3918 | 218/18723 | 6.14e-12 | 8.23e-10 | 90 |
| GO:0022411 | Colorectum | AD | cellular component disassembly | 147/3918 | 443/18723 | 8.53e-10 | 6.76e-08 | 147 |
| GO:0032984 | Colorectum | AD | protein-containing complex disassembly | 81/3918 | 224/18723 | 9.41e-08 | 4.65e-06 | 81 |
| GO:0030042 | Colorectum | AD | actin filament depolymerization | 27/3918 | 59/18723 | 1.65e-05 | 3.47e-04 | 27 |
| GO:0043624 | Colorectum | AD | cellular protein complex disassembly | 45/3918 | 136/18723 | 6.24e-04 | 6.48e-03 | 45 |
| GO:0051261 | Colorectum | AD | protein depolymerization | 39/3918 | 114/18723 | 6.74e-04 | 6.91e-03 | 39 |
| GO:0006887 | Colorectum | AD | exocytosis | 96/3918 | 352/18723 | 2.48e-03 | 1.90e-02 | 96 |
| GO:00070152 | Colorectum | MSS | actin filament organization | 146/3467 | 442/18723 | 1.16e-13 | 2.67e-11 | 146 |
| GO:00081542 | Colorectum | MSS | actin polymerization or depolymerization | 79/3467 | 218/18723 | 4.14e-10 | 3.49e-08 | 79 |
| GO:00224112 | Colorectum | MSS | cellular component disassembly | 130/3467 | 443/18723 | 1.44e-08 | 8.46e-07 | 130 |
| GO:00329842 | Colorectum | MSS | protein-containing complex disassembly | 69/3467 | 224/18723 | 5.61e-06 | 1.50e-04 | 69 |
| GO:00300422 | Colorectum | MSS | actin filament depolymerization | 22/3467 | 59/18723 | 5.35e-04 | 6.02e-03 | 22 |
| GO:00070154 | Colorectum | FAP | actin filament organization | 125/2622 | 442/18723 | 1.97e-15 | 3.03e-12 | 125 |
| GO:00081544 | Colorectum | FAP | actin polymerization or depolymerization | 60/2622 | 218/18723 | 1.15e-07 | 7.43e-06 | 60 |
| Hugo Symbol | Variant Class | Variant Classification | dbSNP RS | HGVSc | HGVSp | HGVSp Short | SWISSPROT | BIOTYPE | SIFT | PolyPhen | Tumor Sample Barcode | Tissue | Histology | Sex | Age | Stage | Therapy Types | Drugs | Outcome |
| MICAL3 | SNV | Missense_Mutation | rs770532587 | c.2119N>G | p.Leu707Val | p.L707V | Q7RTP6 | protein_coding | tolerated_low_confidence(0.13) | benign(0.418) | TCGA-5L-AAT1-01 | Breast | breast invasive carcinoma | Female | <65 | III/IV | Hormone Therapy | letrozol | SD |
| MICAL3 | SNV | Missense_Mutation | novel | c.2977N>C | p.Glu993Gln | p.E993Q | Q7RTP6 | protein_coding | deleterious_low_confidence(0.04) | benign(0.422) | TCGA-AC-A5XS-01 | Breast | breast invasive carcinoma | Female | >=65 | I/II | Hormone Therapy | femara | SD |
| MICAL3 | SNV | Missense_Mutation | novel | c.755G>A | p.Arg252Gln | p.R252Q | Q7RTP6 | protein_coding | deleterious(0) | possibly_damaging(0.859) | TCGA-AN-A046-01 | Breast | breast invasive carcinoma | Female | >=65 | I/II | Unknown | Unknown | SD |
| MICAL3 | SNV | Missense_Mutation | | c.639N>T | p.Glu213Asp | p.E213D | Q7RTP6 | protein_coding | tolerated(0.2) | probably_damaging(0.97) | TCGA-AO-A03O-01 | Breast | breast invasive carcinoma | Female | >=65 | I/II | Chemotherapy | doxorubicin | SD |
| MICAL3 | SNV | Missense_Mutation | | c.4886N>T | p.Ala1629Val | p.A1629V | Q7RTP6 | protein_coding | tolerated_low_confidence(0.06) | benign(0.003) | TCGA-BH-A0AU-01 | Breast | breast invasive carcinoma | Female | <65 | I/II | Unknown | Unknown | SD |
| MICAL3 | SNV | Missense_Mutation | novel | c.3671N>C | p.Arg1224Pro | p.R1224P | Q7RTP6 | protein_coding | tolerated_low_confidence(0.1) | benign(0.301) | TCGA-BH-A0B6-01 | Breast | breast invasive carcinoma | Female | <65 | I/II | Unknown | Unknown | SD |
| MICAL3 | SNV | Missense_Mutation | | c.1432T>C | p.Phe478Leu | p.F478L | Q7RTP6 | protein_coding | tolerated(0.16) | benign(0.444) | TCGA-D8-A1XK-01 | Breast | breast invasive carcinoma | Female | <65 | I/II | Chemotherapy | doxorubicine+cyclophosphamide | SD |
| MICAL3 | SNV | Missense_Mutation | rs201688866 | c.4343N>T | p.Ser1448Leu | p.S1448L | Q7RTP6 | protein_coding | deleterious_low_confidence(0.01) | probably_damaging(0.988) | TCGA-EW-A3E8-01 | Breast | breast invasive carcinoma | Female | <65 | I/II | Hormone Therapy | anastrozole | SD |
| MICAL3 | SNV | Missense_Mutation | novel | c.3904N>C | p.Ser1302Arg | p.S1302R | Q7RTP6 | protein_coding | tolerated_low_confidence(0.05) | benign(0) | TCGA-OL-A5RW-01 | Breast | breast invasive carcinoma | Female | <65 | I/II | Chemotherapy | adriamycin | CR |
| MICAL3 | insertion | Frame_Shift_Ins | novel | c.421_422insTATCTAGAGATGGTCCT | p.Gly141ValfsTer30 | p.G141Vfs*30 | Q7RTP6 | protein_coding | | | TCGA-A8-A0A4-01 | Breast | breast invasive carcinoma | Female | >=65 | I/II | Hormone Therapy | tamoxiphen | CR |


