
|
|||||
|
 | |
| |
| |
| |
| |
| |
|
Gene: MICA |
Gene summary for MICA |
| Gene information | Species | Human | Gene symbol | MICA | Gene ID | 100507436 |
| Gene name | MHC class I polypeptide-related sequence A | |
| Gene Alias | MIC-A | |
| Cytomap | 6p21.33 | |
| Gene Type | protein-coding | GO ID | GO:0001775 | UniProtAcc | Q29983 |
Top |
Malignant transformation analysis |
| Identification of the aberrant gene expression in precancerous and cancerous lesions by comparing the gene expression of stem-like cells in diseased tissues with normal stem cells |
| Entrez ID | Symbol | Replicates | Species | Organ | Tissue | Adj P-value | Log2FC | Malignancy |
| 100507436 | MICA | LZE4T | Human | Esophagus | ESCC | 8.03e-12 | 3.00e-01 | 0.0811 |
| 100507436 | MICA | LZE7T | Human | Esophagus | ESCC | 3.10e-04 | 2.55e-01 | 0.0667 |
| 100507436 | MICA | LZE20T | Human | Esophagus | ESCC | 6.46e-04 | 1.02e-01 | 0.0662 |
| 100507436 | MICA | LZE24T | Human | Esophagus | ESCC | 1.06e-08 | 2.36e-01 | 0.0596 |
| 100507436 | MICA | LZE6T | Human | Esophagus | ESCC | 7.69e-06 | 4.79e-01 | 0.0845 |
| 100507436 | MICA | P1T-E | Human | Esophagus | ESCC | 1.82e-07 | 4.01e-01 | 0.0875 |
| 100507436 | MICA | P2T-E | Human | Esophagus | ESCC | 1.42e-19 | 2.92e-01 | 0.1177 |
| 100507436 | MICA | P4T-E | Human | Esophagus | ESCC | 2.68e-27 | 6.57e-01 | 0.1323 |
| 100507436 | MICA | P5T-E | Human | Esophagus | ESCC | 3.82e-18 | 4.93e-01 | 0.1327 |
| 100507436 | MICA | P8T-E | Human | Esophagus | ESCC | 2.40e-07 | 1.59e-01 | 0.0889 |
| 100507436 | MICA | P9T-E | Human | Esophagus | ESCC | 3.55e-02 | 1.20e-01 | 0.1131 |
| 100507436 | MICA | P10T-E | Human | Esophagus | ESCC | 6.24e-16 | 2.59e-01 | 0.116 |
| 100507436 | MICA | P11T-E | Human | Esophagus | ESCC | 3.38e-26 | 7.15e-01 | 0.1426 |
| 100507436 | MICA | P12T-E | Human | Esophagus | ESCC | 2.04e-11 | 2.48e-01 | 0.1122 |
| 100507436 | MICA | P15T-E | Human | Esophagus | ESCC | 3.00e-12 | 2.94e-01 | 0.1149 |
| 100507436 | MICA | P16T-E | Human | Esophagus | ESCC | 9.04e-14 | 2.33e-01 | 0.1153 |
| 100507436 | MICA | P17T-E | Human | Esophagus | ESCC | 1.07e-07 | 3.53e-01 | 0.1278 |
| 100507436 | MICA | P19T-E | Human | Esophagus | ESCC | 6.99e-04 | 3.13e-01 | 0.1662 |
| 100507436 | MICA | P20T-E | Human | Esophagus | ESCC | 3.46e-10 | 2.51e-01 | 0.1124 |
| 100507436 | MICA | P21T-E | Human | Esophagus | ESCC | 8.03e-20 | 5.56e-01 | 0.1617 |
| Page: 1 2 3 4 |
| Tissue | Expression Dynamics | Abbreviation |
| Esophagus | 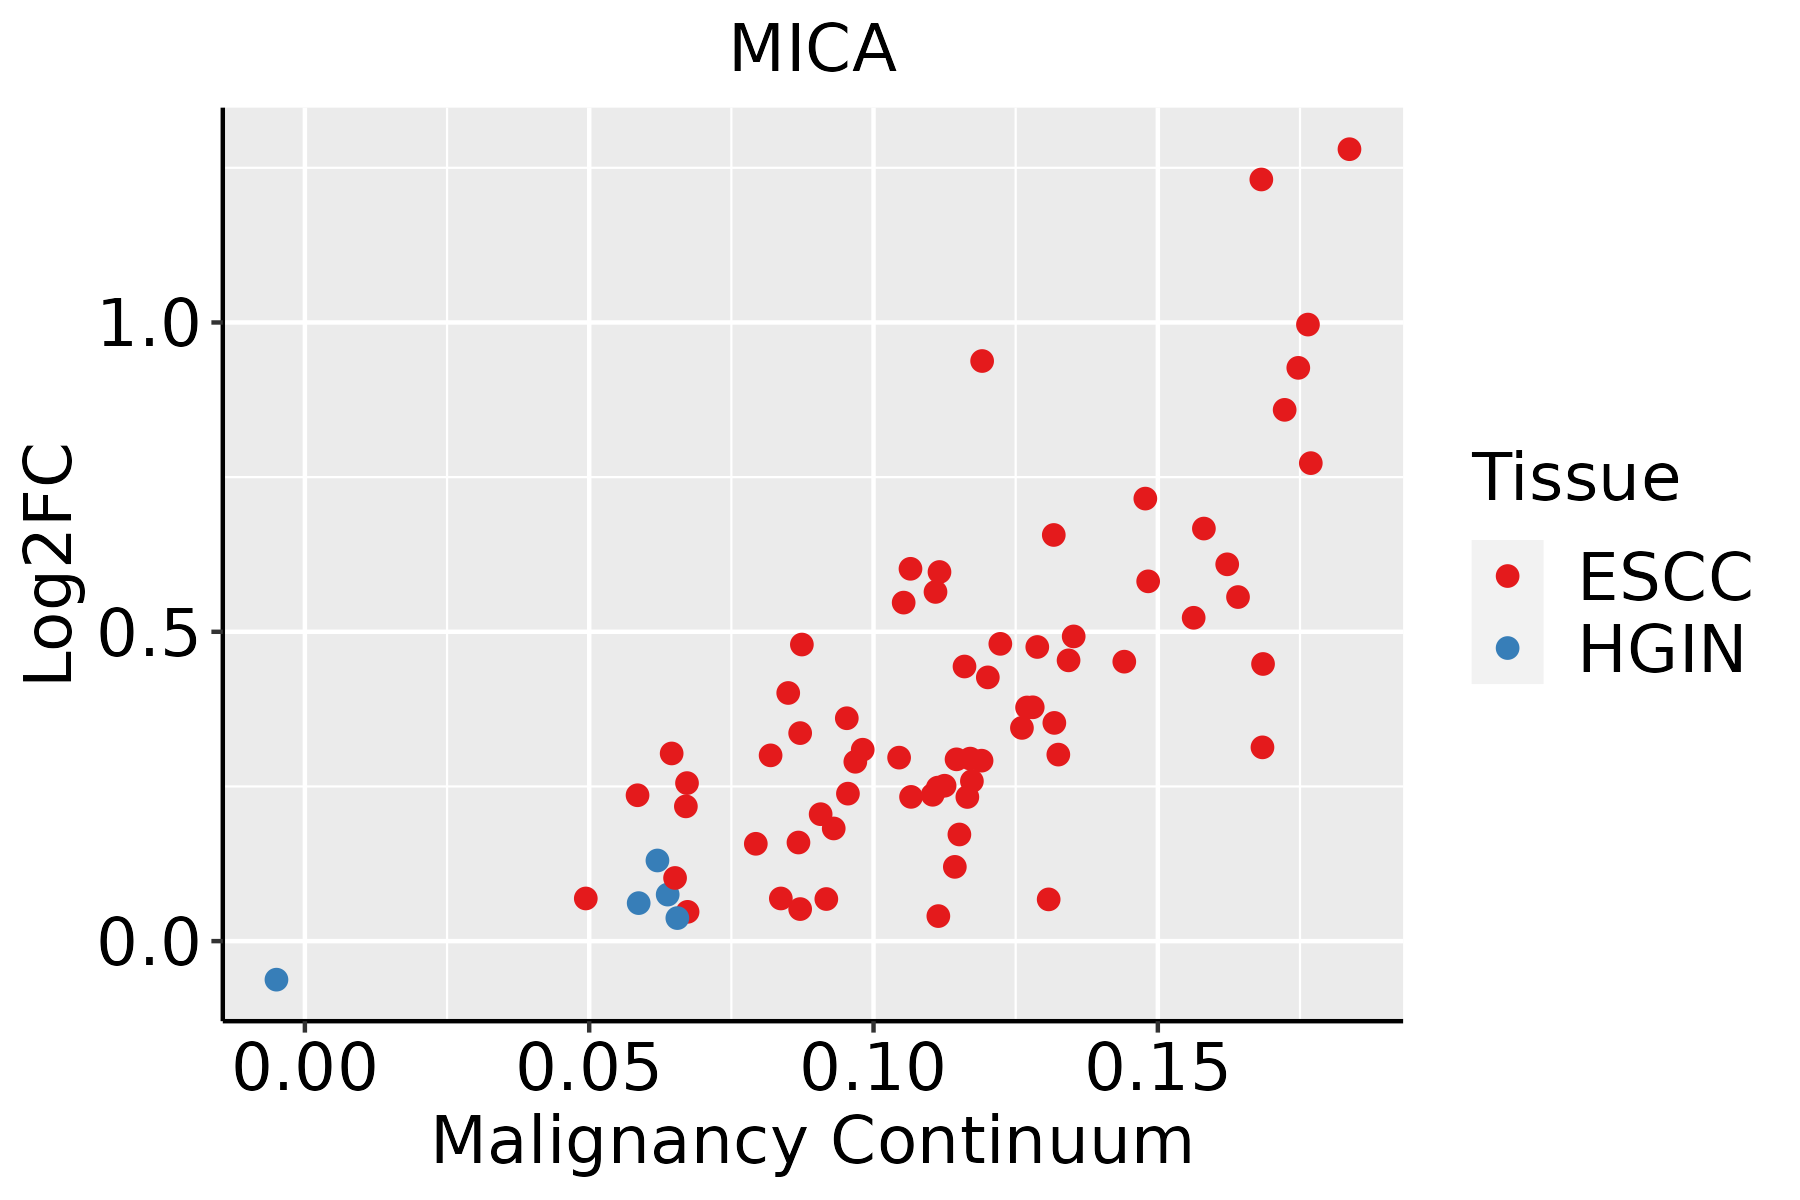 | ESCC: Esophageal squamous cell carcinoma |
| HGIN: High-grade intraepithelial neoplasias | ||
| LGIN: Low-grade intraepithelial neoplasias | ||
| Liver | 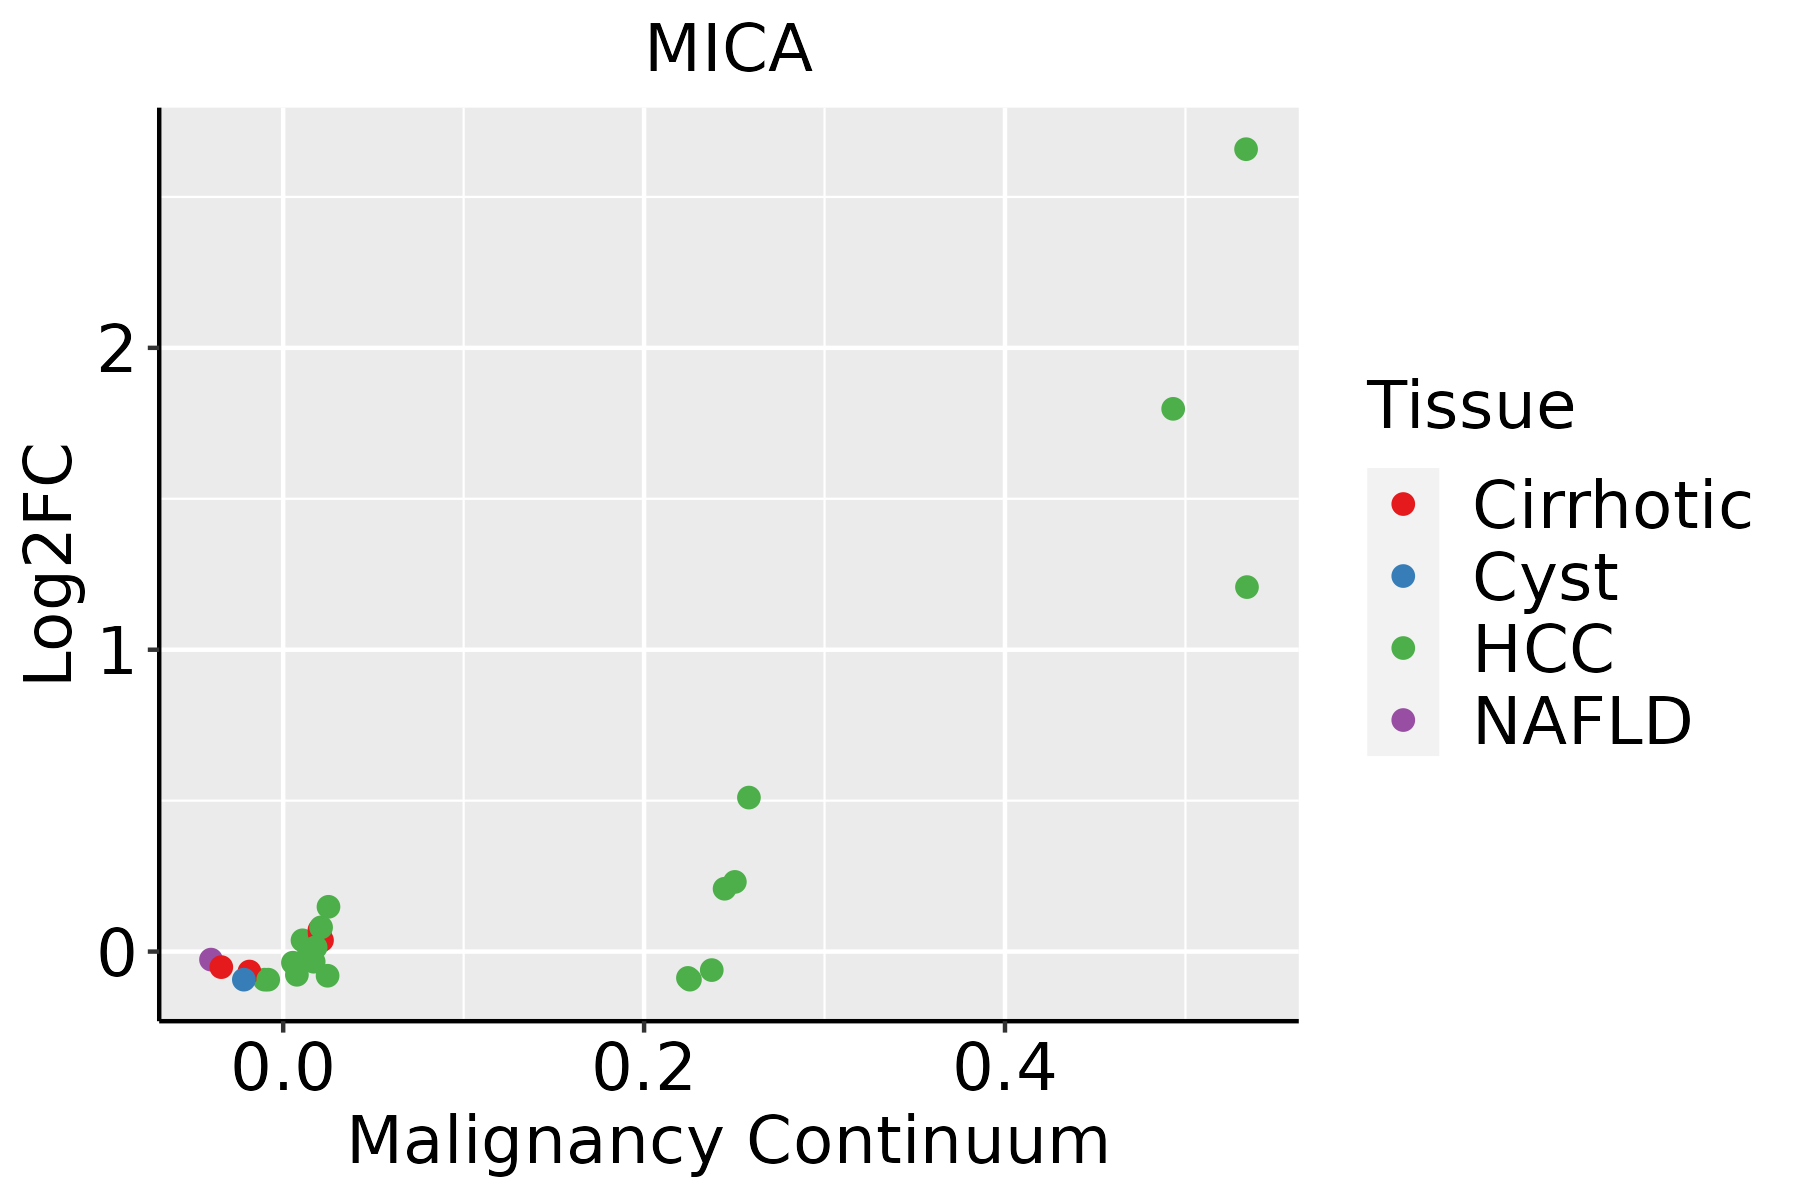 | HCC: Hepatocellular carcinoma |
| NAFLD: Non-alcoholic fatty liver disease | ||
| Oral Cavity | 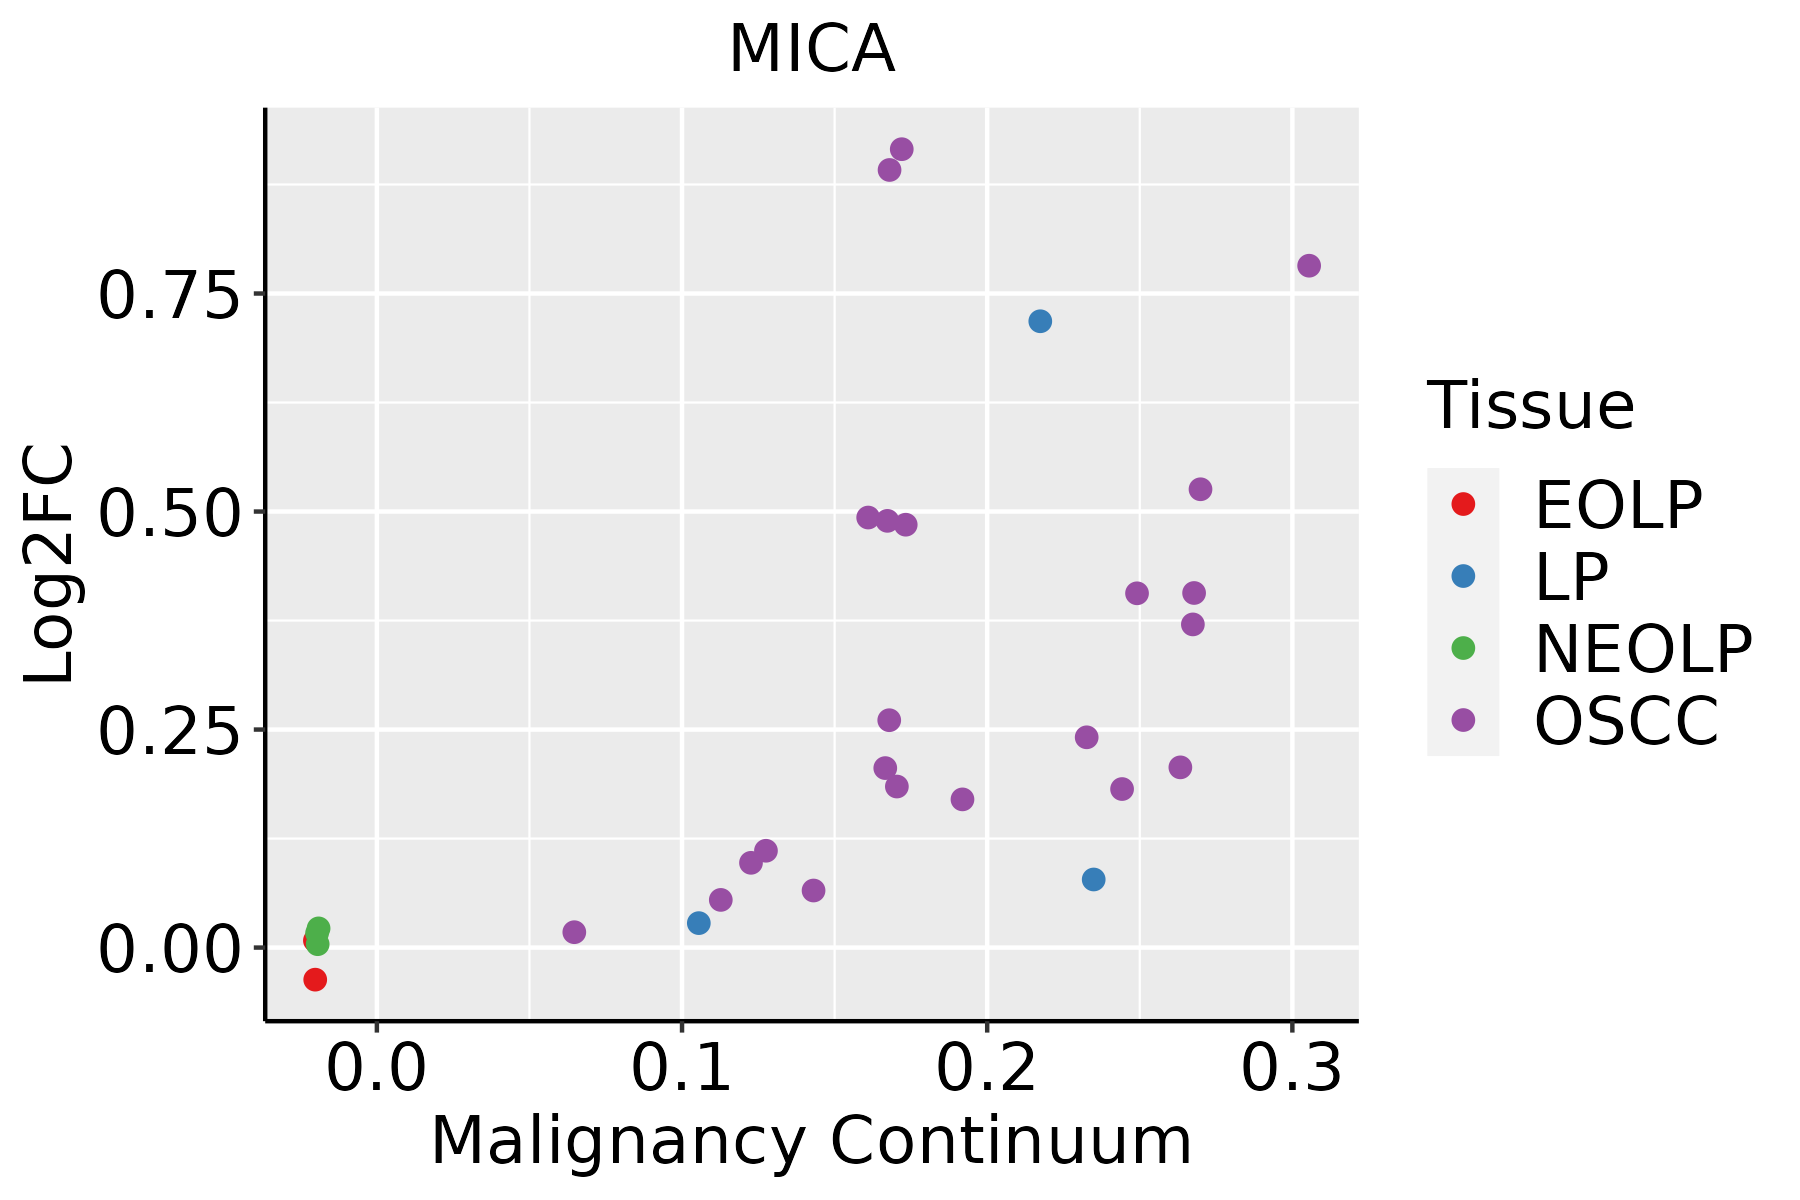 | EOLP: Erosive Oral lichen planus |
| LP: leukoplakia | ||
| NEOLP: Non-erosive oral lichen planus | ||
| OSCC: Oral squamous cell carcinoma |
| ∗log2FC in expression of this searched gene in stem-like cells from each diseased tissue sample relative to stem-like cells in normal samples in each tissue plotted against the malignancy continuum. Samples are colored based on if they are from different disease stage. |
Top |
Malignant transformation related pathway analysis |
| Find out the enriched GO biological processes and KEGG pathways involved in transition from healthy to precancer to cancer |
| Tissue | Disease Stage | Enriched GO biological Processes |
| Colorectum | AD |  |
| Colorectum | SER |  |
| Colorectum | MSS |  |
| Colorectum | MSI-H |  |
| Colorectum | FAP |  |
| ∗Top 15 enriched GO BP terms are showed in the bar plot of each disease state in each tissue. Each row represents a significant GO biological process which is colored according to the -log10(p.adjust). |
| Page: 1 2 3 4 5 6 7 8 9 |
| GO ID | Tissue | Disease Stage | Description | Gene Ratio | Bg Ratio | pvalue | p.adjust | Count |
| GO:000701510 | Cervix | CC | actin filament organization | 109/2311 | 442/18723 | 4.92e-13 | 2.45e-10 | 109 |
| GO:00081549 | Cervix | CC | actin polymerization or depolymerization | 51/2311 | 218/18723 | 4.05e-06 | 1.05e-04 | 51 |
| GO:002241110 | Cervix | CC | cellular component disassembly | 83/2311 | 443/18723 | 6.04e-05 | 8.68e-04 | 83 |
| GO:00329847 | Cervix | CC | protein-containing complex disassembly | 41/2311 | 224/18723 | 6.13e-03 | 3.48e-02 | 41 |
| GO:00068873 | Cervix | CC | exocytosis | 59/2311 | 352/18723 | 8.74e-03 | 4.48e-02 | 59 |
| GO:0007015 | Colorectum | AD | actin filament organization | 167/3918 | 442/18723 | 1.65e-16 | 7.94e-14 | 167 |
| GO:1903829 | Colorectum | AD | positive regulation of cellular protein localization | 110/3918 | 276/18723 | 4.58e-13 | 8.44e-11 | 110 |
| GO:0006839 | Colorectum | AD | mitochondrial transport | 102/3918 | 254/18723 | 1.87e-12 | 3.08e-10 | 102 |
| GO:0008154 | Colorectum | AD | actin polymerization or depolymerization | 90/3918 | 218/18723 | 6.14e-12 | 8.23e-10 | 90 |
| GO:0072594 | Colorectum | AD | establishment of protein localization to organelle | 148/3918 | 422/18723 | 7.95e-12 | 1.04e-09 | 148 |
| GO:0030041 | Colorectum | AD | actin filament polymerization | 81/3918 | 191/18723 | 1.35e-11 | 1.69e-09 | 81 |
| GO:0051258 | Colorectum | AD | protein polymerization | 112/3918 | 297/18723 | 1.85e-11 | 2.27e-09 | 112 |
| GO:0016197 | Colorectum | AD | endosomal transport | 90/3918 | 230/18723 | 1.88e-10 | 1.73e-08 | 90 |
| GO:0045216 | Colorectum | AD | cell-cell junction organization | 80/3918 | 200/18723 | 5.57e-10 | 4.58e-08 | 80 |
| GO:0022411 | Colorectum | AD | cellular component disassembly | 147/3918 | 443/18723 | 8.53e-10 | 6.76e-08 | 147 |
| GO:1904951 | Colorectum | AD | positive regulation of establishment of protein localization | 112/3918 | 319/18723 | 2.55e-09 | 1.80e-07 | 112 |
| GO:0051222 | Colorectum | AD | positive regulation of protein transport | 106/3918 | 303/18723 | 8.45e-09 | 5.08e-07 | 106 |
| GO:0034329 | Colorectum | AD | cell junction assembly | 136/3918 | 420/18723 | 2.02e-08 | 1.15e-06 | 136 |
| GO:0098876 | Colorectum | AD | vesicle-mediated transport to the plasma membrane | 57/3918 | 136/18723 | 2.30e-08 | 1.27e-06 | 57 |
| GO:0032984 | Colorectum | AD | protein-containing complex disassembly | 81/3918 | 224/18723 | 9.41e-08 | 4.65e-06 | 81 |
| Page: 1 2 3 4 5 6 7 8 9 10 11 12 13 14 15 16 17 18 19 20 21 22 23 24 25 26 27 28 29 |
| Pathway ID | Tissue | Disease Stage | Description | Gene Ratio | Bg Ratio | pvalue | p.adjust | qvalue | Count |
| hsa05167211 | Esophagus | ESCC | Kaposi sarcoma-associated herpesvirus infection | 136/4205 | 194/8465 | 4.28e-09 | 4.22e-08 | 2.16e-08 | 136 |
| hsa0516738 | Esophagus | ESCC | Kaposi sarcoma-associated herpesvirus infection | 136/4205 | 194/8465 | 4.28e-09 | 4.22e-08 | 2.16e-08 | 136 |
| hsa0516721 | Liver | HCC | Kaposi sarcoma-associated herpesvirus infection | 111/4020 | 194/8465 | 3.78e-03 | 1.16e-02 | 6.45e-03 | 111 |
| hsa0516731 | Liver | HCC | Kaposi sarcoma-associated herpesvirus infection | 111/4020 | 194/8465 | 3.78e-03 | 1.16e-02 | 6.45e-03 | 111 |
| hsa0516729 | Oral cavity | OSCC | Kaposi sarcoma-associated herpesvirus infection | 125/3704 | 194/8465 | 3.67e-09 | 3.84e-08 | 1.96e-08 | 125 |
| hsa05167113 | Oral cavity | OSCC | Kaposi sarcoma-associated herpesvirus infection | 125/3704 | 194/8465 | 3.67e-09 | 3.84e-08 | 1.96e-08 | 125 |
| Page: 1 |
Top |
Cell-cell communication analysis |
| Identification of potential cell-cell interactions between two cell types and their ligand-receptor pairs for different disease states |
| Ligand | Receptor | LRpair | Pathway | Tissue | Disease Stage |
| Page: 1 |
Top |
Single-cell gene regulatory network inference analysis |
| Find out the significant the regulons (TFs) and the target genes of each regulon across cell types for different disease states |
| TF | Cell Type | Tissue | Disease Stage | Target Gene | RSS | Regulon Activity |
| ∗The dot plots of a searched regulon are shown for all cell subpopulations in each disease state of each tissue based on the regulon specific score inferred using pySCENIC and by calculating the average expression. |
| Page: 1 |
Top |
Somatic mutation of malignant transformation related genes |
| Annotation of somatic variants for genes involved in malignant transformation |
| Hugo Symbol | Variant Class | Variant Classification | dbSNP RS | HGVSc | HGVSp | HGVSp Short | SWISSPROT | BIOTYPE | SIFT | PolyPhen | Tumor Sample Barcode | Tissue | Histology | Sex | Age | Stage | Therapy Types | Drugs | Outcome |
| MICA | SNV | Missense_Mutation | rs746669979 | c.173G>A | p.Arg58His | p.R58H | protein_coding | tolerated(1) | benign(0.009) | TCGA-A2-A1FW-01 | Breast | breast invasive carcinoma | Female | <65 | III/IV | Chemotherapy | cytoxan | SD | |
| MICA | SNV | Missense_Mutation | c.507G>C | p.Leu169Phe | p.L169F | protein_coding | tolerated(0.06) | possibly_damaging(0.624) | TCGA-AC-A23H-01 | Breast | breast invasive carcinoma | Female | >=65 | I/II | Unknown | Unknown | PD | ||
| MICA | insertion | Frame_Shift_Ins | novel | c.517_518insGAGAAGT | p.Ala173GlyfsTer89 | p.A173Gfs*89 | protein_coding | TCGA-AQ-A04J-01 | Breast | breast invasive carcinoma | Female | <65 | I/II | Chemotherapy | cytoxan | SD | |||
| MICA | insertion | Frame_Shift_Ins | novel | c.518_519insACTGCTGGGTGGGGGCAGGCTTG | p.Met174LeufsTer9 | p.M174Lfs*9 | protein_coding | TCGA-AQ-A04J-01 | Breast | breast invasive carcinoma | Female | <65 | I/II | Chemotherapy | cytoxan | SD | |||
| MICA | SNV | Missense_Mutation | c.360N>C | p.Glu120Asp | p.E120D | protein_coding | tolerated(0.05) | possibly_damaging(0.835) | TCGA-DG-A2KM-01 | Cervix | cervical & endocervical cancer | Female | <65 | I/II | Chemotherapy | cisplatin | SD | ||
| MICA | SNV | Missense_Mutation | novel | c.73N>T | p.Pro25Ser | p.P25S | protein_coding | tolerated(0.55) | possibly_damaging(0.887) | TCGA-AG-3892-01 | Colorectum | rectum adenocarcinoma | Female | <65 | I/II | Unknown | Unknown | SD | |
| MICA | SNV | Missense_Mutation | novel | c.982C>A | p.Leu328Ile | p.L328I | protein_coding | tolerated_low_confidence(0.13) | benign(0.052) | TCGA-F5-6814-01 | Colorectum | rectum adenocarcinoma | Male | <65 | I/II | Unknown | Unknown | SD | |
| MICA | SNV | Missense_Mutation | novel | c.98N>T | p.Thr33Met | p.T33M | protein_coding | deleterious(0.04) | benign(0.11) | TCGA-A5-A0G2-01 | Endometrium | uterine corpus endometrioid carcinoma | Female | <65 | III/IV | Unknown | Unknown | SD | |
| MICA | SNV | Missense_Mutation | novel | c.545N>A | p.Ala182Asp | p.A182D | protein_coding | tolerated(0.25) | possibly_damaging(0.887) | TCGA-AJ-A3BH-01 | Endometrium | uterine corpus endometrioid carcinoma | Female | Unknown | I/II | Unknown | Unknown | SD | |
| MICA | SNV | Missense_Mutation | novel | c.82C>T | p.Leu28Phe | p.L28F | protein_coding | deleterious(0.05) | probably_damaging(0.999) | TCGA-AJ-A3EK-01 | Endometrium | uterine corpus endometrioid carcinoma | Female | <65 | I/II | Chemotherapy | carboplatin | CR |
| Page: 1 2 3 |
Top |
Related drugs of malignant transformation related genes |
| Identification of chemicals and drugs interact with genes involved in malignant transfromation |
| (DGIdb 4.0) |
| Entrez ID | Symbol | Category | Interaction Types | Drug Claim Name | Drug Name | PMIDs |
| 100507436 | MICA | EXTERNAL SIDE OF PLASMA MEMBRANE, CELL SURFACE | HSP70 | 17911639 |
| Page: 1 |

Copyright 2023-Present -The University of Texas Health Science Center at Houston |