
|
|||||
|
 | |
| |
| |
| |
| |
| |
|
Gene: MIB2 |
Gene summary for MIB2 |
| Gene information | Species | Human | Gene symbol | MIB2 | Gene ID | 142678 |
| Gene name | MIB E3 ubiquitin protein ligase 2 | |
| Gene Alias | ZZANK1 | |
| Cytomap | 1p36.33 | |
| Gene Type | protein-coding | GO ID | GO:0006464 | UniProtAcc | Q96AX9 |
Top |
Malignant transformation analysis |
| Identification of the aberrant gene expression in precancerous and cancerous lesions by comparing the gene expression of stem-like cells in diseased tissues with normal stem cells |
| Entrez ID | Symbol | Replicates | Species | Organ | Tissue | Adj P-value | Log2FC | Malignancy |
| 142678 | MIB2 | LZE4T | Human | Esophagus | ESCC | 8.02e-16 | 6.42e-01 | 0.0811 |
| 142678 | MIB2 | LZE20T | Human | Esophagus | ESCC | 1.38e-11 | 5.93e-01 | 0.0662 |
| 142678 | MIB2 | LZE22T | Human | Esophagus | ESCC | 4.75e-10 | 1.04e+00 | 0.068 |
| 142678 | MIB2 | LZE24T | Human | Esophagus | ESCC | 2.28e-09 | 3.32e-01 | 0.0596 |
| 142678 | MIB2 | LZE21T | Human | Esophagus | ESCC | 2.23e-02 | 6.71e-01 | 0.0655 |
| 142678 | MIB2 | P1T-E | Human | Esophagus | ESCC | 1.27e-16 | 9.22e-01 | 0.0875 |
| 142678 | MIB2 | P2T-E | Human | Esophagus | ESCC | 1.91e-19 | 2.22e-01 | 0.1177 |
| 142678 | MIB2 | P4T-E | Human | Esophagus | ESCC | 5.62e-68 | 2.17e+00 | 0.1323 |
| 142678 | MIB2 | P5T-E | Human | Esophagus | ESCC | 1.24e-80 | 1.66e+00 | 0.1327 |
| 142678 | MIB2 | P8T-E | Human | Esophagus | ESCC | 5.21e-56 | 1.20e+00 | 0.0889 |
| 142678 | MIB2 | P9T-E | Human | Esophagus | ESCC | 2.56e-45 | 1.10e+00 | 0.1131 |
| 142678 | MIB2 | P10T-E | Human | Esophagus | ESCC | 1.30e-73 | 1.16e+00 | 0.116 |
| 142678 | MIB2 | P11T-E | Human | Esophagus | ESCC | 9.99e-03 | 3.39e-01 | 0.1426 |
| 142678 | MIB2 | P12T-E | Human | Esophagus | ESCC | 3.65e-15 | 1.73e-01 | 0.1122 |
| 142678 | MIB2 | P15T-E | Human | Esophagus | ESCC | 5.73e-67 | 1.57e+00 | 0.1149 |
| 142678 | MIB2 | P16T-E | Human | Esophagus | ESCC | 8.15e-12 | 6.83e-02 | 0.1153 |
| 142678 | MIB2 | P17T-E | Human | Esophagus | ESCC | 3.57e-17 | 7.76e-01 | 0.1278 |
| 142678 | MIB2 | P19T-E | Human | Esophagus | ESCC | 2.84e-06 | 1.43e+00 | 0.1662 |
| 142678 | MIB2 | P20T-E | Human | Esophagus | ESCC | 4.85e-81 | 1.87e+00 | 0.1124 |
| 142678 | MIB2 | P21T-E | Human | Esophagus | ESCC | 1.56e-61 | 1.30e+00 | 0.1617 |
| Page: 1 2 3 4 5 |
| Tissue | Expression Dynamics | Abbreviation |
| Colorectum (GSE201348) |  | FAP: Familial adenomatous polyposis |
| CRC: Colorectal cancer | ||
| Colorectum (HTA11) |  | AD: Adenomas |
| SER: Sessile serrated lesions | ||
| MSI-H: Microsatellite-high colorectal cancer | ||
| MSS: Microsatellite stable colorectal cancer | ||
| Esophagus | 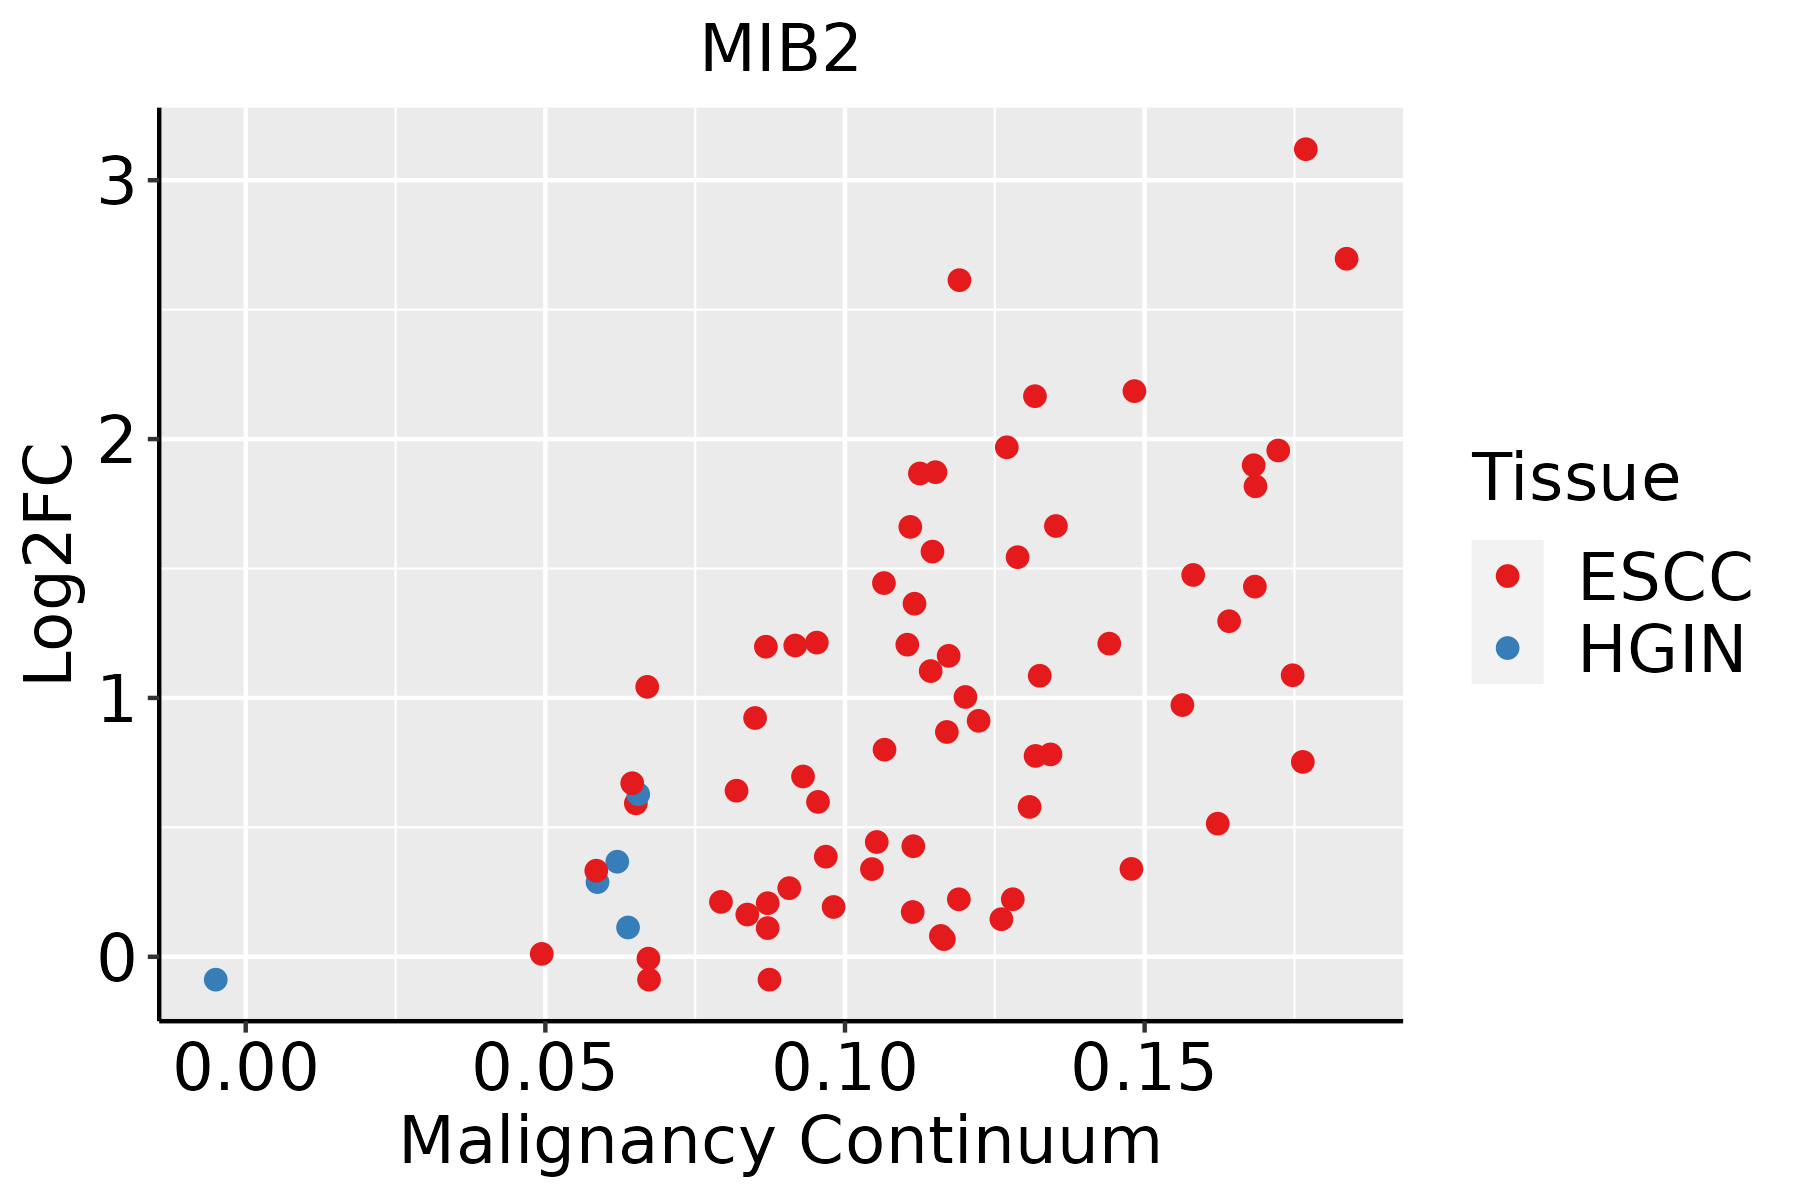 | ESCC: Esophageal squamous cell carcinoma |
| HGIN: High-grade intraepithelial neoplasias | ||
| LGIN: Low-grade intraepithelial neoplasias | ||
| Oral Cavity | 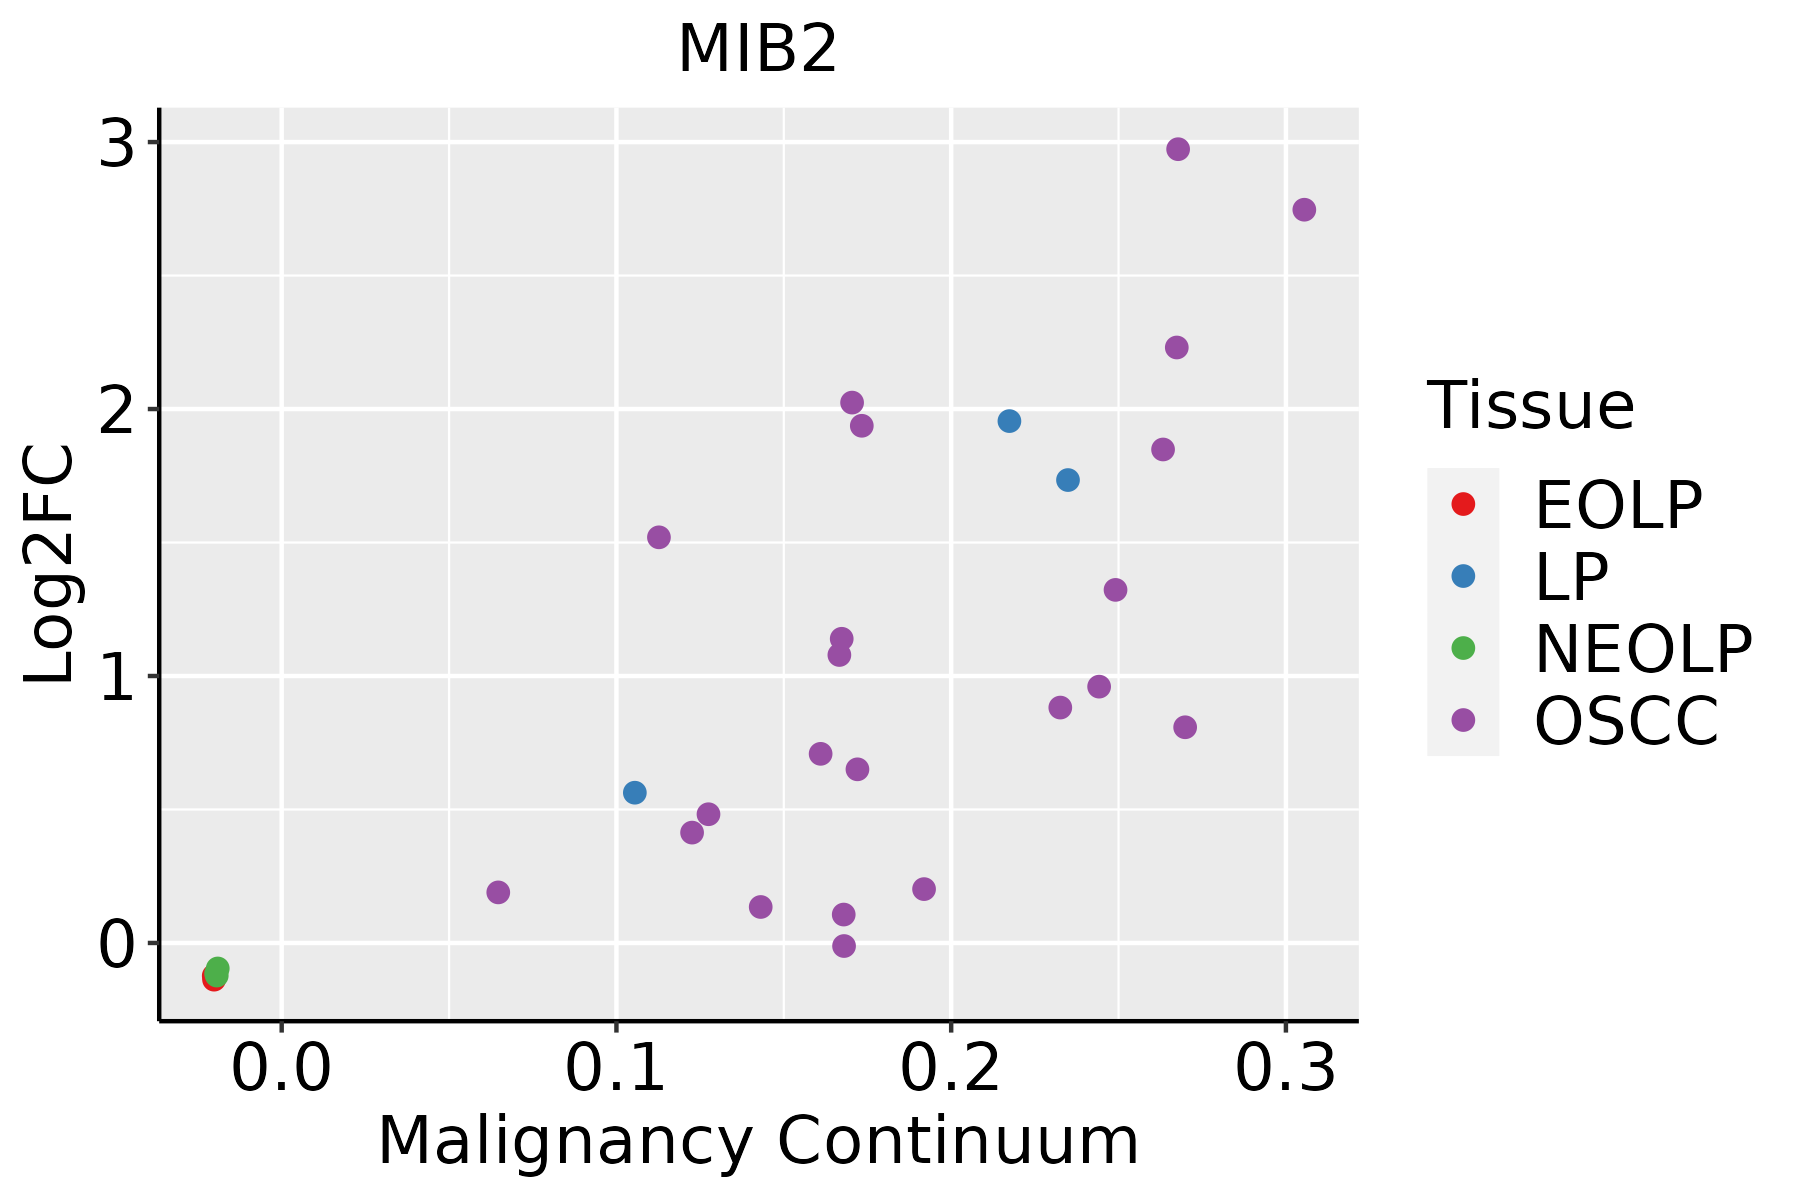 | EOLP: Erosive Oral lichen planus |
| LP: leukoplakia | ||
| NEOLP: Non-erosive oral lichen planus | ||
| OSCC: Oral squamous cell carcinoma | ||
| Skin | 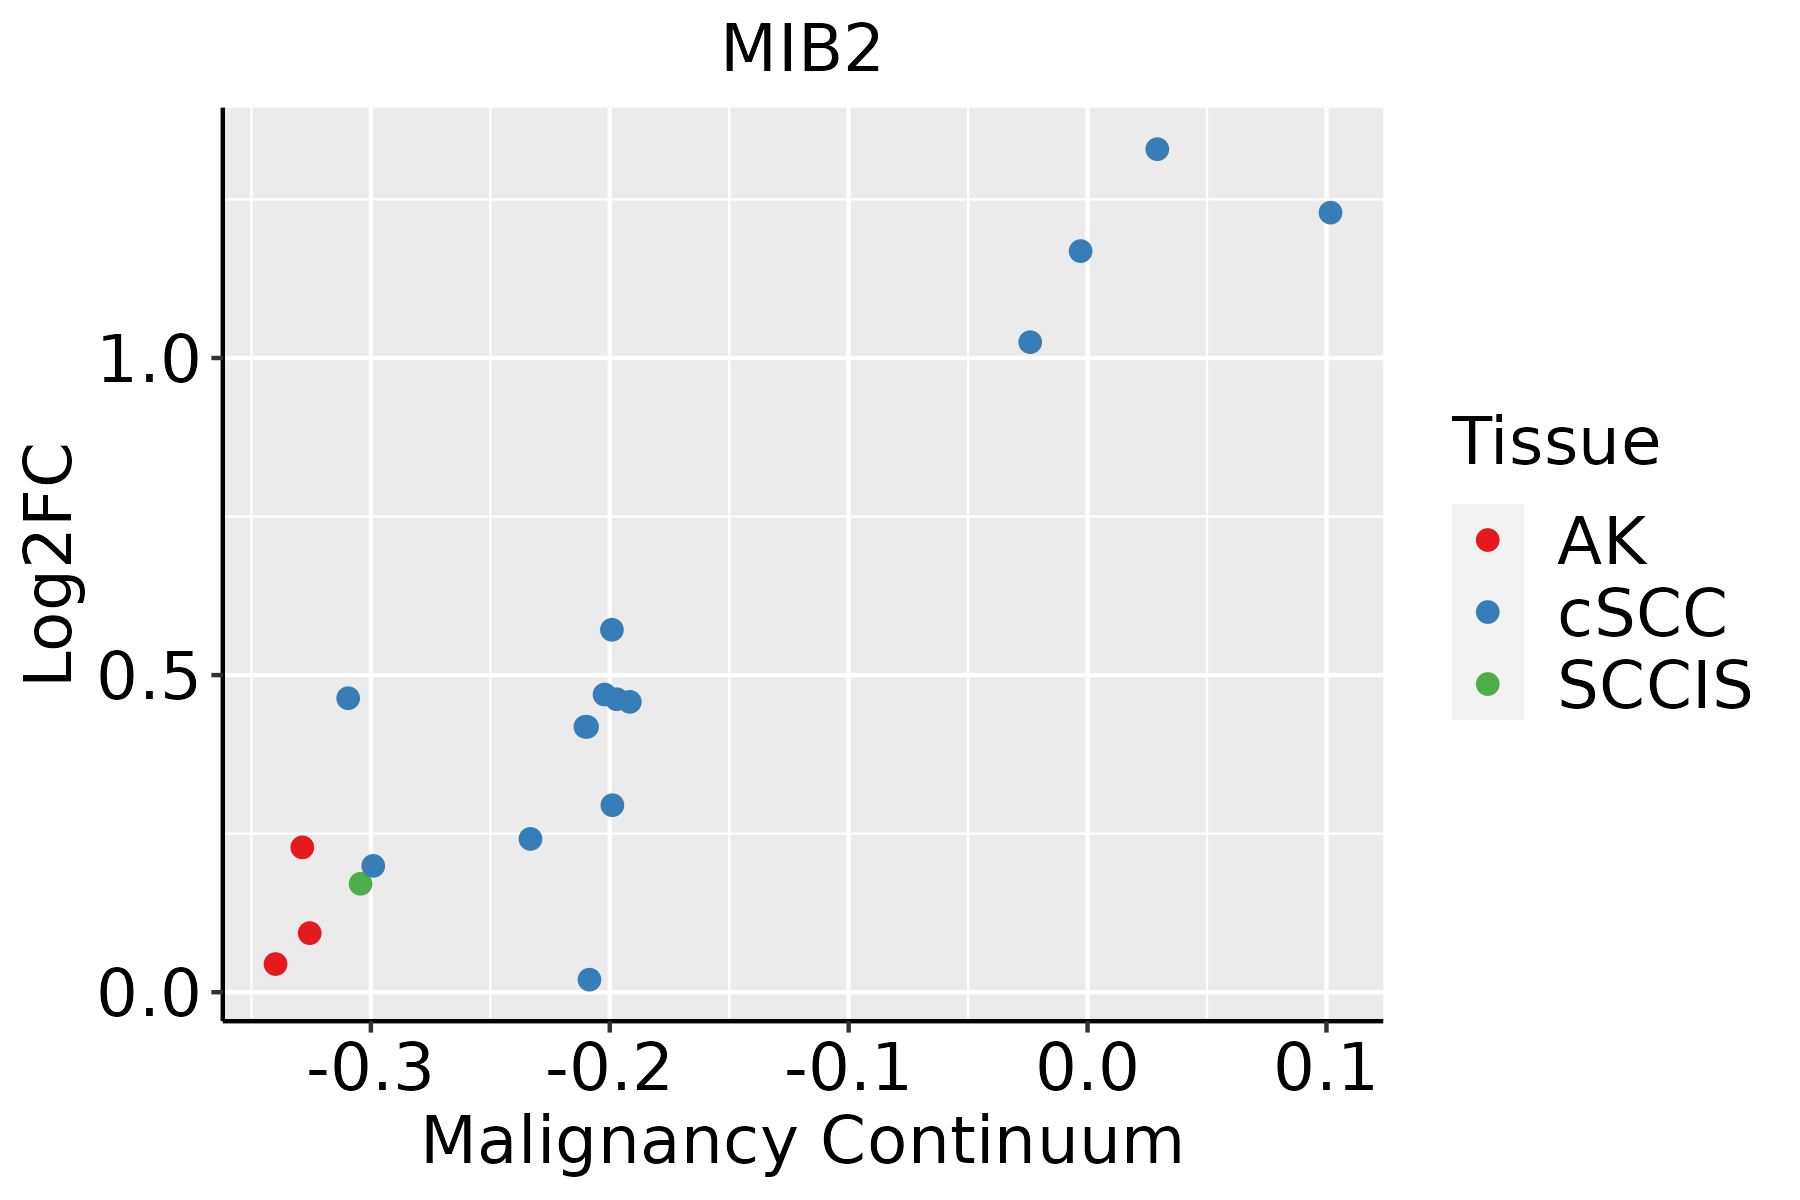 | AK: Actinic keratosis |
| cSCC: Cutaneous squamous cell carcinoma | ||
| SCCIS:squamous cell carcinoma in situ |
| ∗log2FC in expression of this searched gene in stem-like cells from each diseased tissue sample relative to stem-like cells in normal samples in each tissue plotted against the malignancy continuum. Samples are colored based on if they are from different disease stage. |
Top |
Malignant transformation related pathway analysis |
| Find out the enriched GO biological processes and KEGG pathways involved in transition from healthy to precancer to cancer |
| Tissue | Disease Stage | Enriched GO biological Processes |
| Colorectum | AD |  |
| Colorectum | SER |  |
| Colorectum | MSS |  |
| Colorectum | MSI-H |  |
| Colorectum | FAP |  |
| ∗Top 15 enriched GO BP terms are showed in the bar plot of each disease state in each tissue. Each row represents a significant GO biological process which is colored according to the -log10(p.adjust). |
| Page: 1 2 3 4 5 6 7 8 9 |
| GO ID | Tissue | Disease Stage | Description | Gene Ratio | Bg Ratio | pvalue | p.adjust | Count |
| GO:004312318 | Esophagus | ESCC | positive regulation of I-kappaB kinase/NF-kappaB signaling | 132/8552 | 186/18723 | 2.07e-12 | 8.58e-11 | 132 |
| GO:0043122110 | Esophagus | ESCC | regulation of I-kappaB kinase/NF-kappaB signaling | 167/8552 | 249/18723 | 6.11e-12 | 2.32e-10 | 167 |
| GO:000724919 | Esophagus | ESCC | I-kappaB kinase/NF-kappaB signaling | 183/8552 | 281/18723 | 3.02e-11 | 1.01e-09 | 183 |
| GO:00072197 | Esophagus | ESCC | Notch signaling pathway | 106/8552 | 172/18723 | 1.74e-05 | 1.55e-04 | 106 |
| GO:004312218 | Oral cavity | OSCC | regulation of I-kappaB kinase/NF-kappaB signaling | 155/7305 | 249/18723 | 7.79e-14 | 4.14e-12 | 155 |
| GO:004312310 | Oral cavity | OSCC | positive regulation of I-kappaB kinase/NF-kappaB signaling | 122/7305 | 186/18723 | 1.68e-13 | 8.52e-12 | 122 |
| GO:000724910 | Oral cavity | OSCC | I-kappaB kinase/NF-kappaB signaling | 169/7305 | 281/18723 | 4.69e-13 | 2.25e-11 | 169 |
| GO:00072196 | Oral cavity | OSCC | Notch signaling pathway | 92/7305 | 172/18723 | 7.84e-05 | 6.08e-04 | 92 |
| GO:004312316 | Oral cavity | LP | positive regulation of I-kappaB kinase/NF-kappaB signaling | 88/4623 | 186/18723 | 1.58e-11 | 1.13e-09 | 88 |
| GO:004312219 | Oral cavity | LP | regulation of I-kappaB kinase/NF-kappaB signaling | 103/4623 | 249/18723 | 4.48e-09 | 1.90e-07 | 103 |
| GO:000724917 | Oral cavity | LP | I-kappaB kinase/NF-kappaB signaling | 110/4623 | 281/18723 | 4.94e-08 | 1.70e-06 | 110 |
| GO:000721913 | Oral cavity | LP | Notch signaling pathway | 57/4623 | 172/18723 | 7.60e-03 | 4.18e-02 | 57 |
| GO:00072198 | Skin | AK | Notch signaling pathway | 34/1910 | 172/18723 | 1.20e-04 | 1.50e-03 | 34 |
| GO:004312224 | Skin | AK | regulation of I-kappaB kinase/NF-kappaB signaling | 42/1910 | 249/18723 | 7.65e-04 | 6.39e-03 | 42 |
| GO:000724920 | Skin | AK | I-kappaB kinase/NF-kappaB signaling | 46/1910 | 281/18723 | 8.56e-04 | 7.08e-03 | 46 |
| GO:004312319 | Skin | AK | positive regulation of I-kappaB kinase/NF-kappaB signaling | 31/1910 | 186/18723 | 4.21e-03 | 2.46e-02 | 31 |
| GO:0043123110 | Skin | cSCC | positive regulation of I-kappaB kinase/NF-kappaB signaling | 84/4864 | 186/18723 | 1.09e-08 | 3.40e-07 | 84 |
| GO:000724925 | Skin | cSCC | I-kappaB kinase/NF-kappaB signaling | 116/4864 | 281/18723 | 1.33e-08 | 4.08e-07 | 116 |
| GO:004312225 | Skin | cSCC | regulation of I-kappaB kinase/NF-kappaB signaling | 105/4864 | 249/18723 | 1.70e-08 | 5.09e-07 | 105 |
| GO:000721922 | Skin | cSCC | Notch signaling pathway | 60/4864 | 172/18723 | 5.82e-03 | 2.87e-02 | 60 |
| Page: 1 |
| Pathway ID | Tissue | Disease Stage | Description | Gene Ratio | Bg Ratio | pvalue | p.adjust | qvalue | Count |
| hsa05417211 | Esophagus | ESCC | Lipid and atherosclerosis | 143/4205 | 215/8465 | 3.30e-07 | 2.45e-06 | 1.26e-06 | 143 |
| hsa05417310 | Esophagus | ESCC | Lipid and atherosclerosis | 143/4205 | 215/8465 | 3.30e-07 | 2.45e-06 | 1.26e-06 | 143 |
| hsa0541730 | Oral cavity | OSCC | Lipid and atherosclerosis | 131/3704 | 215/8465 | 2.20e-07 | 1.45e-06 | 7.37e-07 | 131 |
| hsa05417113 | Oral cavity | OSCC | Lipid and atherosclerosis | 131/3704 | 215/8465 | 2.20e-07 | 1.45e-06 | 7.37e-07 | 131 |
| hsa05417210 | Oral cavity | LP | Lipid and atherosclerosis | 84/2418 | 215/8465 | 5.02e-04 | 2.61e-03 | 1.68e-03 | 84 |
| hsa0541738 | Oral cavity | LP | Lipid and atherosclerosis | 84/2418 | 215/8465 | 5.02e-04 | 2.61e-03 | 1.68e-03 | 84 |
| Page: 1 |
Top |
Cell-cell communication analysis |
| Identification of potential cell-cell interactions between two cell types and their ligand-receptor pairs for different disease states |
| Ligand | Receptor | LRpair | Pathway | Tissue | Disease Stage |
| Page: 1 |
Top |
Single-cell gene regulatory network inference analysis |
| Find out the significant the regulons (TFs) and the target genes of each regulon across cell types for different disease states |
| TF | Cell Type | Tissue | Disease Stage | Target Gene | RSS | Regulon Activity |
| ∗The dot plots of a searched regulon are shown for all cell subpopulations in each disease state of each tissue based on the regulon specific score inferred using pySCENIC and by calculating the average expression. |
| Page: 1 |
Top |
Somatic mutation of malignant transformation related genes |
| Annotation of somatic variants for genes involved in malignant transformation |
| Hugo Symbol | Variant Class | Variant Classification | dbSNP RS | HGVSc | HGVSp | HGVSp Short | SWISSPROT | BIOTYPE | SIFT | PolyPhen | Tumor Sample Barcode | Tissue | Histology | Sex | Age | Stage | Therapy Types | Drugs | Outcome |
| MIB2 | SNV | Missense_Mutation | c.1102G>A | p.Asp368Asn | p.D368N | Q96AX9 | protein_coding | tolerated(0.37) | possibly_damaging(0.604) | TCGA-AC-A23H-01 | Breast | breast invasive carcinoma | Female | >=65 | I/II | Unknown | Unknown | PD | |
| MIB2 | SNV | Missense_Mutation | c.1546N>C | p.Ala516Pro | p.A516P | Q96AX9 | protein_coding | deleterious(0.05) | probably_damaging(0.964) | TCGA-B6-A0RV-01 | Breast | breast invasive carcinoma | Female | <65 | III/IV | Unknown | Unknown | SD | |
| MIB2 | SNV | Missense_Mutation | novel | c.122C>T | p.Pro41Leu | p.P41L | Q96AX9 | protein_coding | deleterious_low_confidence(0) | benign(0.007) | TCGA-E2-A14T-01 | Breast | breast invasive carcinoma | Female | <65 | I/II | Chemotherapy | doxorubicin | SD |
| MIB2 | deletion | Frame_Shift_Del | c.2096_2124delTCCTCACGGAGGTGCCAAACATCGATGTT | p.Val699AspfsTer67 | p.V699Dfs*67 | Q96AX9 | protein_coding | TCGA-AR-A24Q-01 | Breast | breast invasive carcinoma | Female | <65 | I/II | Chemotherapy | doxorubicin | SD | |||
| MIB2 | SNV | Missense_Mutation | novel | c.1027G>T | p.Ala343Ser | p.A343S | Q96AX9 | protein_coding | tolerated(0.71) | benign(0.011) | TCGA-2W-A8YY-01 | Cervix | cervical & endocervical cancer | Female | <65 | I/II | Chemotherapy | cisplatin | CR |
| MIB2 | SNV | Missense_Mutation | novel | c.1760C>A | p.Ala587Asp | p.A587D | Q96AX9 | protein_coding | deleterious(0) | probably_damaging(0.999) | TCGA-2W-A8YY-01 | Cervix | cervical & endocervical cancer | Female | <65 | I/II | Chemotherapy | cisplatin | CR |
| MIB2 | SNV | Missense_Mutation | novel | c.3176G>A | p.Arg1059His | p.R1059H | Q96AX9 | protein_coding | deleterious(0) | probably_damaging(0.999) | TCGA-EA-A3HU-01 | Cervix | cervical & endocervical cancer | Female | <65 | I/II | Unknown | Unknown | SD |
| MIB2 | SNV | Missense_Mutation | c.190N>A | p.Glu64Lys | p.E64K | Q96AX9 | protein_coding | deleterious_low_confidence(0) | benign(0) | TCGA-EK-A2RC-01 | Cervix | cervical & endocervical cancer | Female | <65 | I/II | Unknown | Unknown | SD | |
| MIB2 | SNV | Missense_Mutation | novel | c.1444N>T | p.Val482Leu | p.V482L | Q96AX9 | protein_coding | deleterious(0) | probably_damaging(0.995) | TCGA-HM-A6W2-06 | Cervix | cervical & endocervical cancer | Female | <65 | I/II | Chemotherapy | cisplatin | SD |
| MIB2 | SNV | Missense_Mutation | c.2969N>A | p.Arg990His | p.R990H | Q96AX9 | protein_coding | deleterious(0.02) | benign(0.01) | TCGA-A6-6653-01 | Colorectum | colon adenocarcinoma | Male | >=65 | I/II | Unknown | Unknown | SD |
| Page: 1 2 3 4 5 6 7 8 |
Top |
Related drugs of malignant transformation related genes |
| Identification of chemicals and drugs interact with genes involved in malignant transfromation |
| (DGIdb 4.0) |
| Entrez ID | Symbol | Category | Interaction Types | Drug Claim Name | Drug Name | PMIDs |
| Page: 1 |

Copyright 2023-Present -The University of Texas Health Science Center at Houston |