| Tissue | Expression Dynamics | Abbreviation |
| Cervix |  | CC: Cervix cancer |
| HSIL_HPV: HPV-infected high-grade squamous intraepithelial lesions |
| N_HPV: HPV-infected normal cervix |
| Esophagus | 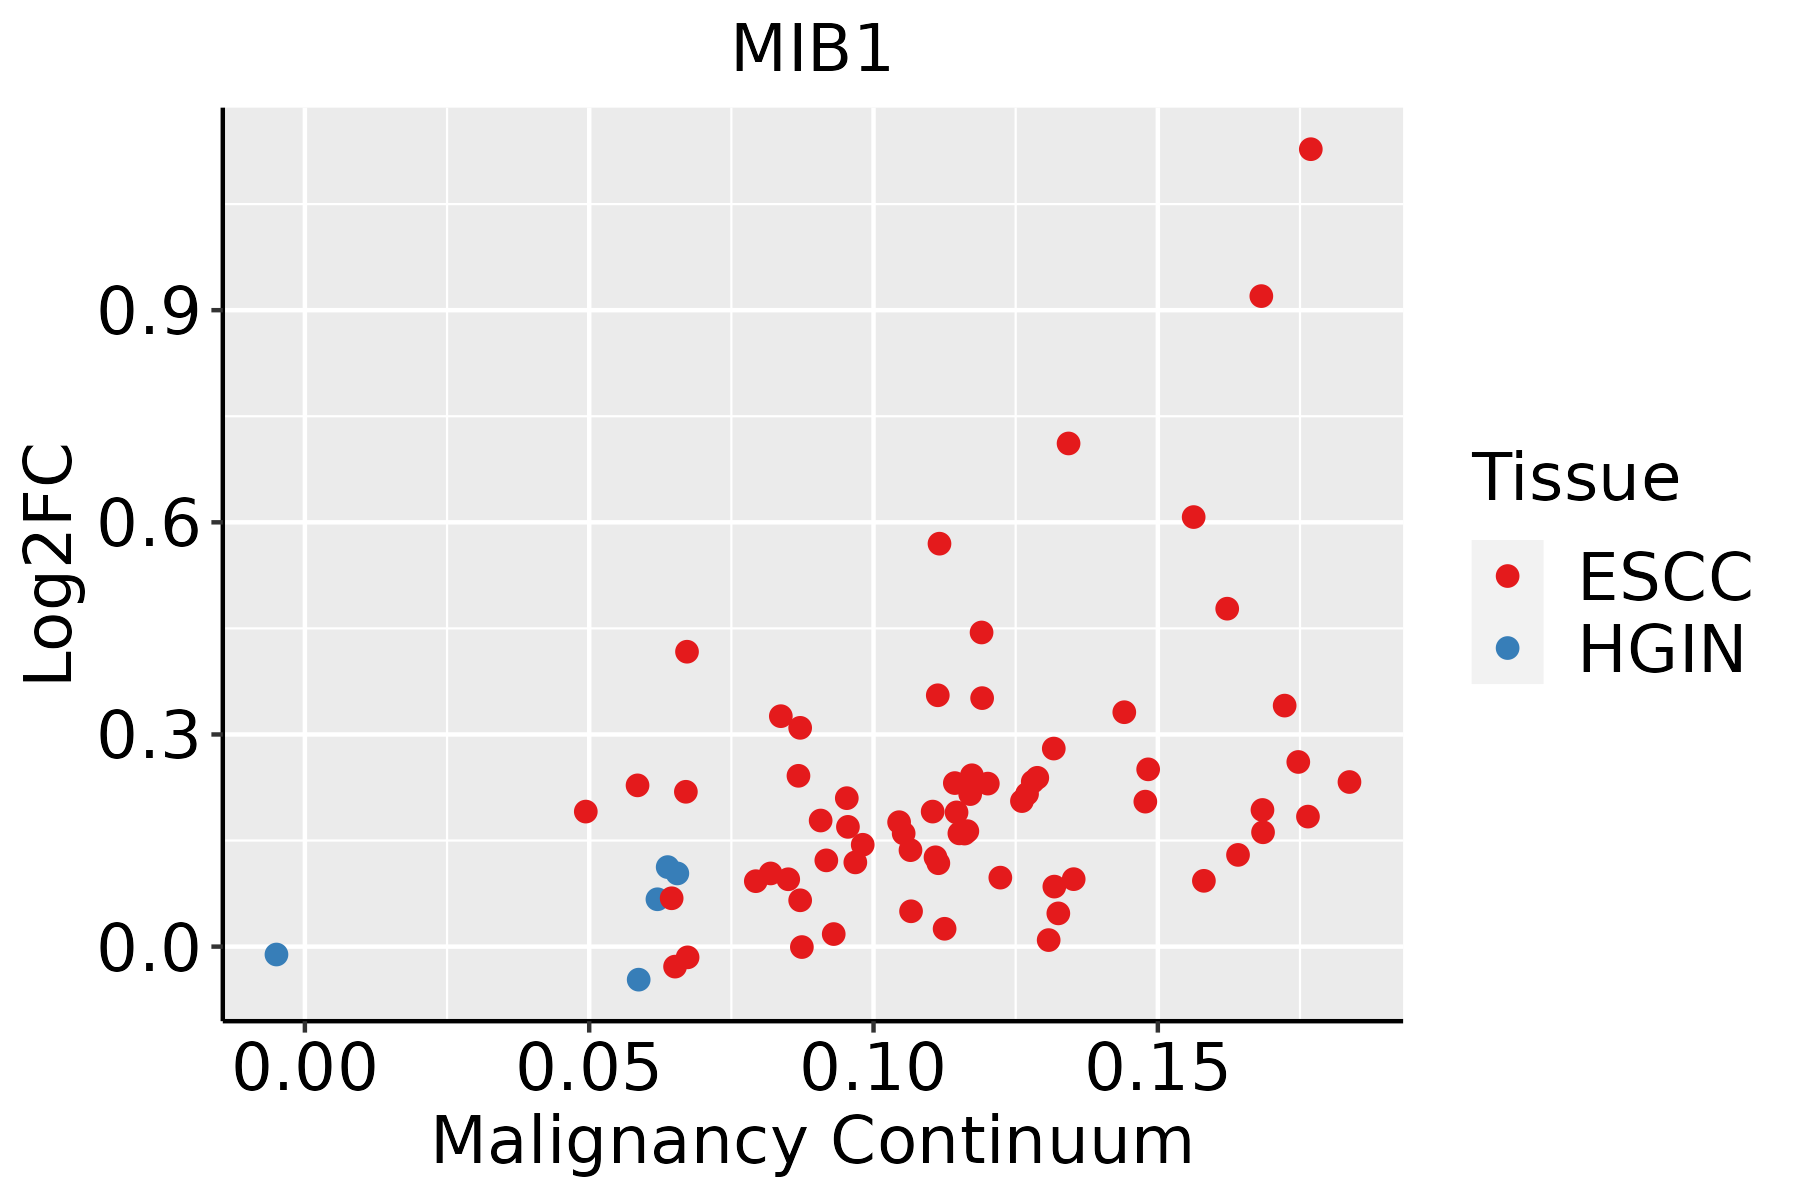 | ESCC: Esophageal squamous cell carcinoma |
| HGIN: High-grade intraepithelial neoplasias |
| LGIN: Low-grade intraepithelial neoplasias |
| Liver |  | HCC: Hepatocellular carcinoma |
| NAFLD: Non-alcoholic fatty liver disease |
| Prostate |  | BPH: Benign Prostatic Hyperplasia |
| Thyroid | 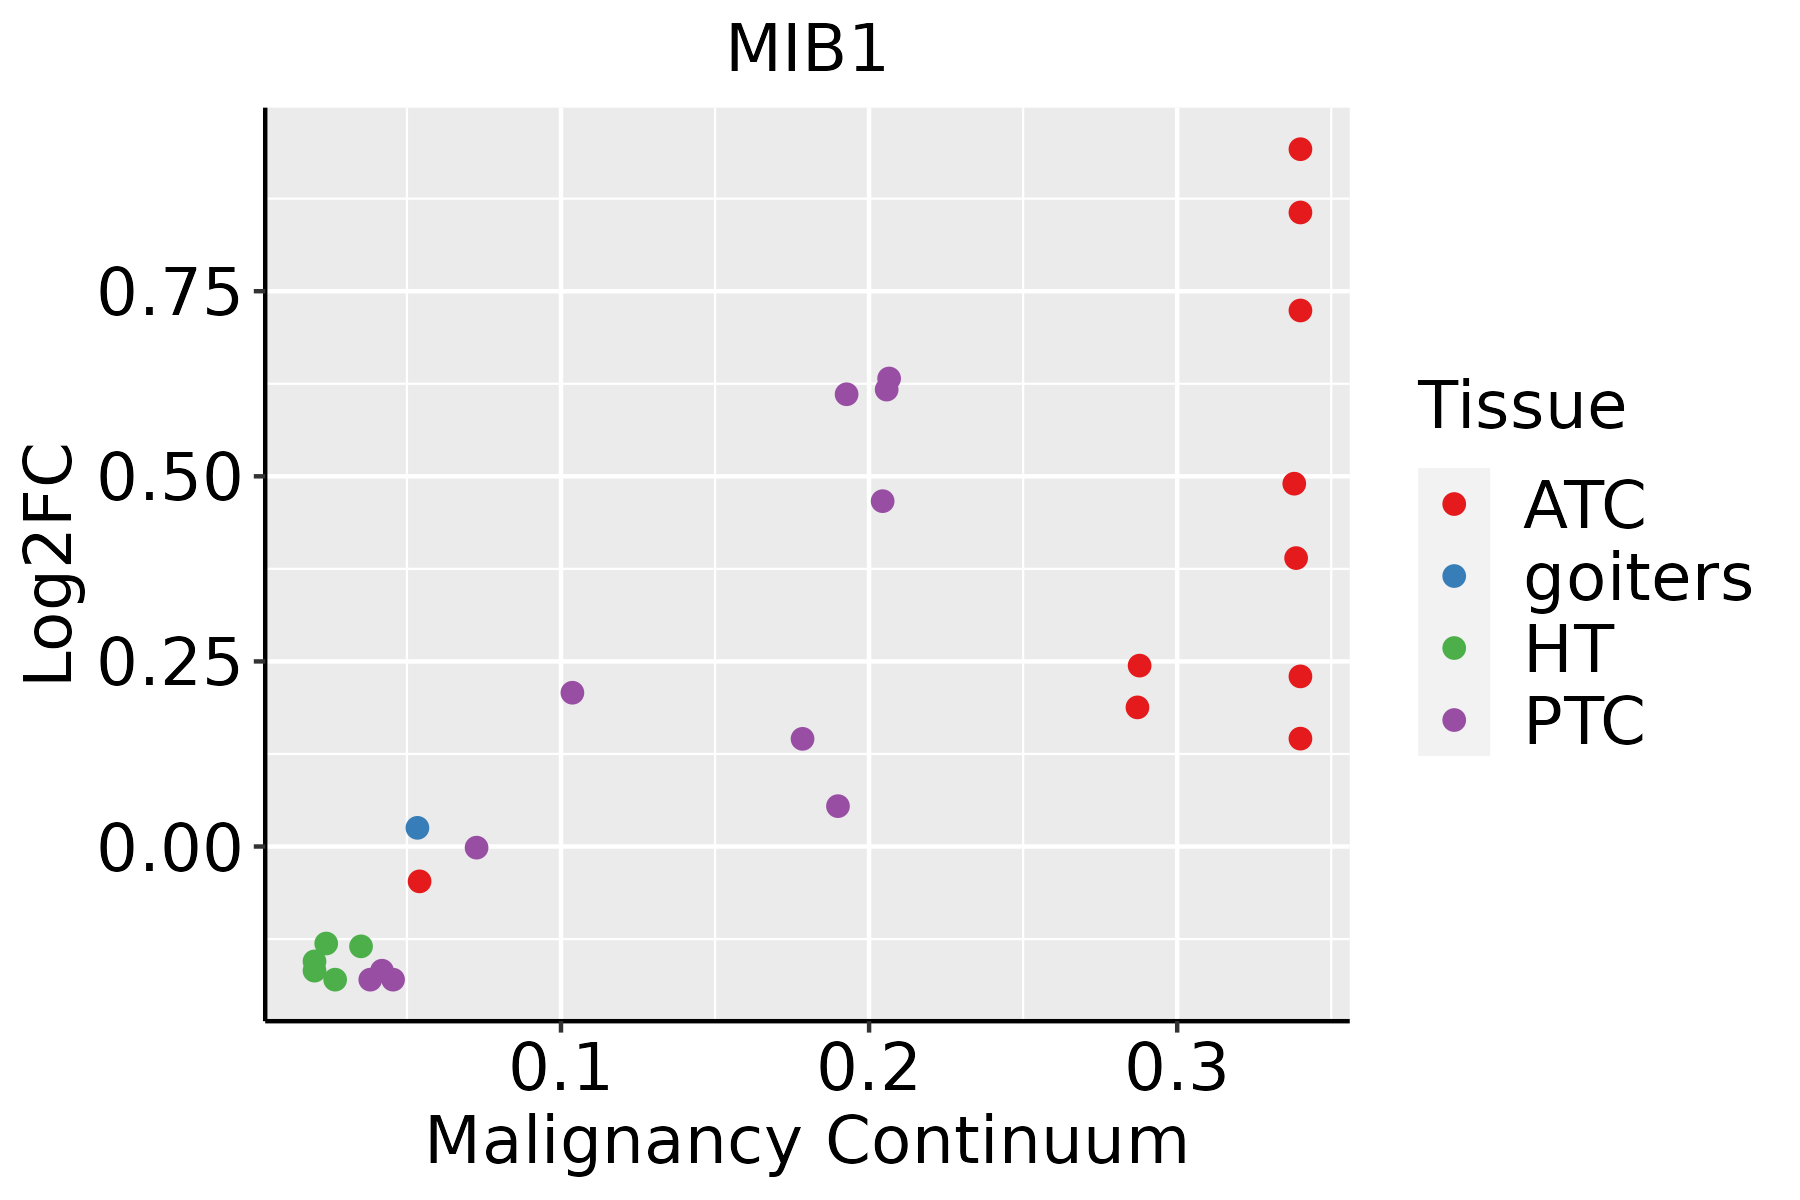 | ATC: Anaplastic thyroid cancer |
| HT: Hashimoto's thyroiditis |
| PTC: Papillary thyroid cancer |
| GO ID | Tissue | Disease Stage | Description | Gene Ratio | Bg Ratio | pvalue | p.adjust | Count |
| GO:00301008 | Cervix | CC | regulation of endocytosis | 47/2311 | 211/18723 | 3.65e-05 | 5.82e-04 | 47 |
| GO:00458077 | Cervix | CC | positive regulation of endocytosis | 27/2311 | 100/18723 | 5.55e-05 | 8.10e-04 | 27 |
| GO:00017018 | Cervix | CC | in utero embryonic development | 71/2311 | 367/18723 | 7.21e-05 | 1.00e-03 | 71 |
| GO:00072194 | Cervix | CC | Notch signaling pathway | 39/2311 | 172/18723 | 1.08e-04 | 1.38e-03 | 39 |
| GO:00351487 | Cervix | CC | tube formation | 31/2311 | 148/18723 | 2.07e-03 | 1.51e-02 | 31 |
| GO:00018417 | Cervix | CC | neural tube formation | 23/2311 | 102/18723 | 2.80e-03 | 1.87e-02 | 23 |
| GO:00605626 | Cervix | CC | epithelial tube morphogenesis | 57/2311 | 325/18723 | 3.79e-03 | 2.41e-02 | 57 |
| GO:00219156 | Cervix | CC | neural tube development | 30/2311 | 152/18723 | 6.00e-03 | 3.43e-02 | 30 |
| GO:0045665 | Cervix | CC | negative regulation of neuron differentiation | 16/2311 | 69/18723 | 8.75e-03 | 4.48e-02 | 16 |
| GO:000170119 | Esophagus | ESCC | in utero embryonic development | 243/8552 | 367/18723 | 1.00e-15 | 6.86e-14 | 243 |
| GO:000184115 | Esophagus | ESCC | neural tube formation | 75/8552 | 102/18723 | 9.68e-09 | 1.95e-07 | 75 |
| GO:003010018 | Esophagus | ESCC | regulation of endocytosis | 135/8552 | 211/18723 | 5.75e-08 | 1.02e-06 | 135 |
| GO:00219159 | Esophagus | ESCC | neural tube development | 101/8552 | 152/18723 | 1.78e-07 | 2.79e-06 | 101 |
| GO:00163316 | Esophagus | ESCC | morphogenesis of embryonic epithelium | 98/8552 | 147/18723 | 2.12e-07 | 3.27e-06 | 98 |
| GO:000183814 | Esophagus | ESCC | embryonic epithelial tube formation | 83/8552 | 121/18723 | 2.78e-07 | 4.08e-06 | 83 |
| GO:003514815 | Esophagus | ESCC | tube formation | 96/8552 | 148/18723 | 1.86e-06 | 2.16e-05 | 96 |
| GO:004580718 | Esophagus | ESCC | positive regulation of endocytosis | 69/8552 | 100/18723 | 1.97e-06 | 2.29e-05 | 69 |
| GO:00721759 | Esophagus | ESCC | epithelial tube formation | 86/8552 | 132/18723 | 4.81e-06 | 5.10e-05 | 86 |
| GO:006056210 | Esophagus | ESCC | epithelial tube morphogenesis | 187/8552 | 325/18723 | 9.95e-06 | 9.44e-05 | 187 |
| GO:00072197 | Esophagus | ESCC | Notch signaling pathway | 106/8552 | 172/18723 | 1.74e-05 | 1.55e-04 | 106 |
| Pathway ID | Tissue | Disease Stage | Description | Gene Ratio | Bg Ratio | pvalue | p.adjust | qvalue | Count |
| hsa0541720 | Cervix | CC | Lipid and atherosclerosis | 65/1267 | 215/8465 | 6.47e-09 | 1.10e-07 | 6.52e-08 | 65 |
| hsa05417110 | Cervix | CC | Lipid and atherosclerosis | 65/1267 | 215/8465 | 6.47e-09 | 1.10e-07 | 6.52e-08 | 65 |
| hsa05417211 | Esophagus | ESCC | Lipid and atherosclerosis | 143/4205 | 215/8465 | 3.30e-07 | 2.45e-06 | 1.26e-06 | 143 |
| hsa05417310 | Esophagus | ESCC | Lipid and atherosclerosis | 143/4205 | 215/8465 | 3.30e-07 | 2.45e-06 | 1.26e-06 | 143 |
| hsa0541722 | Liver | Cirrhotic | Lipid and atherosclerosis | 80/2530 | 215/8465 | 1.18e-02 | 3.81e-02 | 2.35e-02 | 80 |
| hsa0541732 | Liver | Cirrhotic | Lipid and atherosclerosis | 80/2530 | 215/8465 | 1.18e-02 | 3.81e-02 | 2.35e-02 | 80 |
| hsa0541742 | Liver | HCC | Lipid and atherosclerosis | 118/4020 | 215/8465 | 1.66e-02 | 3.92e-02 | 2.18e-02 | 118 |
| hsa0541752 | Liver | HCC | Lipid and atherosclerosis | 118/4020 | 215/8465 | 1.66e-02 | 3.92e-02 | 2.18e-02 | 118 |
| hsa0541728 | Prostate | BPH | Lipid and atherosclerosis | 66/1718 | 215/8465 | 1.68e-04 | 9.56e-04 | 5.92e-04 | 66 |
| hsa05417112 | Prostate | BPH | Lipid and atherosclerosis | 66/1718 | 215/8465 | 1.68e-04 | 9.56e-04 | 5.92e-04 | 66 |
| hsa0541729 | Prostate | Tumor | Lipid and atherosclerosis | 65/1791 | 215/8465 | 9.79e-04 | 4.44e-03 | 2.75e-03 | 65 |
| hsa0541737 | Prostate | Tumor | Lipid and atherosclerosis | 65/1791 | 215/8465 | 9.79e-04 | 4.44e-03 | 2.75e-03 | 65 |
| Hugo Symbol | Variant Class | Variant Classification | dbSNP RS | HGVSc | HGVSp | HGVSp Short | SWISSPROT | BIOTYPE | SIFT | PolyPhen | Tumor Sample Barcode | Tissue | Histology | Sex | Age | Stage | Therapy Types | Drugs | Outcome |
| MIB1 | SNV | Missense_Mutation | | c.435N>C | p.Lys145Asn | p.K145N | Q86YT6 | protein_coding | deleterious(0.03) | possibly_damaging(0.775) | TCGA-A8-A06X-01 | Breast | breast invasive carcinoma | Female | >=65 | I/II | Unknown | Unknown | SD |
| MIB1 | SNV | Missense_Mutation | | c.617G>A | p.Arg206Lys | p.R206K | Q86YT6 | protein_coding | deleterious(0) | probably_damaging(0.92) | TCGA-AC-A23H-01 | Breast | breast invasive carcinoma | Female | >=65 | I/II | Unknown | Unknown | PD |
| MIB1 | SNV | Missense_Mutation | | c.2119C>G | p.Leu707Val | p.L707V | Q86YT6 | protein_coding | deleterious(0.02) | probably_damaging(0.92) | TCGA-AC-A23H-01 | Breast | breast invasive carcinoma | Female | >=65 | I/II | Unknown | Unknown | PD |
| MIB1 | SNV | Missense_Mutation | | c.467N>C | p.Arg156Thr | p.R156T | Q86YT6 | protein_coding | deleterious(0) | possibly_damaging(0.855) | TCGA-AO-A0JE-01 | Breast | breast invasive carcinoma | Female | <65 | III/IV | Chemotherapy | doxorubicin | SD |
| MIB1 | SNV | Missense_Mutation | | c.2811N>G | p.Asp937Glu | p.D937E | Q86YT6 | protein_coding | tolerated(0.43) | possibly_damaging(0.785) | TCGA-AO-A124-01 | Breast | breast invasive carcinoma | Female | <65 | I/II | Chemotherapy | doxorubicin | SD |
| MIB1 | SNV | Missense_Mutation | | c.923N>T | p.Pro308Leu | p.P308L | Q86YT6 | protein_coding | deleterious(0) | probably_damaging(0.927) | TCGA-AR-A1AJ-01 | Breast | breast invasive carcinoma | Female | >=65 | I/II | Unknown | Unknown | SD |
| MIB1 | SNV | Missense_Mutation | | c.2903A>G | p.Asp968Gly | p.D968G | Q86YT6 | protein_coding | deleterious(0) | probably_damaging(0.959) | TCGA-AR-A24X-01 | Breast | breast invasive carcinoma | Female | <65 | I/II | Hormone Therapy | tamoxiphen | SD |
| MIB1 | SNV | Missense_Mutation | | c.1127N>G | p.Tyr376Cys | p.Y376C | Q86YT6 | protein_coding | deleterious(0) | benign(0.431) | TCGA-BH-A18G-01 | Breast | breast invasive carcinoma | Female | >=65 | I/II | Unknown | Unknown | SD |
| MIB1 | SNV | Missense_Mutation | | c.2382N>T | p.Lys794Asn | p.K794N | Q86YT6 | protein_coding | tolerated(0.6) | benign(0.161) | TCGA-LL-A8F5-01 | Breast | breast invasive carcinoma | Female | <65 | I/II | Chemotherapy | cyclophosphamide | SD |
| MIB1 | insertion | Nonsense_Mutation | novel | c.2336_2337insTTAG | p.Cys780Ter | p.C780* | Q86YT6 | protein_coding | | | TCGA-AN-A0FW-01 | Breast | breast invasive carcinoma | Female | >=65 | III/IV | Unknown | Unknown | SD |


