Schematic overview of the cellular and molecular mechanisms involved in the cancer progression, including the proposed cellular and molecular mechanisms in cancer cells trajectory. AT1: alveolar type 1 cells; AT2: alveolar type 2 cells; AAH: atypical adenomatous hyperplasia; AIS: adenocarcinoma in situ; MIA: minimally invasive adenocarcinoma; IA: invasive adenocarcinoma; EMT: epithelial-mesenchymal transition

Home

Download

Statistics

Help

Contact

Center for Computational Systems Medicine
leaf

Gene summary

leaf

Malignant transformation analysis

leaf

Malignant transformation related pathway analysis

leaf

Cell-cell communication analysis

leaf

Single-cell gene regulatory network inference analysis

leaf

Somatic mutation of malignant transformation related genes

leaf

Related drugs of malignant transformation related genes

Gene: MIA2

Gene summary for MIA2

check button Gene summary.

Gene informationSpeciesHuman
Gene symbol

MIA2

Gene ID

4253

Gene nameMIA SH3 domain ER export factor 2
Gene AliasCTAGE5
Cytomap14q21.1
Gene Typeprotein-coding
GO ID

GO:0006810

UniProtAcc

O15320


Top

Malignant transformation analysis

check button Identification of the aberrant gene expression in precancerous and cancerous lesions by comparing the gene expression of stem-like cells in diseased tissues with normal stem cells
check button Malignant transformation involving gene list.
Entrez IDSymbolReplicatesSpeciesOrganTissueAdj P-valueLog2FCMalignancy
4253MIA2HTA11_3410_2000001011HumanColorectumAD1.54e-07-4.79e-010.0155
4253MIA2HTA11_2951_2000001011HumanColorectumAD2.86e-02-6.12e-010.0216
4253MIA2HTA11_696_2000001011HumanColorectumAD5.88e-09-3.51e-01-0.1464
4253MIA2HTA11_866_2000001011HumanColorectumAD1.19e-08-4.12e-01-0.1001
4253MIA2HTA11_7696_3000711011HumanColorectumAD4.05e-14-4.57e-010.0674
4253MIA2HTA11_99999970781_79442HumanColorectumMSS7.40e-36-6.09e-010.294
4253MIA2HTA11_99999965104_69814HumanColorectumMSS6.58e-08-6.00e-010.281
4253MIA2HTA11_99999971662_82457HumanColorectumMSS3.28e-34-6.12e-010.3859
4253MIA2HTA11_99999973899_84307HumanColorectumMSS1.13e-07-6.12e-010.2585
4253MIA2HTA11_99999974143_84620HumanColorectumMSS2.44e-31-6.08e-010.3005
4253MIA2A015-C-203HumanColorectumFAP9.98e-24-2.57e-01-0.1294
4253MIA2A002-C-201HumanColorectumFAP1.56e-04-1.55e-010.0324
4253MIA2A001-C-119HumanColorectumFAP9.67e-03-1.29e-01-0.1557
4253MIA2A001-C-108HumanColorectumFAP1.27e-12-9.07e-02-0.0272
4253MIA2A002-C-205HumanColorectumFAP5.02e-152.96e-02-0.1236
4253MIA2A015-C-006HumanColorectumFAP4.80e-07-2.33e-01-0.0994
4253MIA2A015-C-106HumanColorectumFAP2.76e-07-1.43e-01-0.0511
4253MIA2A002-C-114HumanColorectumFAP1.86e-10-1.77e-01-0.1561
4253MIA2A015-C-104HumanColorectumFAP8.28e-28-9.74e-02-0.1899
4253MIA2A001-C-014HumanColorectumFAP3.67e-09-1.33e-010.0135
Page: 1 2 3 4 5 6 7 

check button Transcriptomic changes along malignancy continuum.
TissueExpression DynamicsAbbreviation
Colorectum (GSE201348)The image shows the transcriptomic changes along malignancy continuum.log2FC in expression of this searched gene in stem-like cells from each diseased tissue sample relative to stem-like cells in normal samples in each tissue plotted against the malignancy continuum. Samples are colored based on if they are from different disease stage.FAP: Familial adenomatous polyposis
CRC: Colorectal cancer
Colorectum (HTA11)The image shows the transcriptomic changes along malignancy continuum.log2FC in expression of this searched gene in stem-like cells from each diseased tissue sample relative to stem-like cells in normal samples in each tissue plotted against the malignancy continuum. Samples are colored based on if they are from different disease stage.AD: Adenomas
SER: Sessile serrated lesions
MSI-H: Microsatellite-high colorectal cancer
MSS: Microsatellite stable colorectal cancer
EndometriumThe image shows the transcriptomic changes along malignancy continuum.log2FC in expression of this searched gene in stem-like cells from each diseased tissue sample relative to stem-like cells in normal samples in each tissue plotted against the malignancy continuum. Samples are colored based on if they are from different disease stage.
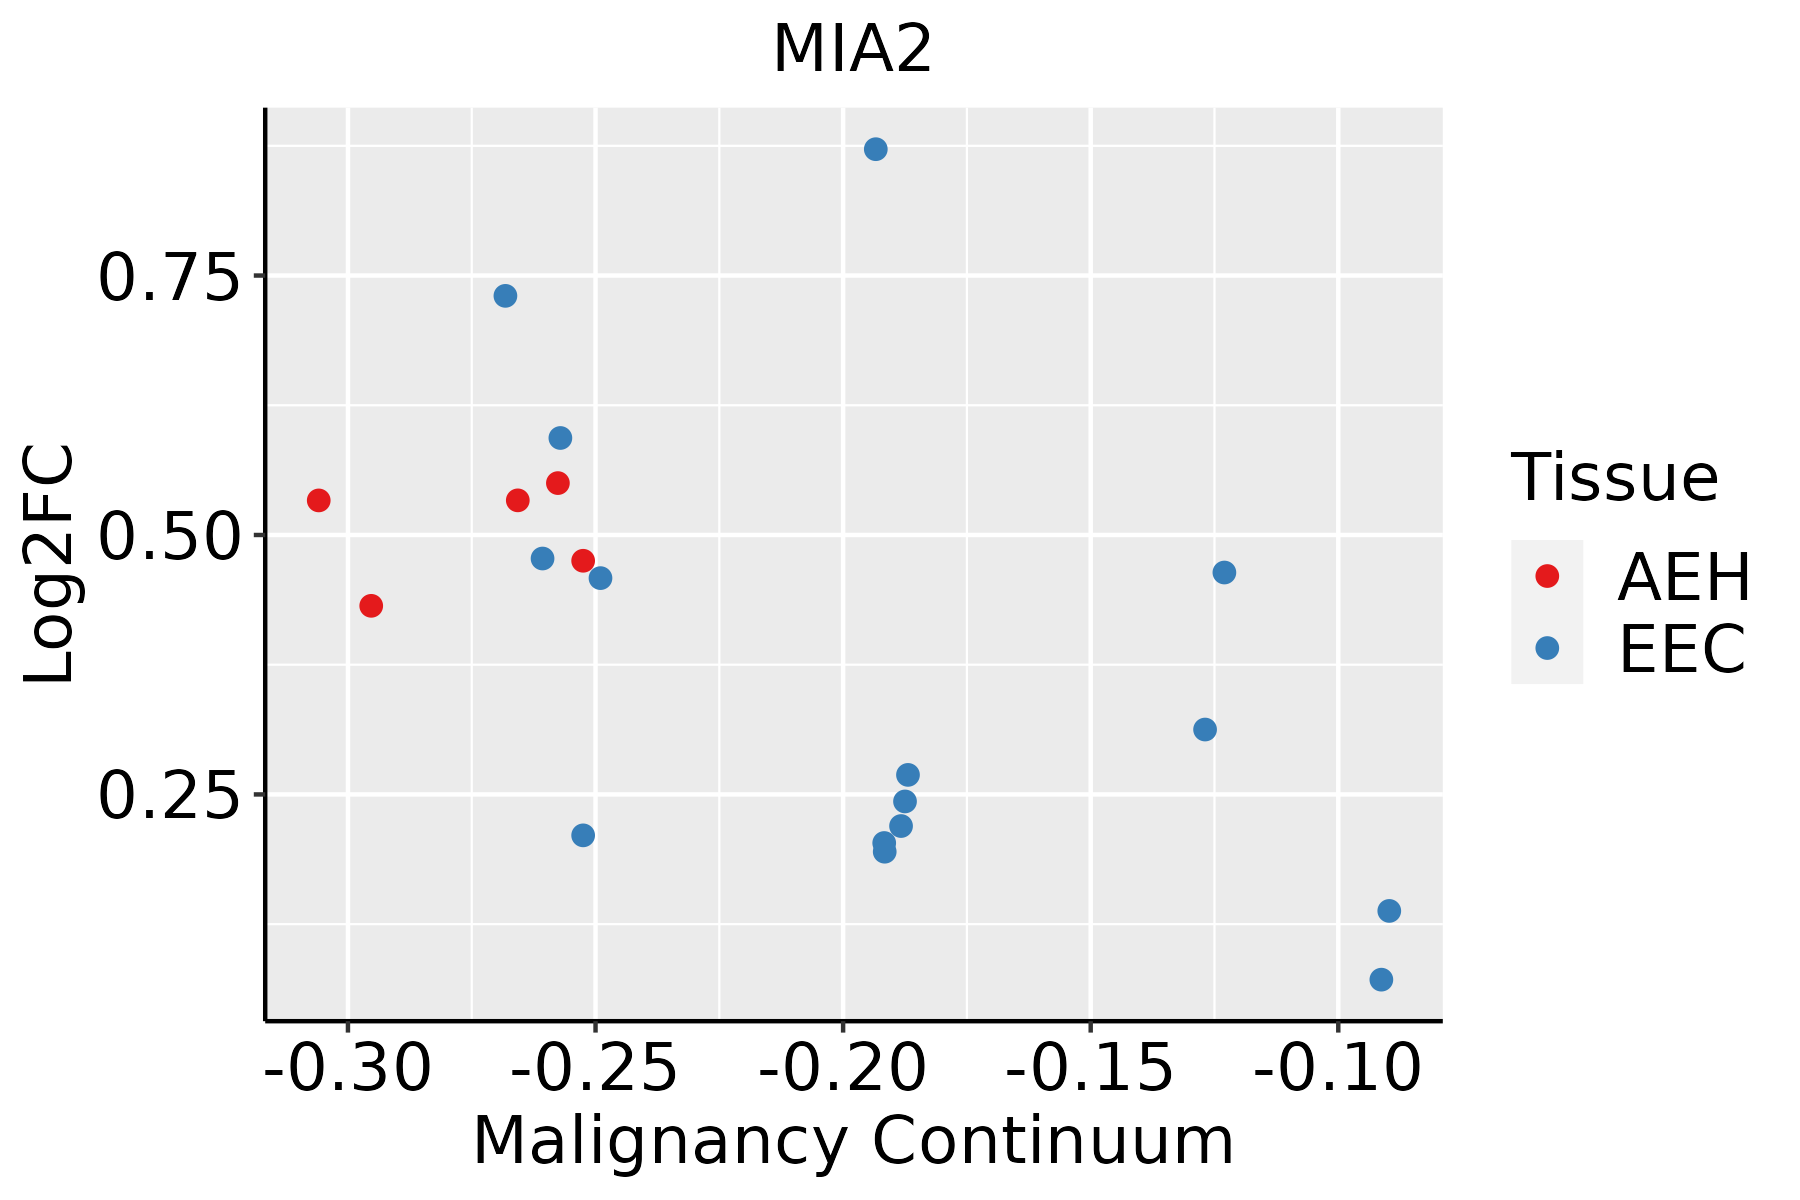
AEH: Atypical endometrial hyperplasia
EEC: Endometrioid Cancer
EsophagusThe image shows the transcriptomic changes along malignancy continuum.log2FC in expression of this searched gene in stem-like cells from each diseased tissue sample relative to stem-like cells in normal samples in each tissue plotted against the malignancy continuum. Samples are colored based on if they are from different disease stage.
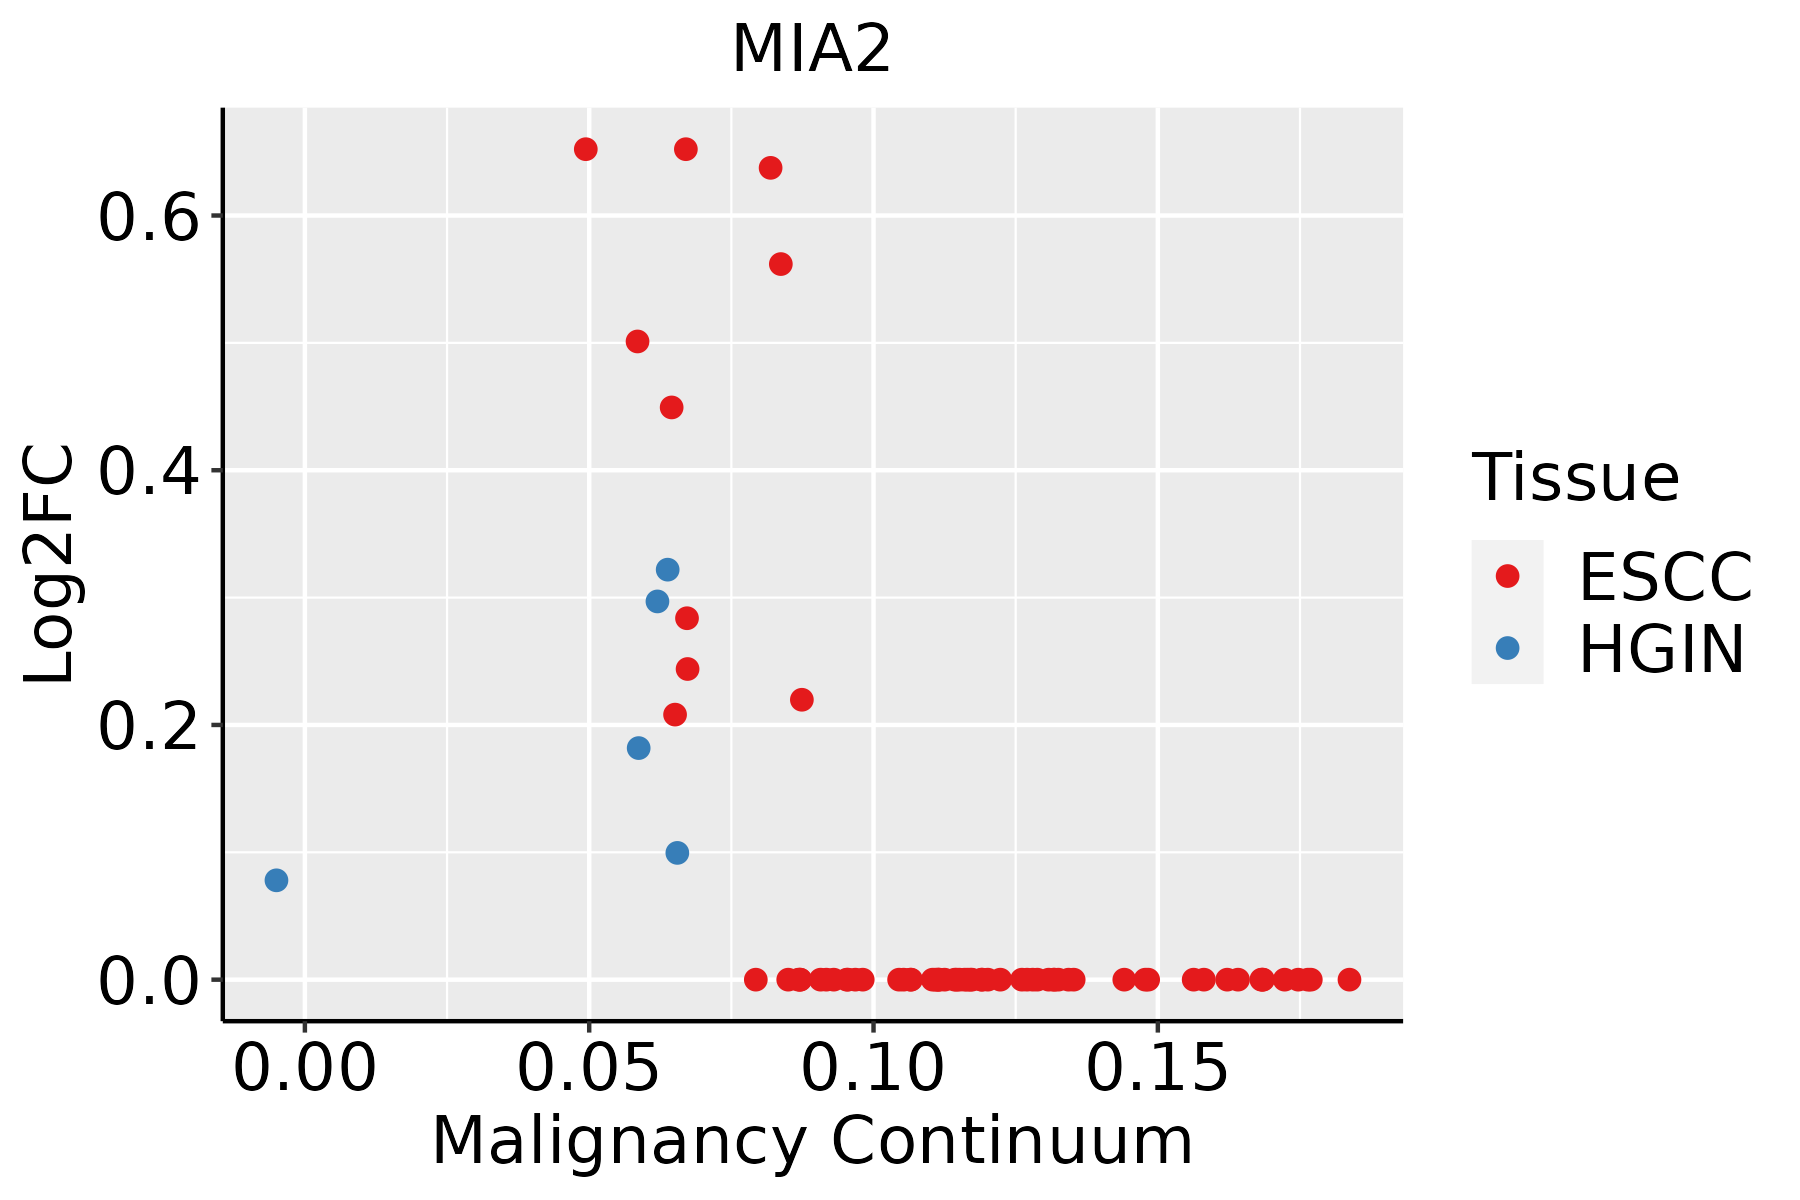
ESCC: Esophageal squamous cell carcinoma
HGIN: High-grade intraepithelial neoplasias
LGIN: Low-grade intraepithelial neoplasias
GCThe image shows the transcriptomic changes along malignancy continuum.log2FC in expression of this searched gene in stem-like cells from each diseased tissue sample relative to stem-like cells in normal samples in each tissue plotted against the malignancy continuum. Samples are colored based on if they are from different disease stage.CAG: Chronic atrophic gastritis
CAG with IM: Chronic atrophic gastritis with intestinal metaplasia
CSG: Chronic superficial gastritis
GC: Gastric cancer
SIM: Severe intestinal metaplasia
WIM: Wild intestinal metaplasia
LiverThe image shows the transcriptomic changes along malignancy continuum.log2FC in expression of this searched gene in stem-like cells from each diseased tissue sample relative to stem-like cells in normal samples in each tissue plotted against the malignancy continuum. Samples are colored based on if they are from different disease stage.
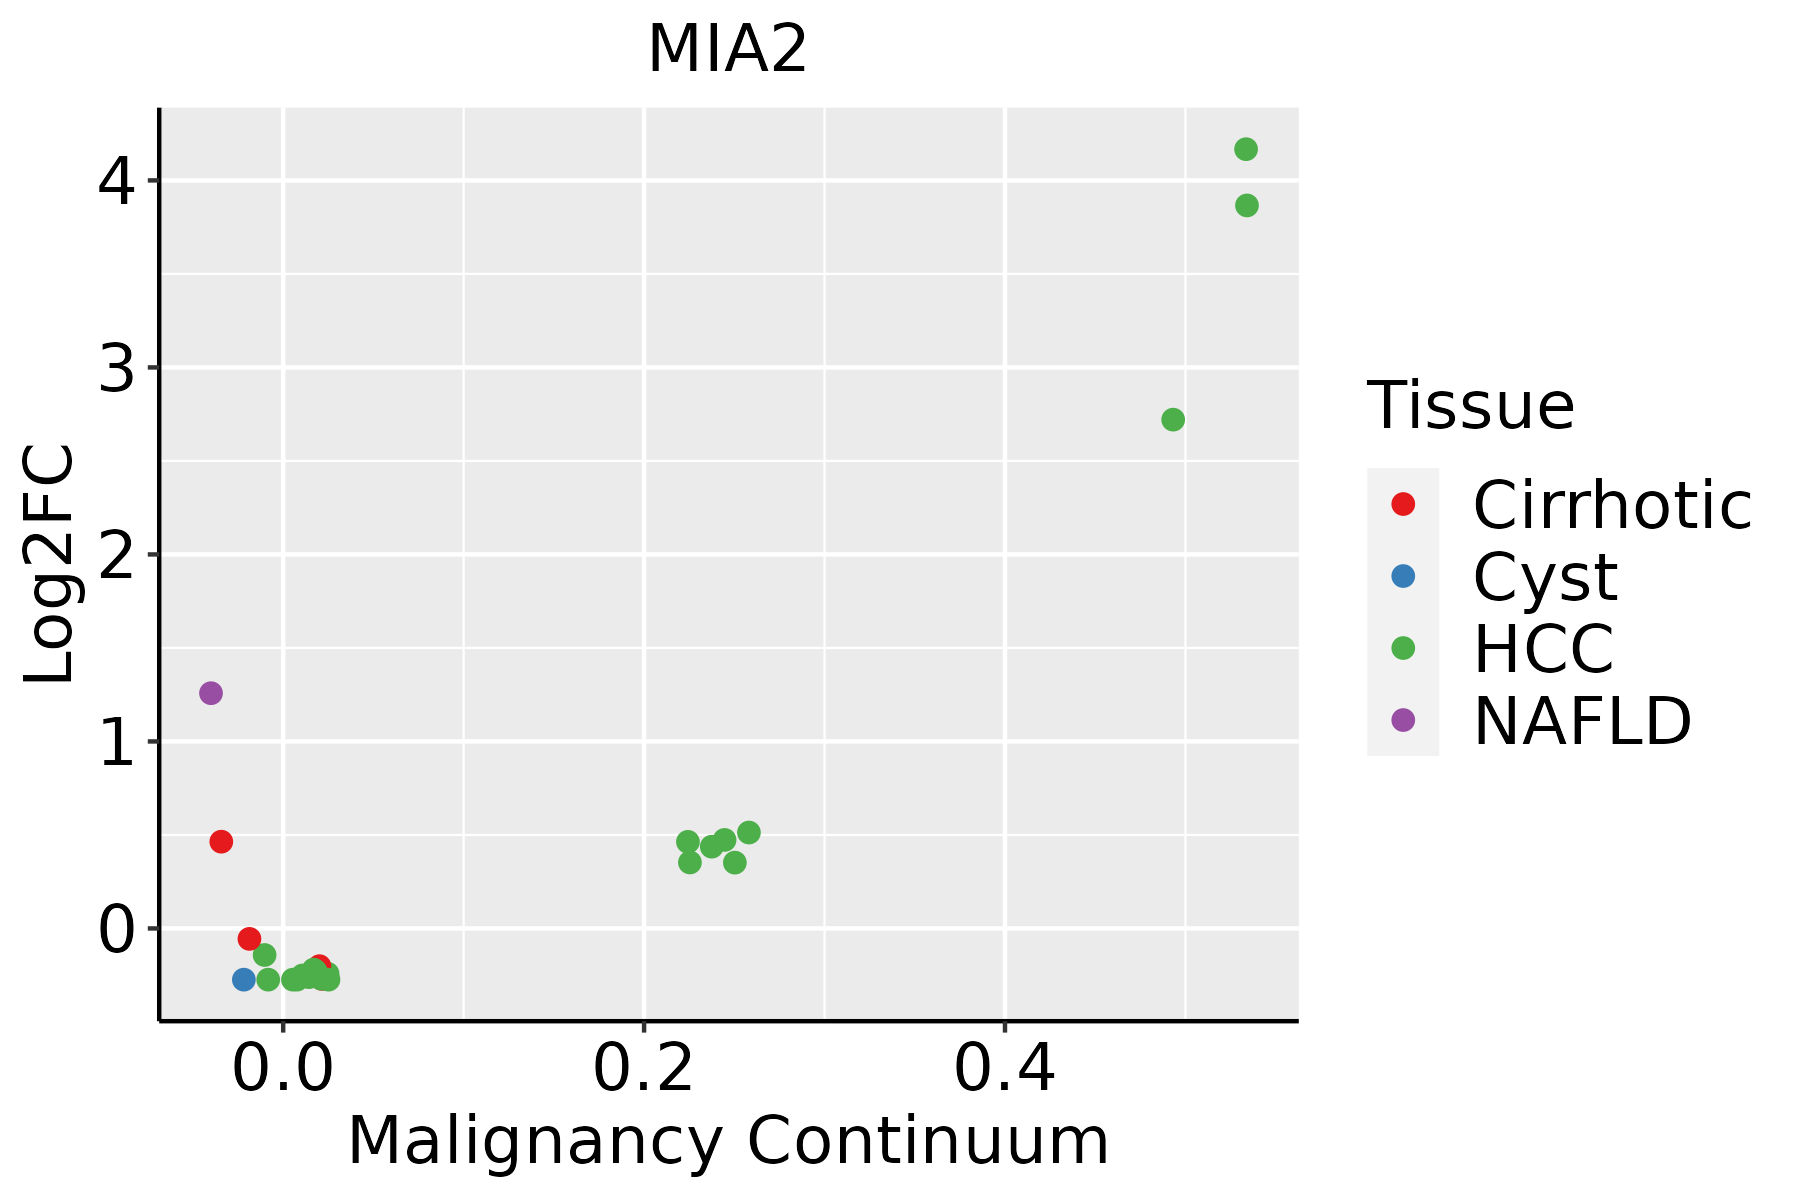
HCC: Hepatocellular carcinoma
NAFLD: Non-alcoholic fatty liver disease
LungThe image shows the transcriptomic changes along malignancy continuum.log2FC in expression of this searched gene in stem-like cells from each diseased tissue sample relative to stem-like cells in normal samples in each tissue plotted against the malignancy continuum. Samples are colored based on if they are from different disease stage.AAH: Atypical adenomatous hyperplasia
AIS: Adenocarcinoma in situ
IAC: Invasive lung adenocarcinoma
MIA: Minimally invasive adenocarcinoma
ThyroidThe image shows the transcriptomic changes along malignancy continuum.log2FC in expression of this searched gene in stem-like cells from each diseased tissue sample relative to stem-like cells in normal samples in each tissue plotted against the malignancy continuum. Samples are colored based on if they are from different disease stage.ATC: Anaplastic thyroid cancer
HT: Hashimoto's thyroiditis
PTC: Papillary thyroid cancer
∗log2FC in expression of this searched gene in stem-like cells from each diseased tissue sample relative to stem-like cells in normal samples in each tissue plotted against the malignancy continuum. Samples are colored based on if they are from different disease stage.

Top

Malignant transformation related pathway analysis

check buttonFind out the enriched GO biological processes and KEGG pathways involved in transition from healthy to precancer to cancer
check button Figure of enriched GO biological processes.
TissueDisease StageEnriched GO biological Processes
ColorectumADGO analysis - Figure of enriched GO biological processes: Top 15 enriched GO BP terms are showed in the bar plot of each disease state in each tissue. Each row represents a significant GO biological process which is colored according to the -log10(p.adjust).
ColorectumSERGO analysis - Figure of enriched GO biological processes: Top 15 enriched GO BP terms are showed in the bar plot of each disease state in each tissue. Each row represents a significant GO biological process which is colored according to the -log10(p.adjust).
ColorectumMSSGO analysis - Figure of enriched GO biological processes: Top 15 enriched GO BP terms are showed in the bar plot of each disease state in each tissue. Each row represents a significant GO biological process which is colored according to the -log10(p.adjust).
ColorectumMSI-HGO analysis - Figure of enriched GO biological processes: Top 15 enriched GO BP terms are showed in the bar plot of each disease state in each tissue. Each row represents a significant GO biological process which is colored according to the -log10(p.adjust).
ColorectumFAPGO analysis - Figure of enriched GO biological processes: Top 15 enriched GO BP terms are showed in the bar plot of each disease state in each tissue. Each row represents a significant GO biological process which is colored according to the -log10(p.adjust).
∗Top 15 enriched GO BP terms are showed in the bar plot of each disease state in each tissue. Each row represents a significant GO biological process which is colored according to the -log10(p.adjust).
Page: 1 2 3 4 5 6 7 8 9 

check button Enriched GO biological processes.
GO IDTissueDisease StageDescriptionGene RatioBg Ratiopvaluep.adjustCount
GO:0048193ColorectumADGolgi vesicle transport109/3918296/187231.80e-101.68e-08109
GO:0009306ColorectumADprotein secretion105/3918359/187231.05e-041.57e-03105
GO:0035592ColorectumADestablishment of protein localization to extracellular region105/3918360/187231.18e-041.73e-03105
GO:0071692ColorectumADprotein localization to extracellular region106/3918368/187231.86e-042.49e-03106
GO:0006888ColorectumADendoplasmic reticulum to Golgi vesicle-mediated transport44/3918130/187234.13e-044.68e-0344
GO:00481932ColorectumMSSGolgi vesicle transport101/3467296/187239.09e-119.77e-09101
GO:00068882ColorectumMSSendoplasmic reticulum to Golgi vesicle-mediated transport44/3467130/187232.17e-054.60e-0444
GO:00093062ColorectumMSSprotein secretion98/3467359/187232.43e-055.09e-0498
GO:00355922ColorectumMSSestablishment of protein localization to extracellular region98/3467360/187232.75e-055.58e-0498
GO:00716922ColorectumMSSprotein localization to extracellular region99/3467368/187234.17e-057.83e-0499
GO:0035459ColorectumMSSvesicle cargo loading11/346727/187236.03e-034.04e-0211
GO:00481934ColorectumFAPGolgi vesicle transport77/2622296/187232.86e-082.62e-0677
GO:00093063ColorectumFAPprotein secretion79/2622359/187232.24e-055.31e-0479
GO:00355923ColorectumFAPestablishment of protein localization to extracellular region79/2622360/187232.48e-055.77e-0479
GO:00716923ColorectumFAPprotein localization to extracellular region79/2622368/187235.50e-051.10e-0379
GO:00354591ColorectumFAPvesicle cargo loading10/262227/187232.46e-031.95e-0210
GO:00068884ColorectumFAPendoplasmic reticulum to Golgi vesicle-mediated transport30/2622130/187233.51e-032.53e-0230
GO:00481935ColorectumCRCGolgi vesicle transport59/2078296/187235.47e-062.17e-0459
GO:00093064ColorectumCRCprotein secretion59/2078359/187231.32e-031.48e-0259
GO:00355924ColorectumCRCestablishment of protein localization to extracellular region59/2078360/187231.41e-031.54e-0259
Page: 1 2 3 4 

check button Enriched KEGG pathways.
Pathway IDTissueDisease StageDescriptionGene RatioBg Ratiopvaluep.adjustqvalueCount
Page: 1 

Top

Cell-cell communication analysis

check buttonIdentification of potential cell-cell interactions between two cell types and their ligand-receptor pairs for different disease states
LigandReceptorLRpairPathwayTissueDisease Stage
Page: 1 

Top

Single-cell gene regulatory network inference analysis

check buttonFind out the significant the regulons (TFs) and the target genes of each regulon across cell types for different disease states
TFCell TypeTissueDisease StageTarget GeneRSSRegulon Activity
∗The dot plots of a searched regulon are shown for all cell subpopulations in each disease state of each tissue based on the regulon specific score inferred using pySCENIC and by calculating the average expression.
Page: 1 

Top

Somatic mutation of malignant transformation related genes

check buttonAnnotation of somatic variants for genes involved in malignant transformation
Hugo SymbolVariant ClassVariant ClassificationdbSNP RSHGVScHGVSpHGVSp ShortSWISSPROTBIOTYPESIFTPolyPhenTumor Sample BarcodeTissueHistologySexAgeStageTherapy TypesDrugsOutcome
MIA2SNVMissense_Mutationrs757273227c.1763N>Tp.Ser588Phep.S588FQ96PC5protein_codingtolerated(0.21)benign(0.049)TCGA-AC-A23H-01Breastbreast invasive carcinomaFemale>=65I/IIUnknownUnknownPD
MIA2SNVMissense_Mutationc.82N>Tp.Asp28Tyrp.D28YQ96PC5protein_codingdeleterious(0.01)possibly_damaging(0.682)TCGA-B6-A1KN-01Breastbreast invasive carcinomaFemale<65III/IVUnknownUnknownSD
MIA2SNVMissense_Mutationc.1462N>Gp.Gln488Glup.Q488EQ96PC5protein_codingtolerated(1)benign(0.003)TCGA-BH-A18J-01Breastbreast invasive carcinomaFemale<65III/IVUnknownUnknownPD
MIA2SNVMissense_Mutationrs778447741c.1040C>Tp.Ser347Phep.S347FQ96PC5protein_codingdeleterious(0)possibly_damaging(0.847)TCGA-BH-A18P-01Breastbreast invasive carcinomaFemale<65I/IIUnknownUnknownPD
MIA2SNVMissense_Mutationrs144750088c.463N>Cp.Tyr155Hisp.Y155HQ96PC5protein_codingtolerated(0.21)benign(0.006)TCGA-D8-A1XK-01Breastbreast invasive carcinomaFemale<65I/IIChemotherapydoxorubicine+cyclophosphamideSD
MIA2SNVMissense_Mutationrs146422472c.1675N>Ap.Glu559Lysp.E559KQ96PC5protein_codingdeleterious(0.02)benign(0.021)TCGA-E2-A15M-01Breastbreast invasive carcinomaFemale>=65I/IIHormone TherapyarimidexSD
MIA2SNVMissense_Mutationrs754357276c.1048G>Ap.Glu350Lysp.E350KQ96PC5protein_codingdeleterious(0.04)benign(0.091)TCGA-E9-A1NF-01Breastbreast invasive carcinomaFemale<65I/IIChemotherapydoxorubicinPD
MIA2SNVMissense_Mutationnovelc.994N>Ap.Glu332Lysp.E332KQ96PC5protein_codingtolerated(1)benign(0.003)TCGA-DR-A0ZM-01Cervixcervical & endocervical cancerFemale<65III/IVUnspecificCisplatinSD
MIA2SNVMissense_Mutationc.1664N>Tp.Ser555Leup.S555LQ96PC5protein_codingtolerated(1)benign(0.006)TCGA-Q1-A5R1-01Cervixcervical & endocervical cancerFemale<65I/IIUnknownUnknownSD
MIA2SNVMissense_Mutationnovelc.445N>Tp.Asp149Tyrp.D149YQ96PC5protein_codingdeleterious(0)probably_damaging(0.911)TCGA-VS-A8EK-01Cervixcervical & endocervical cancerFemale>=65I/IIChemotherapycisplatinPD
Page: 1 2 3 4 5 6 7 8 

Top

Related drugs of malignant transformation related genes

check buttonIdentification of chemicals and drugs interact with genes involved in malignant transfromation
(DGIdb 4.0)
Entrez IDSymbolCategoryInteraction TypesDrug Claim NameDrug NamePMIDs
Page: 1