
|
|||||
|
 | |
| |
| |
| |
| |
| |
|
Gene: MGST1 |
Gene summary for MGST1 |
| Gene information | Species | Human | Gene symbol | MGST1 | Gene ID | 4257 |
| Gene name | microsomal glutathione S-transferase 1 | |
| Gene Alias | GST12 | |
| Cytomap | 12p12.3 | |
| Gene Type | protein-coding | GO ID | GO:0000003 | UniProtAcc | A0A024RAX2 |
Top |
Malignant transformation analysis |
| Identification of the aberrant gene expression in precancerous and cancerous lesions by comparing the gene expression of stem-like cells in diseased tissues with normal stem cells |
| Entrez ID | Symbol | Replicates | Species | Organ | Tissue | Adj P-value | Log2FC | Malignancy |
| 4257 | MGST1 | GSM4909280 | Human | Breast | Precancer | 1.39e-03 | -8.13e-01 | 0.0305 |
| 4257 | MGST1 | GSM4909281 | Human | Breast | IDC | 8.45e-20 | -4.58e-01 | 0.21 |
| 4257 | MGST1 | GSM4909285 | Human | Breast | IDC | 4.37e-18 | -1.60e-01 | 0.21 |
| 4257 | MGST1 | GSM4909286 | Human | Breast | IDC | 6.40e-23 | -4.11e-01 | 0.1081 |
| 4257 | MGST1 | GSM4909290 | Human | Breast | IDC | 1.64e-02 | 2.35e-01 | 0.2096 |
| 4257 | MGST1 | GSM4909291 | Human | Breast | IDC | 2.53e-49 | -1.35e+00 | 0.1753 |
| 4257 | MGST1 | GSM4909293 | Human | Breast | IDC | 2.47e-14 | -3.34e-01 | 0.1581 |
| 4257 | MGST1 | GSM4909295 | Human | Breast | IDC | 1.11e-04 | -4.76e-01 | 0.0898 |
| 4257 | MGST1 | GSM4909297 | Human | Breast | IDC | 1.10e-57 | -1.16e+00 | 0.1517 |
| 4257 | MGST1 | GSM4909298 | Human | Breast | IDC | 2.04e-49 | -1.15e+00 | 0.1551 |
| 4257 | MGST1 | GSM4909299 | Human | Breast | IDC | 3.94e-04 | -7.42e-02 | 0.035 |
| 4257 | MGST1 | GSM4909301 | Human | Breast | IDC | 3.73e-32 | -9.61e-01 | 0.1577 |
| 4257 | MGST1 | GSM4909302 | Human | Breast | IDC | 2.94e-54 | -1.20e+00 | 0.1545 |
| 4257 | MGST1 | GSM4909304 | Human | Breast | IDC | 4.05e-06 | -3.82e-01 | 0.1636 |
| 4257 | MGST1 | GSM4909305 | Human | Breast | IDC | 2.35e-08 | -3.87e-01 | 0.0436 |
| 4257 | MGST1 | GSM4909306 | Human | Breast | IDC | 9.45e-18 | -5.66e-01 | 0.1564 |
| 4257 | MGST1 | GSM4909308 | Human | Breast | IDC | 1.79e-08 | 2.36e-01 | 0.158 |
| 4257 | MGST1 | GSM4909309 | Human | Breast | IDC | 4.32e-02 | -3.49e-01 | 0.0483 |
| 4257 | MGST1 | GSM4909311 | Human | Breast | IDC | 1.72e-44 | -1.04e+00 | 0.1534 |
| 4257 | MGST1 | GSM4909312 | Human | Breast | IDC | 2.30e-59 | -1.24e+00 | 0.1552 |
| Page: 1 2 3 4 5 6 7 8 9 10 11 12 13 14 |
| Tissue | Expression Dynamics | Abbreviation |
| Breast | 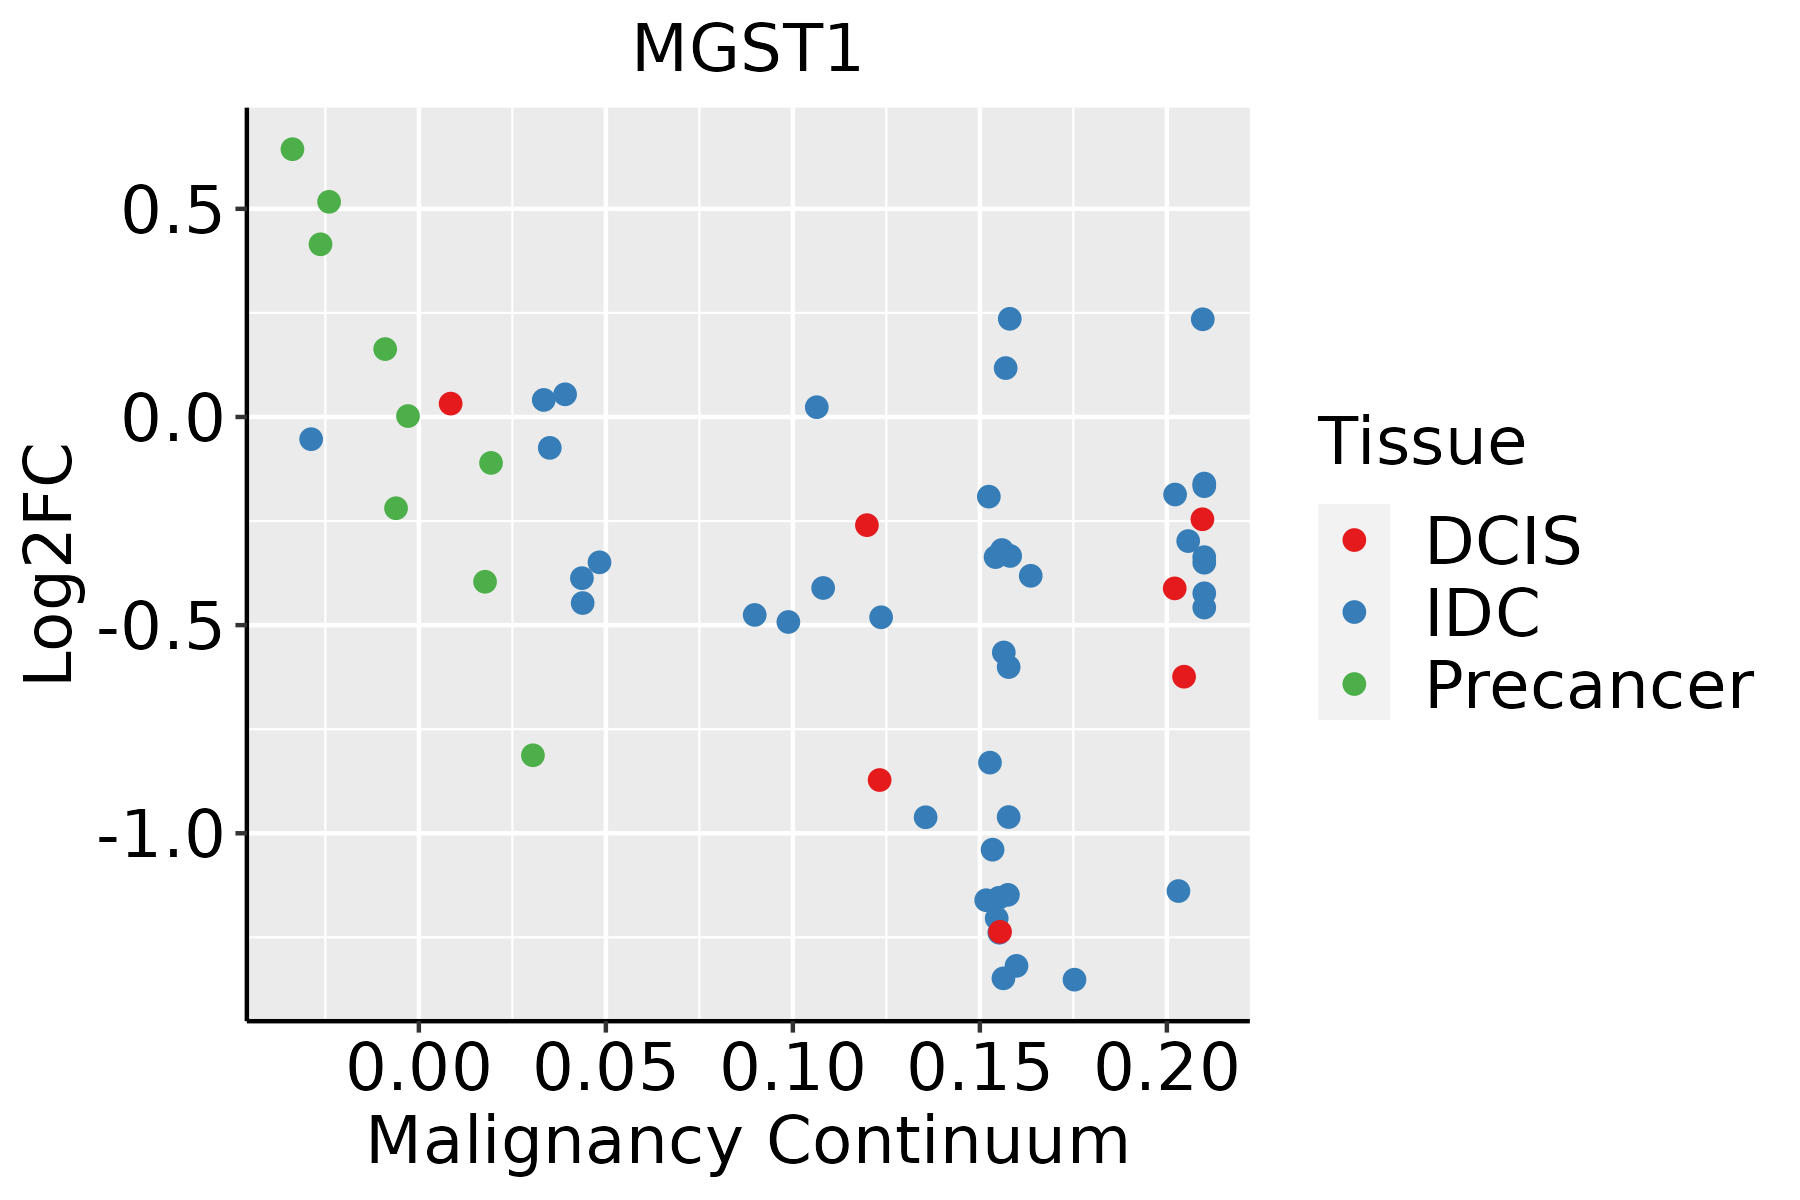 | IDC: Invasive ductal carcinoma |
| DCIS: Ductal carcinoma in situ | ||
| Precancer(BRCA1-mut): Precancerous lesion from BRCA1 mutation carriers | ||
| Cervix | 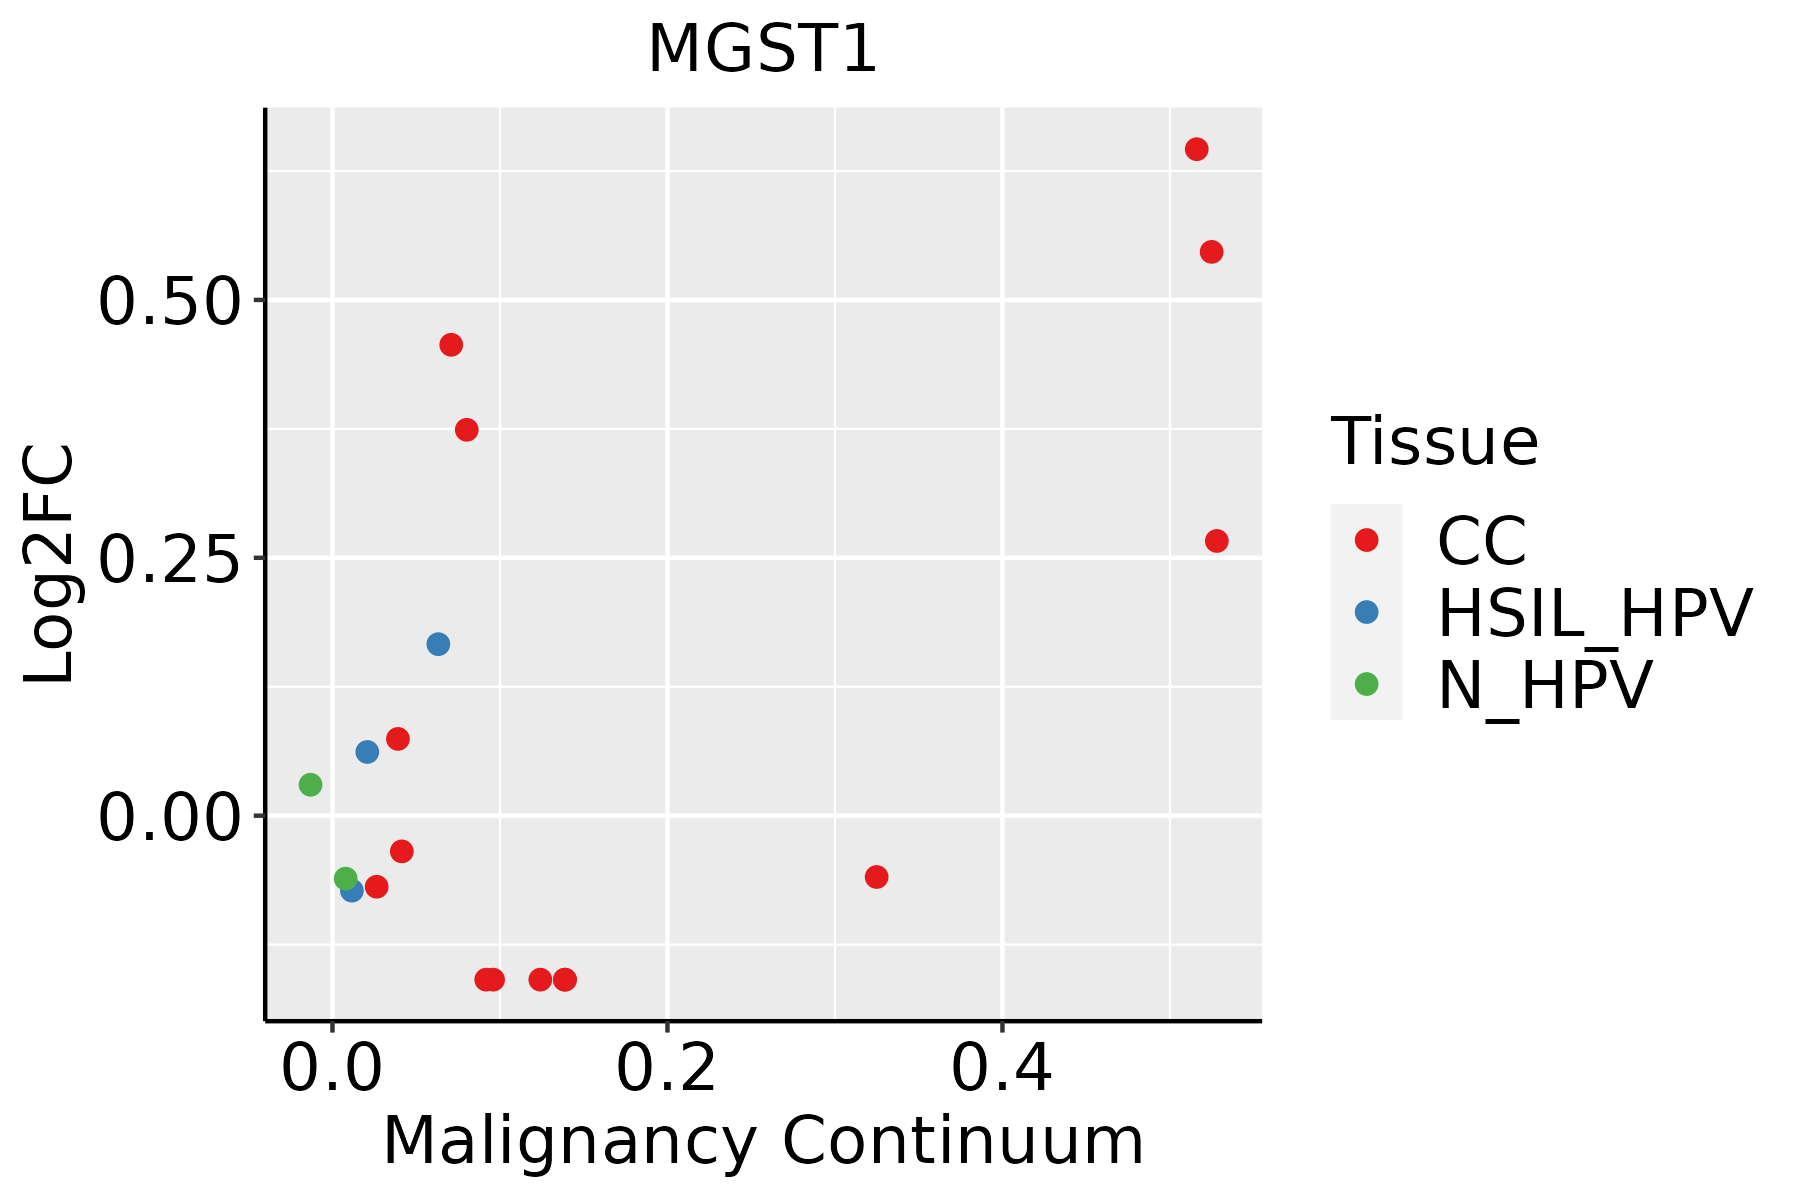 | CC: Cervix cancer |
| HSIL_HPV: HPV-infected high-grade squamous intraepithelial lesions | ||
| N_HPV: HPV-infected normal cervix | ||
| Colorectum (GSE201348) |  | FAP: Familial adenomatous polyposis |
| CRC: Colorectal cancer | ||
| Colorectum (HTA11) |  | AD: Adenomas |
| SER: Sessile serrated lesions | ||
| MSI-H: Microsatellite-high colorectal cancer | ||
| MSS: Microsatellite stable colorectal cancer | ||
| Endometrium | 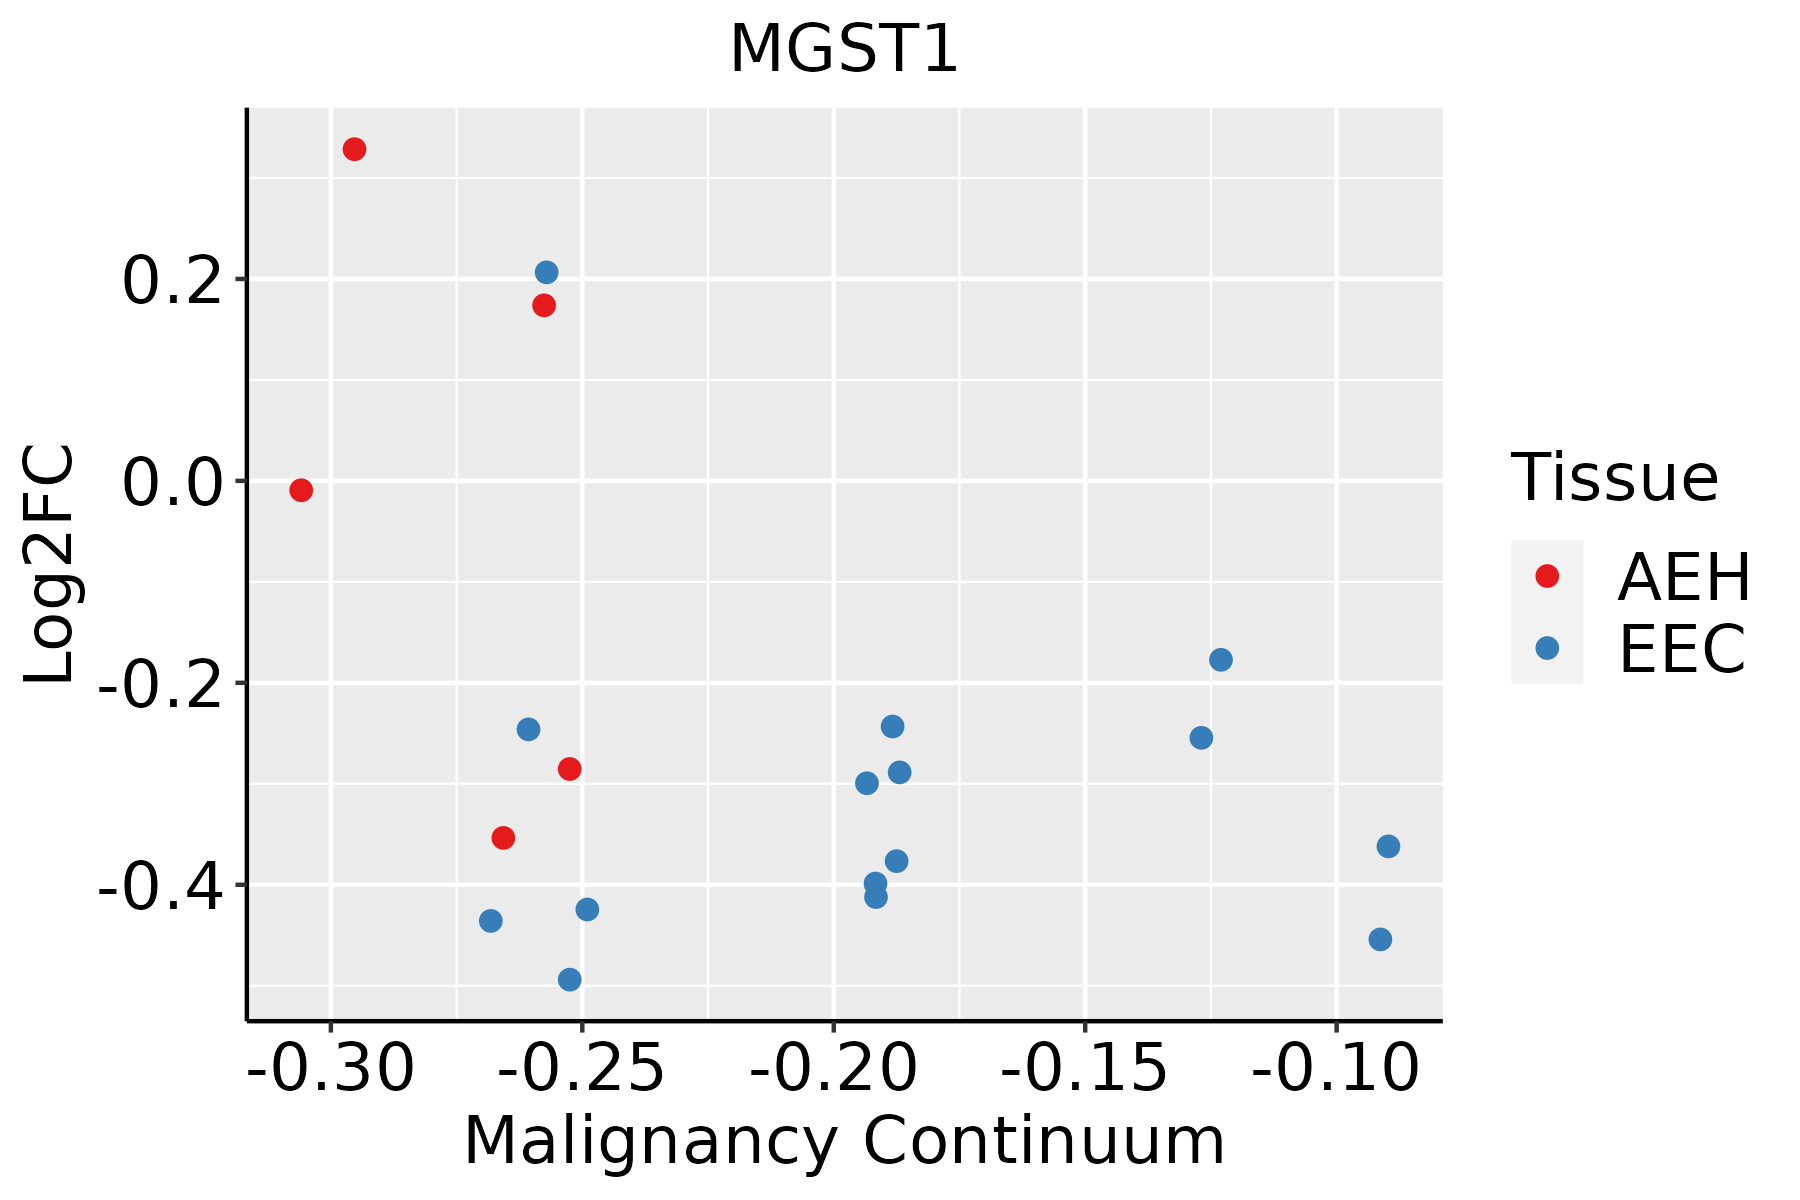 | AEH: Atypical endometrial hyperplasia |
| EEC: Endometrioid Cancer | ||
| Esophagus | 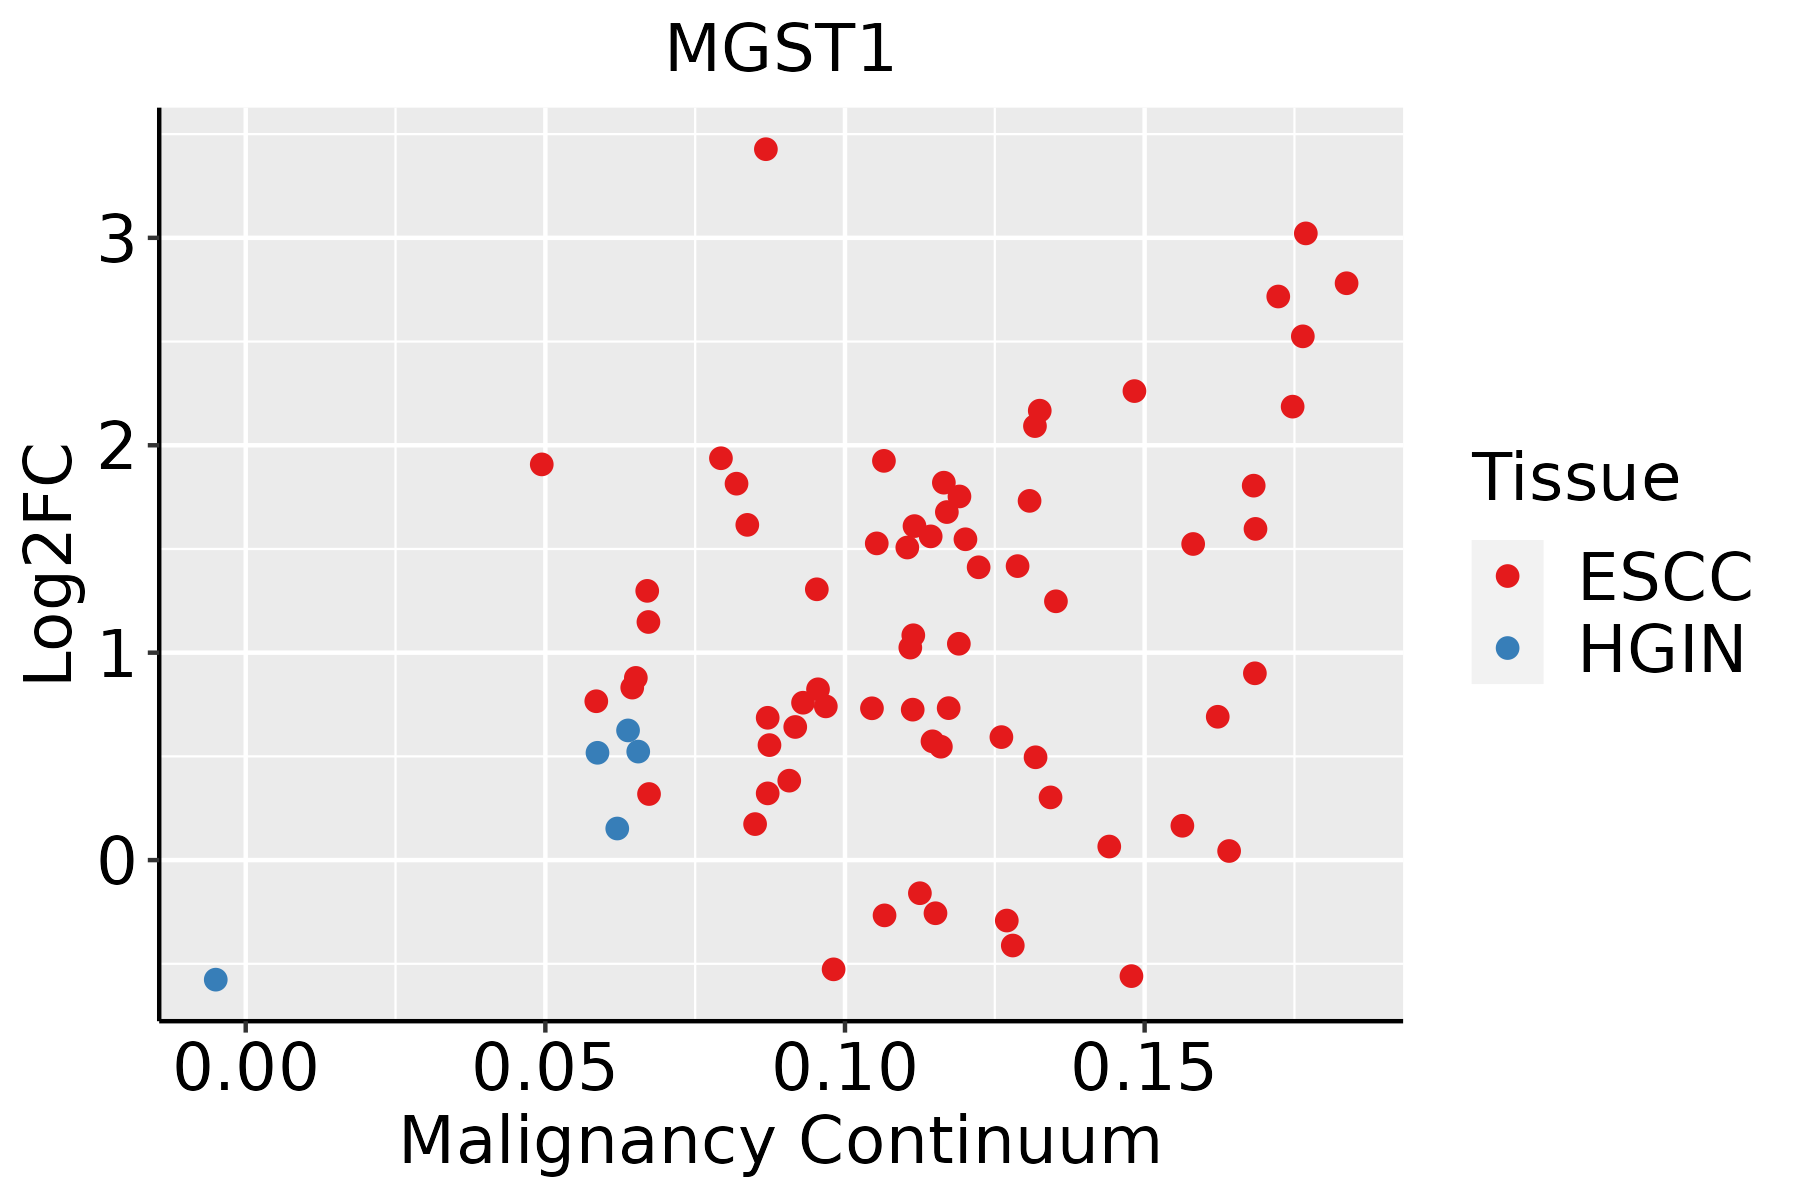 | ESCC: Esophageal squamous cell carcinoma |
| HGIN: High-grade intraepithelial neoplasias | ||
| LGIN: Low-grade intraepithelial neoplasias | ||
| GC | 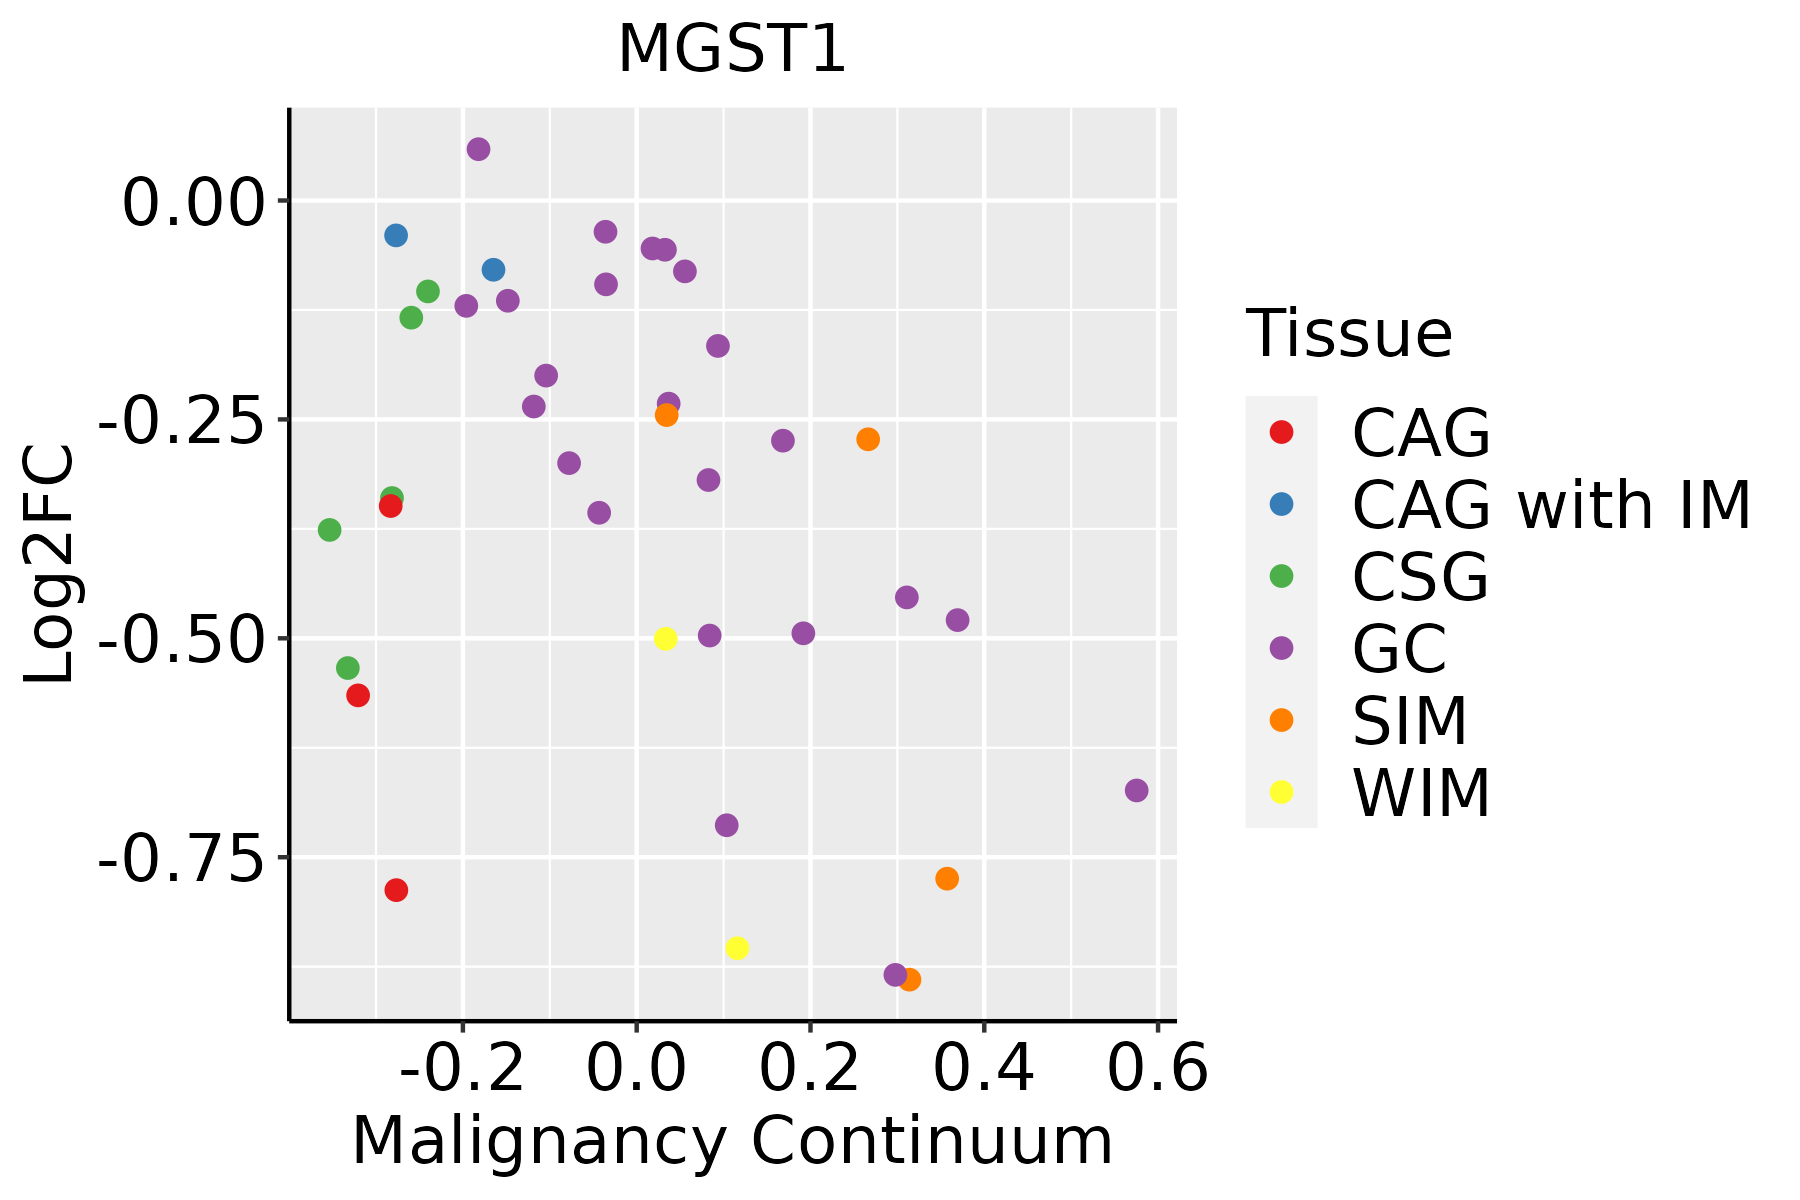 | CAG: Chronic atrophic gastritis |
| CAG with IM: Chronic atrophic gastritis with intestinal metaplasia | ||
| CSG: Chronic superficial gastritis | ||
| GC: Gastric cancer | ||
| SIM: Severe intestinal metaplasia | ||
| WIM: Wild intestinal metaplasia | ||
| Liver | 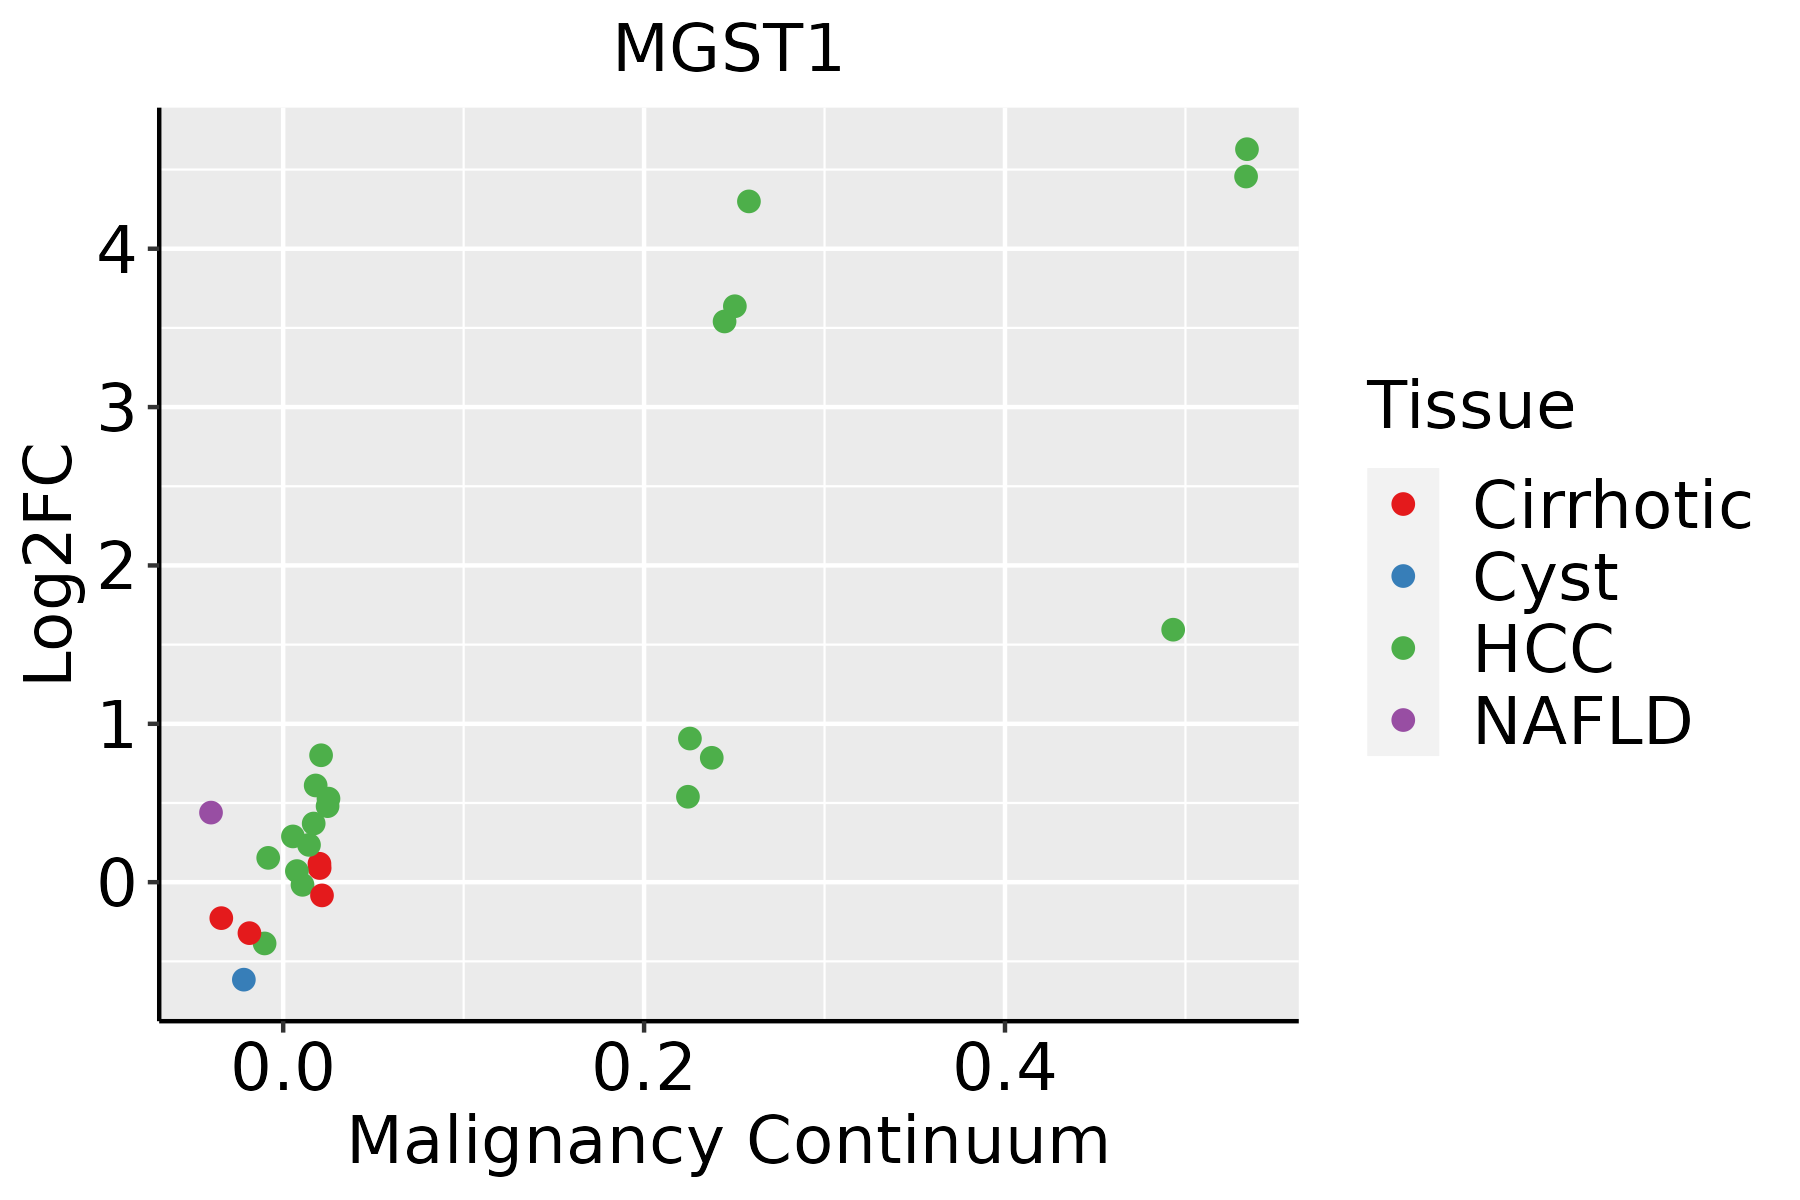 | HCC: Hepatocellular carcinoma |
| NAFLD: Non-alcoholic fatty liver disease | ||
| Lung | 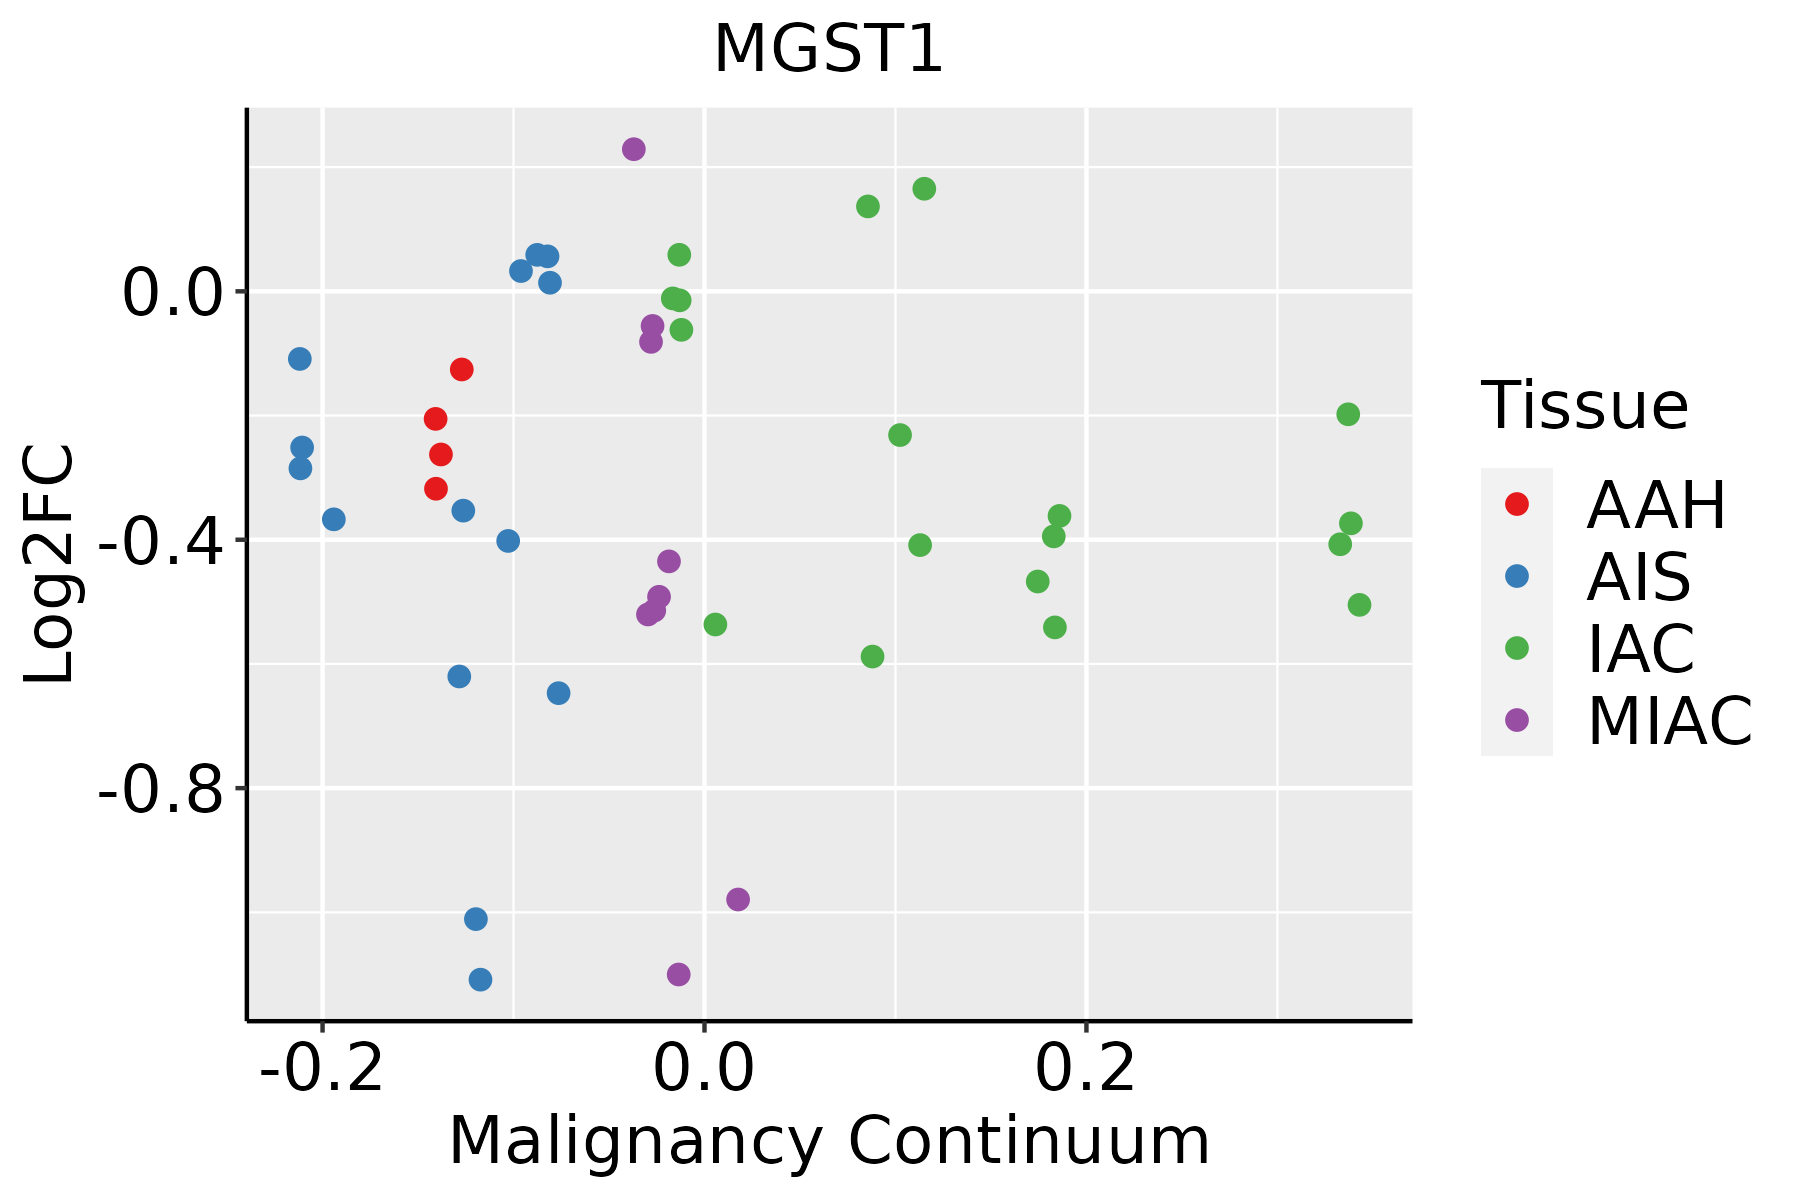 | AAH: Atypical adenomatous hyperplasia |
| AIS: Adenocarcinoma in situ | ||
| IAC: Invasive lung adenocarcinoma | ||
| MIA: Minimally invasive adenocarcinoma | ||
| Oral Cavity | 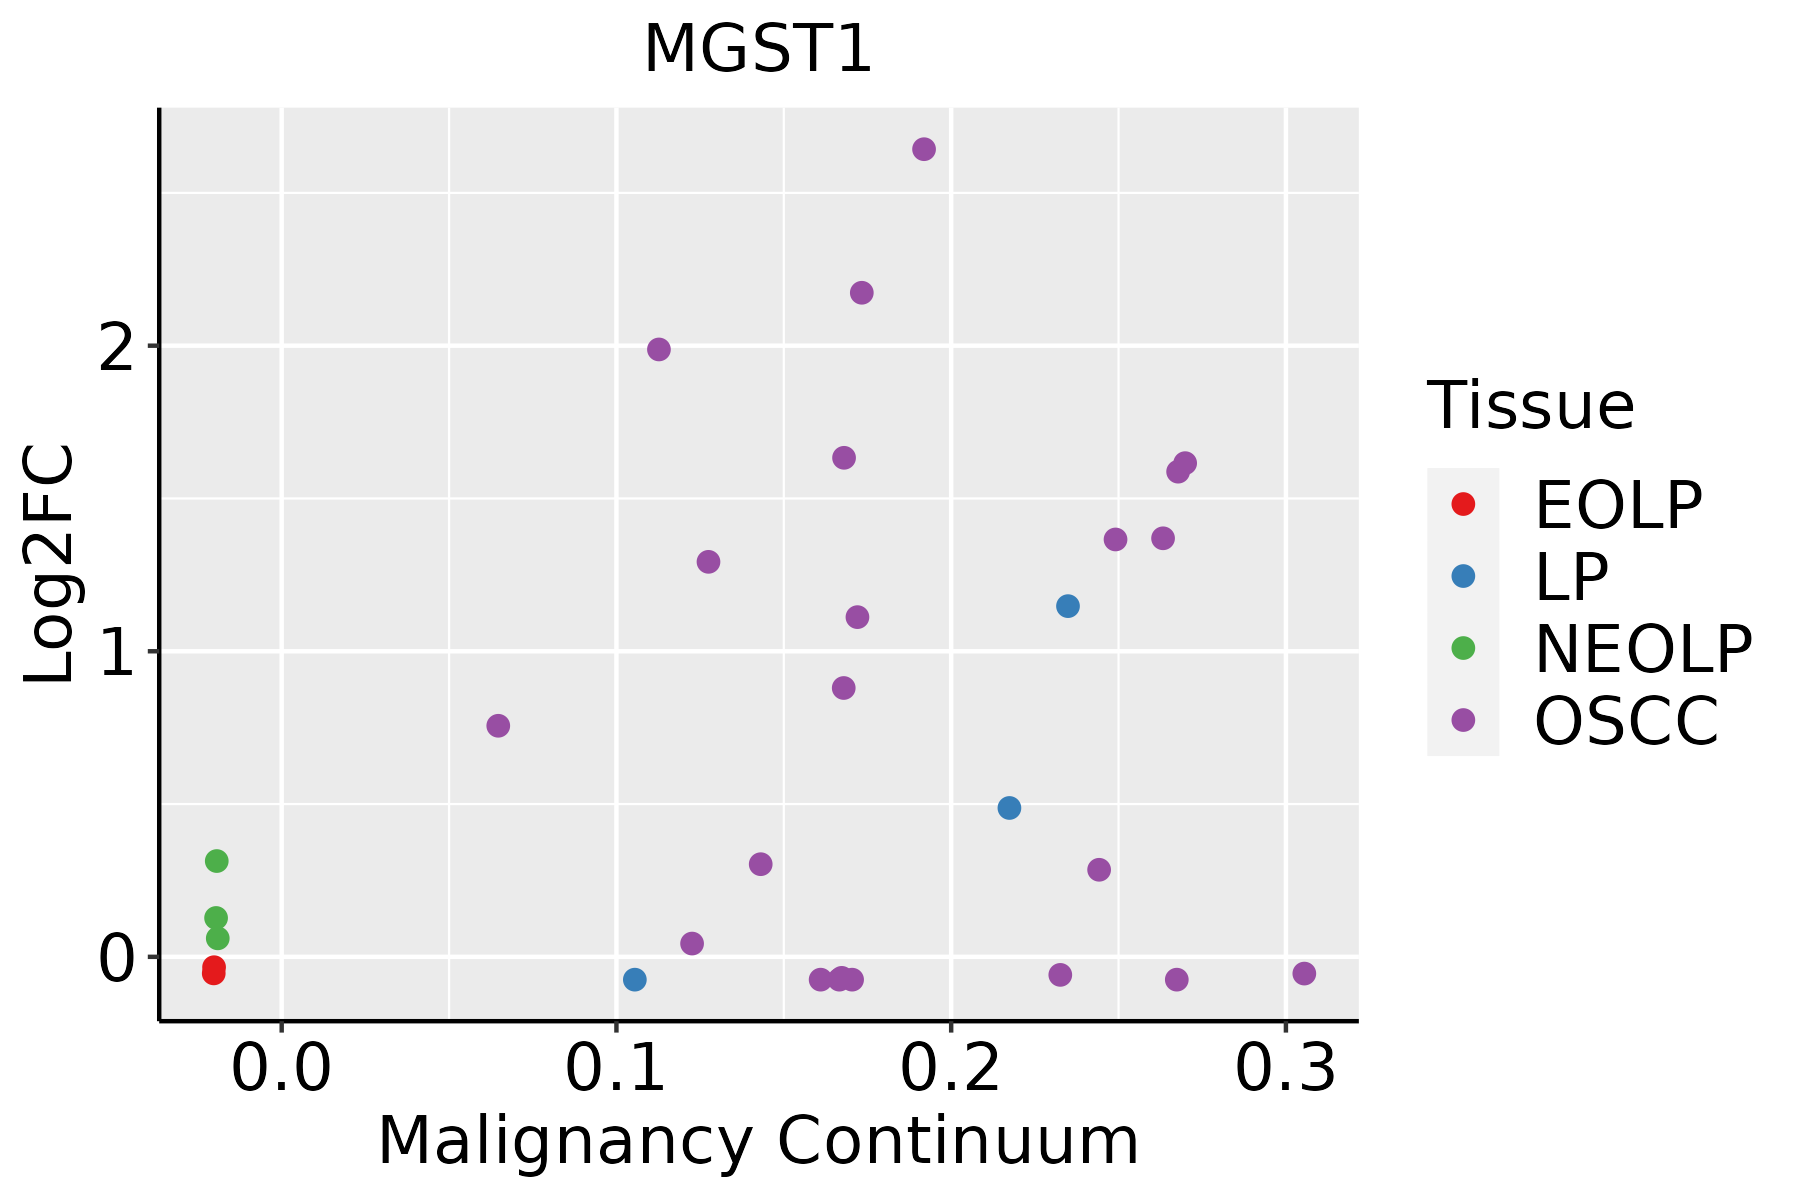 | EOLP: Erosive Oral lichen planus |
| LP: leukoplakia | ||
| NEOLP: Non-erosive oral lichen planus | ||
| OSCC: Oral squamous cell carcinoma | ||
| Prostate | 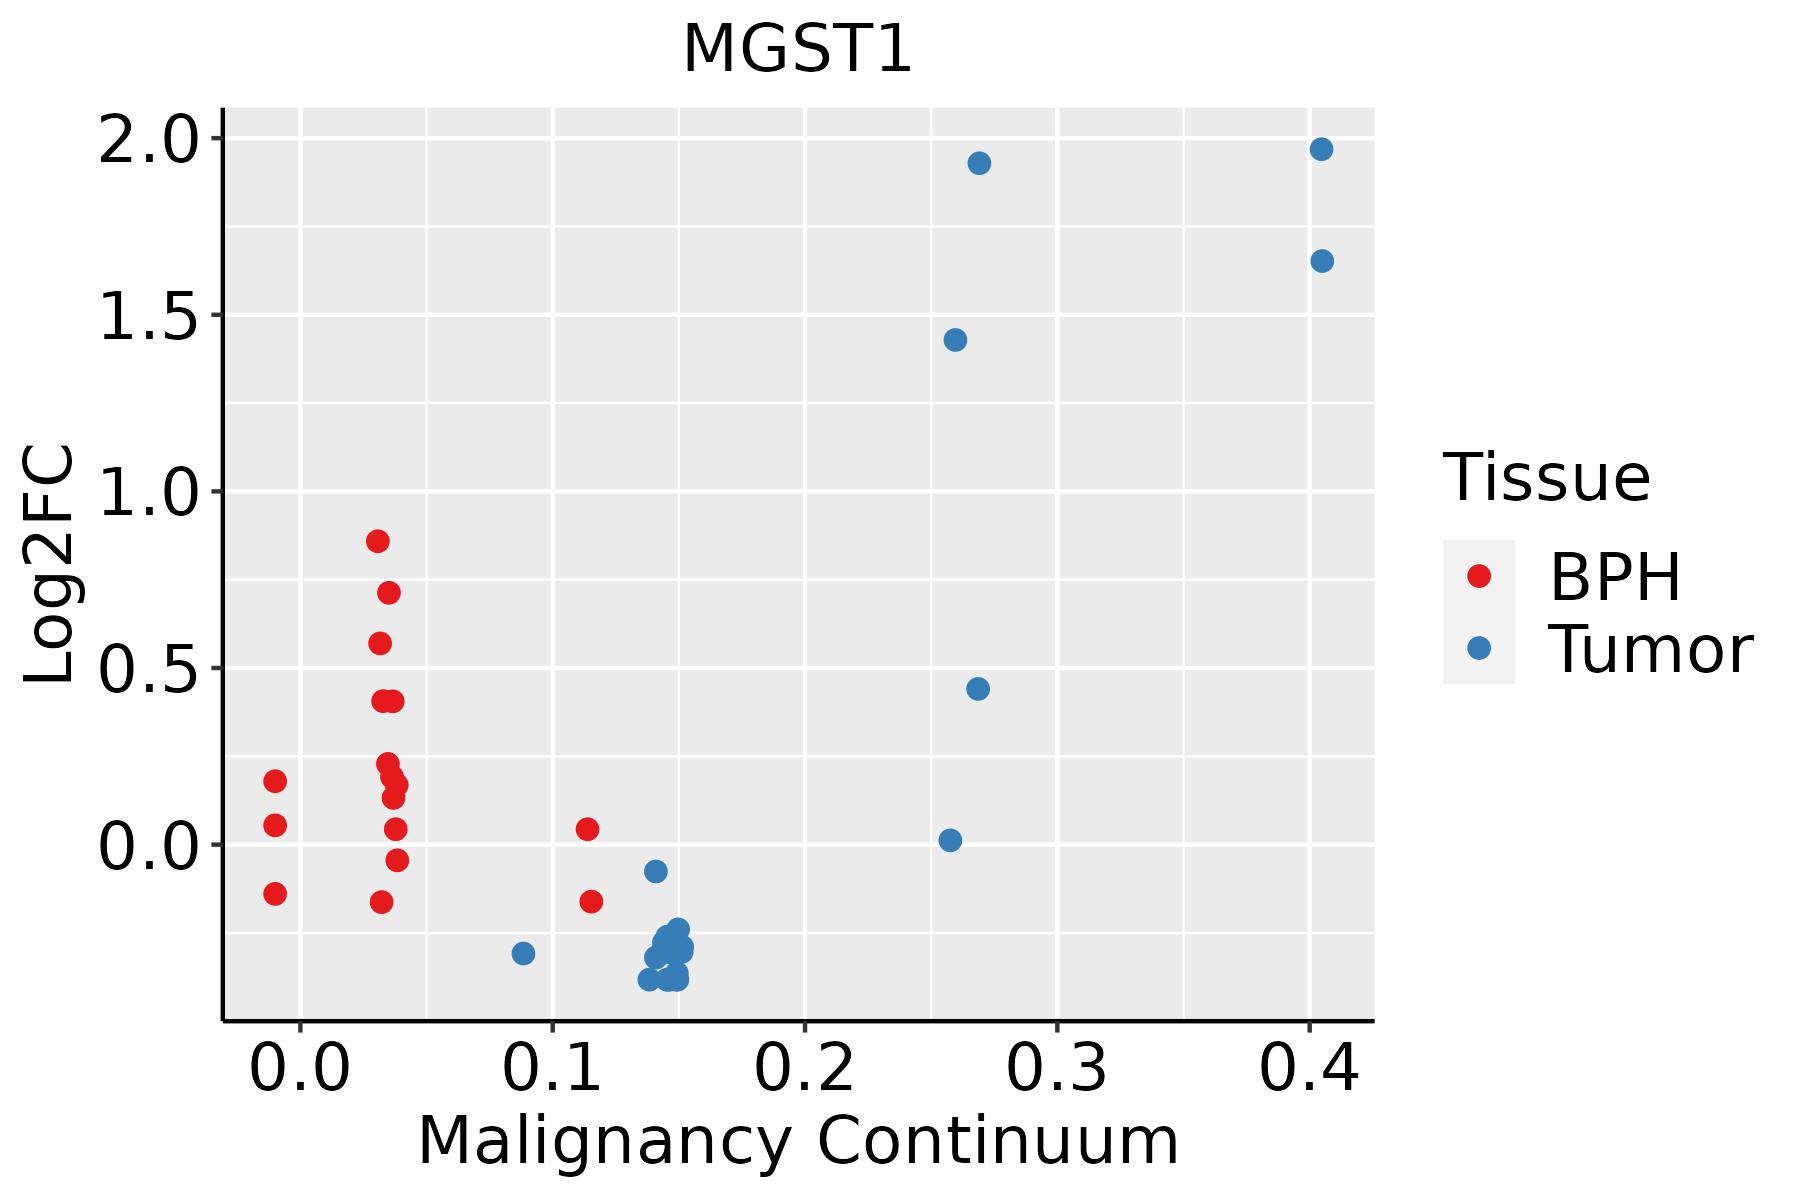 | BPH: Benign Prostatic Hyperplasia |
| Skin | 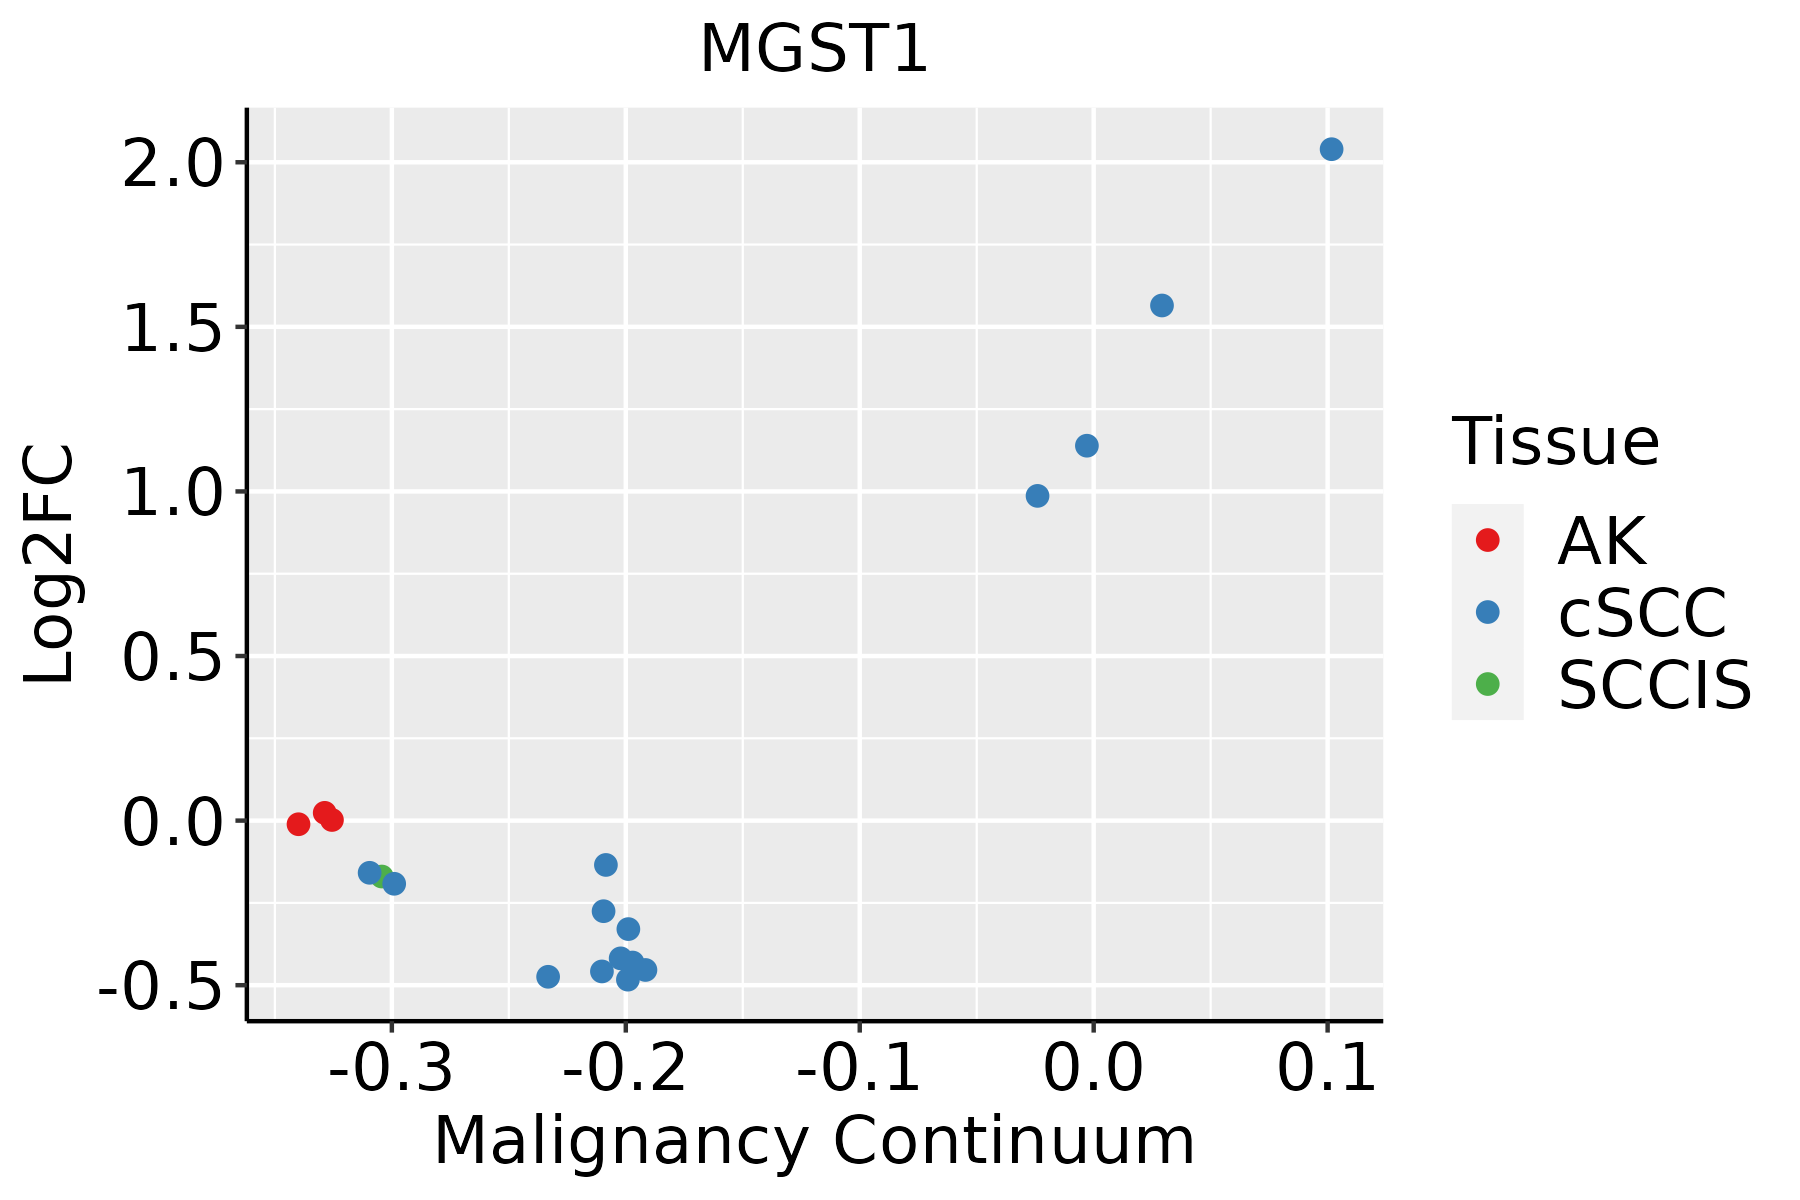 | AK: Actinic keratosis |
| cSCC: Cutaneous squamous cell carcinoma | ||
| SCCIS:squamous cell carcinoma in situ | ||
| Thyroid | 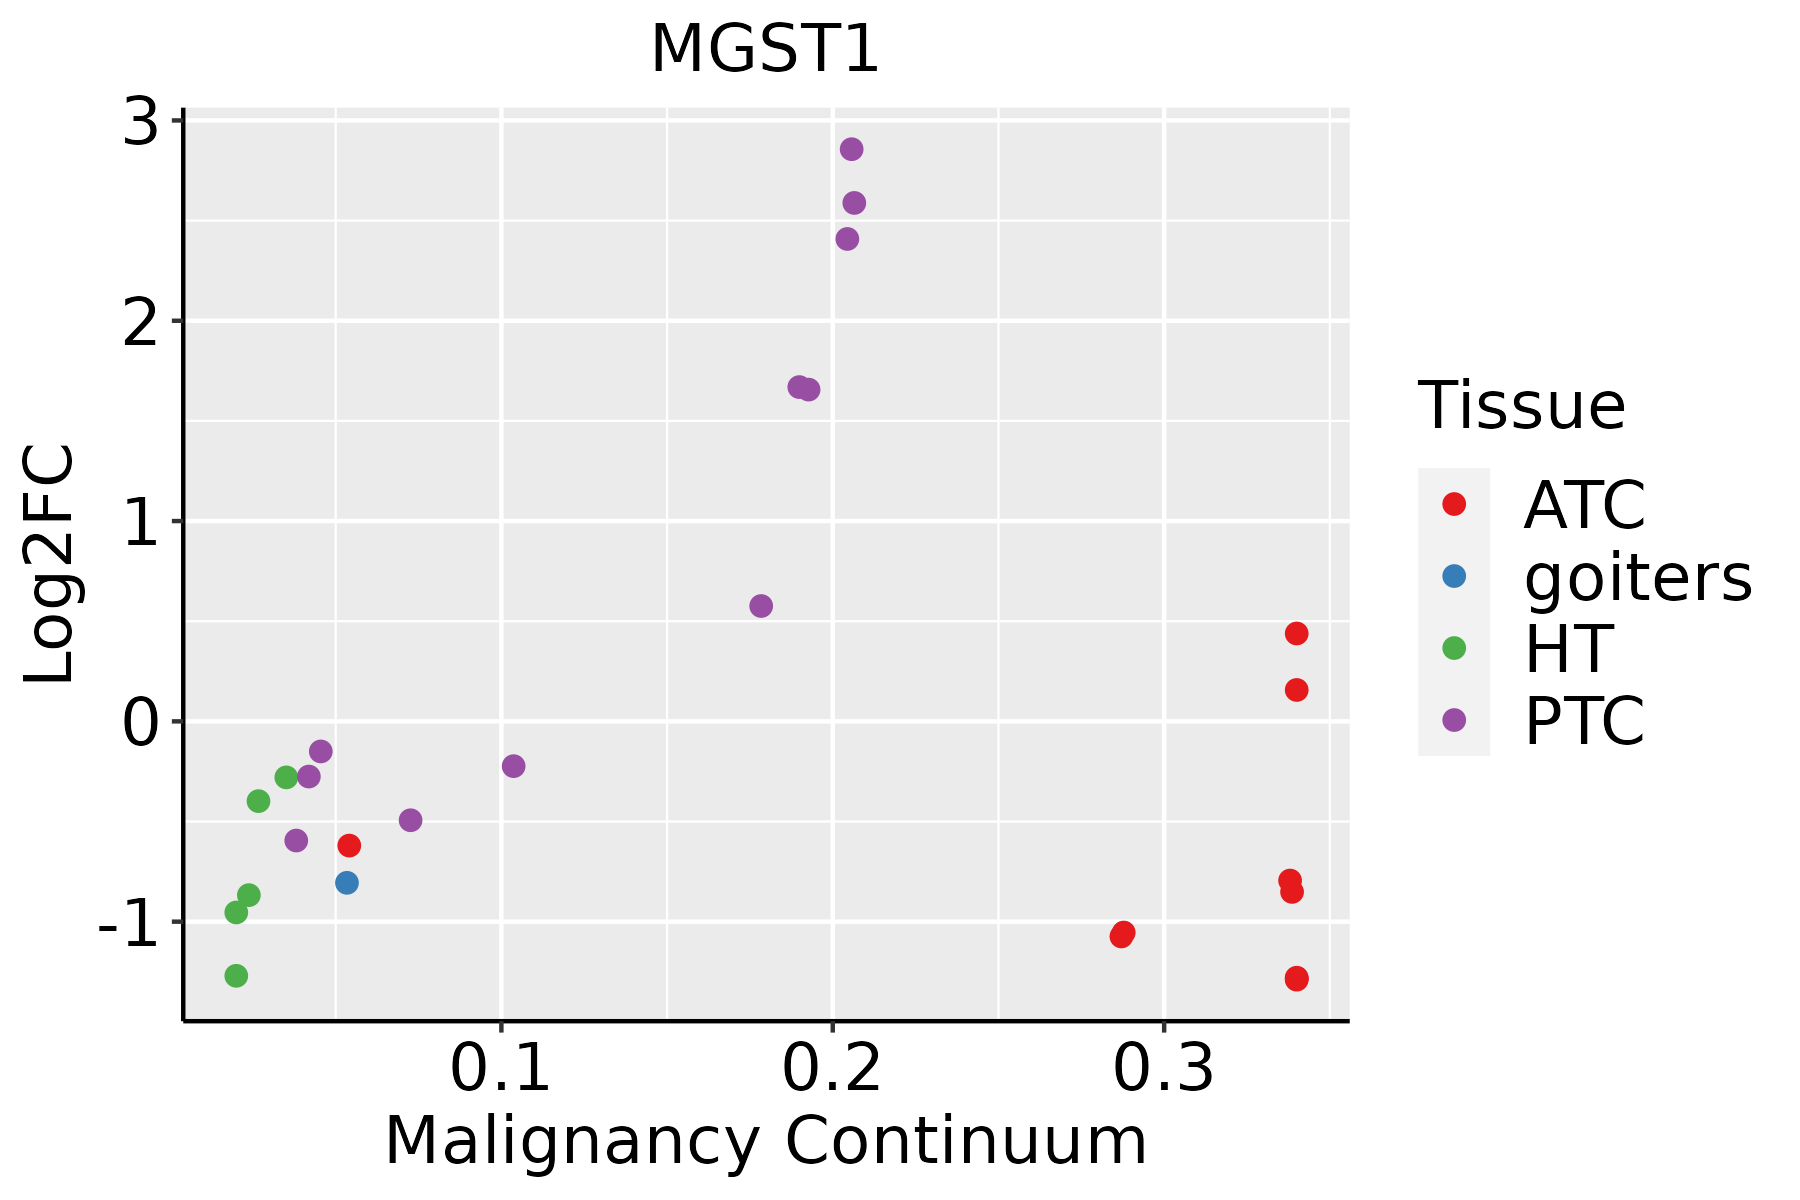 | ATC: Anaplastic thyroid cancer |
| HT: Hashimoto's thyroiditis | ||
| PTC: Papillary thyroid cancer |
| ∗log2FC in expression of this searched gene in stem-like cells from each diseased tissue sample relative to stem-like cells in normal samples in each tissue plotted against the malignancy continuum. Samples are colored based on if they are from different disease stage. |
Top |
Malignant transformation related pathway analysis |
| Find out the enriched GO biological processes and KEGG pathways involved in transition from healthy to precancer to cancer |
| Tissue | Disease Stage | Enriched GO biological Processes |
| Colorectum | AD |  |
| Colorectum | SER |  |
| Colorectum | MSS |  |
| Colorectum | MSI-H |  |
| Colorectum | FAP |  |
| ∗Top 15 enriched GO BP terms are showed in the bar plot of each disease state in each tissue. Each row represents a significant GO biological process which is colored according to the -log10(p.adjust). |
| Page: 1 2 3 4 5 6 7 8 9 |
| GO ID | Tissue | Disease Stage | Description | Gene Ratio | Bg Ratio | pvalue | p.adjust | Count |
| GO:00069799 | Breast | Precancer | response to oxidative stress | 70/1080 | 446/18723 | 1.59e-14 | 4.26e-12 | 70 |
| GO:00621979 | Breast | Precancer | cellular response to chemical stress | 51/1080 | 337/18723 | 2.40e-10 | 2.34e-08 | 51 |
| GO:00345999 | Breast | Precancer | cellular response to oxidative stress | 42/1080 | 288/18723 | 2.78e-08 | 1.79e-06 | 42 |
| GO:00988698 | Breast | Precancer | cellular oxidant detoxification | 20/1080 | 101/18723 | 1.07e-06 | 4.18e-05 | 20 |
| GO:19907488 | Breast | Precancer | cellular detoxification | 21/1080 | 116/18723 | 2.67e-06 | 8.89e-05 | 21 |
| GO:00022378 | Breast | Precancer | response to molecule of bacterial origin | 43/1080 | 363/18723 | 6.05e-06 | 1.72e-04 | 43 |
| GO:00987548 | Breast | Precancer | detoxification | 24/1080 | 152/18723 | 6.49e-06 | 1.81e-04 | 24 |
| GO:00324968 | Breast | Precancer | response to lipopolysaccharide | 41/1080 | 343/18723 | 7.94e-06 | 2.17e-04 | 41 |
| GO:00972378 | Breast | Precancer | cellular response to toxic substance | 21/1080 | 124/18723 | 7.98e-06 | 2.17e-04 | 21 |
| GO:00096368 | Breast | Precancer | response to toxic substance | 31/1080 | 262/18723 | 1.18e-04 | 2.12e-03 | 31 |
| GO:00486087 | Breast | Precancer | reproductive structure development | 43/1080 | 424/18723 | 2.36e-04 | 3.56e-03 | 43 |
| GO:00614587 | Breast | Precancer | reproductive system development | 43/1080 | 427/18723 | 2.75e-04 | 4.00e-03 | 43 |
| GO:00094108 | Breast | Precancer | response to xenobiotic stimulus | 45/1080 | 462/18723 | 4.17e-04 | 5.56e-03 | 45 |
| GO:00158336 | Breast | Precancer | peptide transport | 27/1080 | 264/18723 | 2.84e-03 | 2.49e-02 | 27 |
| GO:0046661 | Breast | Precancer | male sex differentiation | 19/1080 | 165/18723 | 3.14e-03 | 2.65e-02 | 19 |
| GO:0008584 | Breast | Precancer | male gonad development | 17/1080 | 141/18723 | 3.15e-03 | 2.65e-02 | 17 |
| GO:0046546 | Breast | Precancer | development of primary male sexual characteristics | 17/1080 | 142/18723 | 3.39e-03 | 2.84e-02 | 17 |
| GO:000697914 | Breast | IDC | response to oxidative stress | 83/1434 | 446/18723 | 2.36e-14 | 7.06e-12 | 83 |
| GO:006219714 | Breast | IDC | cellular response to chemical stress | 55/1434 | 337/18723 | 7.07e-08 | 4.36e-06 | 55 |
| GO:000963613 | Breast | IDC | response to toxic substance | 44/1434 | 262/18723 | 6.33e-07 | 3.00e-05 | 44 |
| Page: 1 2 3 4 5 6 7 8 9 10 11 12 13 14 15 16 17 18 19 20 |
| Pathway ID | Tissue | Disease Stage | Description | Gene Ratio | Bg Ratio | pvalue | p.adjust | qvalue | Count |
| hsa0520818 | Breast | Precancer | Chemical carcinogenesis - reactive oxygen species | 68/684 | 223/8465 | 3.61e-23 | 1.14e-21 | 8.73e-22 | 68 |
| hsa0541818 | Breast | Precancer | Fluid shear stress and atherosclerosis | 28/684 | 139/8465 | 4.74e-06 | 6.00e-05 | 4.59e-05 | 28 |
| hsa0048010 | Breast | Precancer | Glutathione metabolism | 12/684 | 57/8465 | 1.68e-03 | 1.08e-02 | 8.30e-03 | 12 |
| hsa0520819 | Breast | Precancer | Chemical carcinogenesis - reactive oxygen species | 68/684 | 223/8465 | 3.61e-23 | 1.14e-21 | 8.73e-22 | 68 |
| hsa0541819 | Breast | Precancer | Fluid shear stress and atherosclerosis | 28/684 | 139/8465 | 4.74e-06 | 6.00e-05 | 4.59e-05 | 28 |
| hsa0048013 | Breast | Precancer | Glutathione metabolism | 12/684 | 57/8465 | 1.68e-03 | 1.08e-02 | 8.30e-03 | 12 |
| hsa0520824 | Breast | IDC | Chemical carcinogenesis - reactive oxygen species | 71/867 | 223/8465 | 2.55e-19 | 7.53e-18 | 5.63e-18 | 71 |
| hsa0541824 | Breast | IDC | Fluid shear stress and atherosclerosis | 34/867 | 139/8465 | 9.41e-07 | 1.61e-05 | 1.20e-05 | 34 |
| hsa0048023 | Breast | IDC | Glutathione metabolism | 13/867 | 57/8465 | 4.25e-03 | 2.56e-02 | 1.91e-02 | 13 |
| hsa0520834 | Breast | IDC | Chemical carcinogenesis - reactive oxygen species | 71/867 | 223/8465 | 2.55e-19 | 7.53e-18 | 5.63e-18 | 71 |
| hsa0541834 | Breast | IDC | Fluid shear stress and atherosclerosis | 34/867 | 139/8465 | 9.41e-07 | 1.61e-05 | 1.20e-05 | 34 |
| hsa0048033 | Breast | IDC | Glutathione metabolism | 13/867 | 57/8465 | 4.25e-03 | 2.56e-02 | 1.91e-02 | 13 |
| hsa0520843 | Breast | DCIS | Chemical carcinogenesis - reactive oxygen species | 70/846 | 223/8465 | 2.82e-19 | 8.29e-18 | 6.10e-18 | 70 |
| hsa0541844 | Breast | DCIS | Fluid shear stress and atherosclerosis | 34/846 | 139/8465 | 5.31e-07 | 9.03e-06 | 6.65e-06 | 34 |
| hsa0048041 | Breast | DCIS | Glutathione metabolism | 13/846 | 57/8465 | 3.44e-03 | 1.98e-02 | 1.46e-02 | 13 |
| hsa0520853 | Breast | DCIS | Chemical carcinogenesis - reactive oxygen species | 70/846 | 223/8465 | 2.82e-19 | 8.29e-18 | 6.10e-18 | 70 |
| hsa0541854 | Breast | DCIS | Fluid shear stress and atherosclerosis | 34/846 | 139/8465 | 5.31e-07 | 9.03e-06 | 6.65e-06 | 34 |
| hsa0048051 | Breast | DCIS | Glutathione metabolism | 13/846 | 57/8465 | 3.44e-03 | 1.98e-02 | 1.46e-02 | 13 |
| hsa0520820 | Cervix | CC | Chemical carcinogenesis - reactive oxygen species | 92/1267 | 223/8465 | 4.71e-22 | 5.09e-20 | 3.01e-20 | 92 |
| hsa0541820 | Cervix | CC | Fluid shear stress and atherosclerosis | 50/1267 | 139/8465 | 5.71e-10 | 1.32e-08 | 7.81e-09 | 50 |
| Page: 1 2 3 4 5 6 7 8 9 |
Top |
Cell-cell communication analysis |
| Identification of potential cell-cell interactions between two cell types and their ligand-receptor pairs for different disease states |
| Ligand | Receptor | LRpair | Pathway | Tissue | Disease Stage |
| Page: 1 |
Top |
Single-cell gene regulatory network inference analysis |
| Find out the significant the regulons (TFs) and the target genes of each regulon across cell types for different disease states |
| TF | Cell Type | Tissue | Disease Stage | Target Gene | RSS | Regulon Activity |
| ∗The dot plots of a searched regulon are shown for all cell subpopulations in each disease state of each tissue based on the regulon specific score inferred using pySCENIC and by calculating the average expression. |
| Page: 1 |
Top |
Somatic mutation of malignant transformation related genes |
| Annotation of somatic variants for genes involved in malignant transformation |
| Hugo Symbol | Variant Class | Variant Classification | dbSNP RS | HGVSc | HGVSp | HGVSp Short | SWISSPROT | BIOTYPE | SIFT | PolyPhen | Tumor Sample Barcode | Tissue | Histology | Sex | Age | Stage | Therapy Types | Drugs | Outcome |
| MGST1 | SNV | Missense_Mutation | c.308N>T | p.Ala103Val | p.A103V | P10620 | protein_coding | tolerated(0.05) | possibly_damaging(0.815) | TCGA-AA-3715-01 | Colorectum | colon adenocarcinoma | Male | >=65 | I/II | Unknown | Unknown | PD | |
| MGST1 | SNV | Missense_Mutation | novel | c.35N>A | p.Val12Glu | p.V12E | P10620 | protein_coding | deleterious(0.04) | benign(0.388) | TCGA-AA-3862-01 | Colorectum | colon adenocarcinoma | Male | >=65 | I/II | Unknown | Unknown | SD |
| MGST1 | SNV | Missense_Mutation | rs762233825 | c.200N>G | p.Asp67Gly | p.D67G | P10620 | protein_coding | tolerated(0.09) | benign(0.122) | TCGA-AA-3984-01 | Colorectum | colon adenocarcinoma | Female | <65 | I/II | Unknown | Unknown | SD |
| MGST1 | SNV | Missense_Mutation | rs764640311 | c.191N>A | p.Arg64Gln | p.R64Q | P10620 | protein_coding | tolerated(0.22) | benign(0.022) | TCGA-F5-6814-01 | Colorectum | rectum adenocarcinoma | Male | <65 | I/II | Unknown | Unknown | SD |
| MGST1 | deletion | Frame_Shift_Del | c.399delN | p.Phe135LeufsTer15 | p.F135Lfs*15 | P10620 | protein_coding | TCGA-AA-3811-01 | Colorectum | colon adenocarcinoma | Female | >=65 | III/IV | Unknown | Unknown | PD | |||
| MGST1 | deletion | Frame_Shift_Del | c.399delN | p.Phe135LeufsTer15 | p.F135Lfs*15 | P10620 | protein_coding | TCGA-AA-A022-01 | Colorectum | colon adenocarcinoma | Female | >=65 | I/II | Unknown | Unknown | SD | |||
| MGST1 | SNV | Missense_Mutation | novel | c.289G>A | p.Gly97Ser | p.G97S | P10620 | protein_coding | deleterious(0.01) | possibly_damaging(0.506) | TCGA-A5-A1OF-01 | Endometrium | uterine corpus endometrioid carcinoma | Female | <65 | I/II | Unknown | Unknown | SD |
| MGST1 | SNV | Missense_Mutation | novel | c.253N>A | p.Pro85Thr | p.P85T | P10620 | protein_coding | deleterious(0) | probably_damaging(0.997) | TCGA-A5-A2K5-01 | Endometrium | uterine corpus endometrioid carcinoma | Female | >=65 | I/II | Unknown | Unknown | SD |
| MGST1 | SNV | Missense_Mutation | c.154G>T | p.Ala52Ser | p.A52S | P10620 | protein_coding | tolerated(1) | benign(0.001) | TCGA-AP-A056-01 | Endometrium | uterine corpus endometrioid carcinoma | Female | <65 | I/II | Unknown | Unknown | SD | |
| MGST1 | SNV | Missense_Mutation | rs764640311 | c.191G>A | p.Arg64Gln | p.R64Q | P10620 | protein_coding | tolerated(0.22) | benign(0.022) | TCGA-B5-A11N-01 | Endometrium | uterine corpus endometrioid carcinoma | Female | >=65 | I/II | Unknown | Unknown | SD |
| Page: 1 2 3 |
Top |
Related drugs of malignant transformation related genes |
| Identification of chemicals and drugs interact with genes involved in malignant transfromation |
| (DGIdb 4.0) |
| Entrez ID | Symbol | Category | Interaction Types | Drug Claim Name | Drug Name | PMIDs |
| Page: 1 |

Copyright 2023-Present -The University of Texas Health Science Center at Houston |