
|
|||||
|
 | |
| |
| |
| |
| |
| |
|
Gene: MGP |
Gene summary for MGP |
| Gene information | Species | Human | Gene symbol | MGP | Gene ID | 4256 |
| Gene name | matrix Gla protein | |
| Gene Alias | GIG36 | |
| Cytomap | 12p12.3 | |
| Gene Type | protein-coding | GO ID | GO:0001501 | UniProtAcc | A0A024RAX0 |
Top |
Malignant transformation analysis |
| Identification of the aberrant gene expression in precancerous and cancerous lesions by comparing the gene expression of stem-like cells in diseased tissues with normal stem cells |
| Entrez ID | Symbol | Replicates | Species | Organ | Tissue | Adj P-value | Log2FC | Malignancy |
| 4256 | MGP | GSM4909277 | Human | Breast | Precancer | 4.44e-02 | -8.88e-01 | 0.0177 |
| 4256 | MGP | GSM4909280 | Human | Breast | Precancer | 8.53e-05 | 5.57e-01 | 0.0305 |
| 4256 | MGP | GSM4909282 | Human | Breast | IDC | 1.01e-40 | -1.09e+00 | -0.0288 |
| 4256 | MGP | GSM4909285 | Human | Breast | IDC | 4.86e-06 | 1.01e-01 | 0.21 |
| 4256 | MGP | GSM4909286 | Human | Breast | IDC | 2.45e-10 | -1.26e-01 | 0.1081 |
| 4256 | MGP | GSM4909288 | Human | Breast | IDC | 8.14e-03 | 3.87e-02 | 0.0988 |
| 4256 | MGP | GSM4909289 | Human | Breast | IDC | 7.56e-05 | 6.02e-01 | 0.1064 |
| 4256 | MGP | GSM4909291 | Human | Breast | IDC | 8.94e-34 | -1.31e+00 | 0.1753 |
| 4256 | MGP | GSM4909292 | Human | Breast | IDC | 3.79e-02 | -7.79e-01 | 0.1236 |
| 4256 | MGP | GSM4909293 | Human | Breast | IDC | 1.58e-07 | 2.92e-01 | 0.1581 |
| 4256 | MGP | GSM4909294 | Human | Breast | IDC | 9.02e-19 | -7.20e-01 | 0.2022 |
| 4256 | MGP | GSM4909295 | Human | Breast | IDC | 5.34e-04 | 4.16e-01 | 0.0898 |
| 4256 | MGP | GSM4909297 | Human | Breast | IDC | 3.19e-50 | -1.06e+00 | 0.1517 |
| 4256 | MGP | GSM4909299 | Human | Breast | IDC | 4.37e-132 | 1.09e+00 | 0.035 |
| 4256 | MGP | GSM4909300 | Human | Breast | IDC | 2.70e-45 | 9.40e-01 | 0.0334 |
| 4256 | MGP | GSM4909301 | Human | Breast | IDC | 1.33e-43 | -1.11e+00 | 0.1577 |
| 4256 | MGP | GSM4909304 | Human | Breast | IDC | 1.10e-42 | -1.13e+00 | 0.1636 |
| 4256 | MGP | GSM4909305 | Human | Breast | IDC | 6.25e-49 | 8.46e-01 | 0.0436 |
| 4256 | MGP | GSM4909306 | Human | Breast | IDC | 3.85e-29 | 5.79e-01 | 0.1564 |
| 4256 | MGP | GSM4909308 | Human | Breast | IDC | 4.15e-06 | -2.19e-01 | 0.158 |
| Page: 1 2 3 4 5 6 7 |
| Tissue | Expression Dynamics | Abbreviation |
| Breast |  | IDC: Invasive ductal carcinoma |
| DCIS: Ductal carcinoma in situ | ||
| Precancer(BRCA1-mut): Precancerous lesion from BRCA1 mutation carriers | ||
| Endometrium | 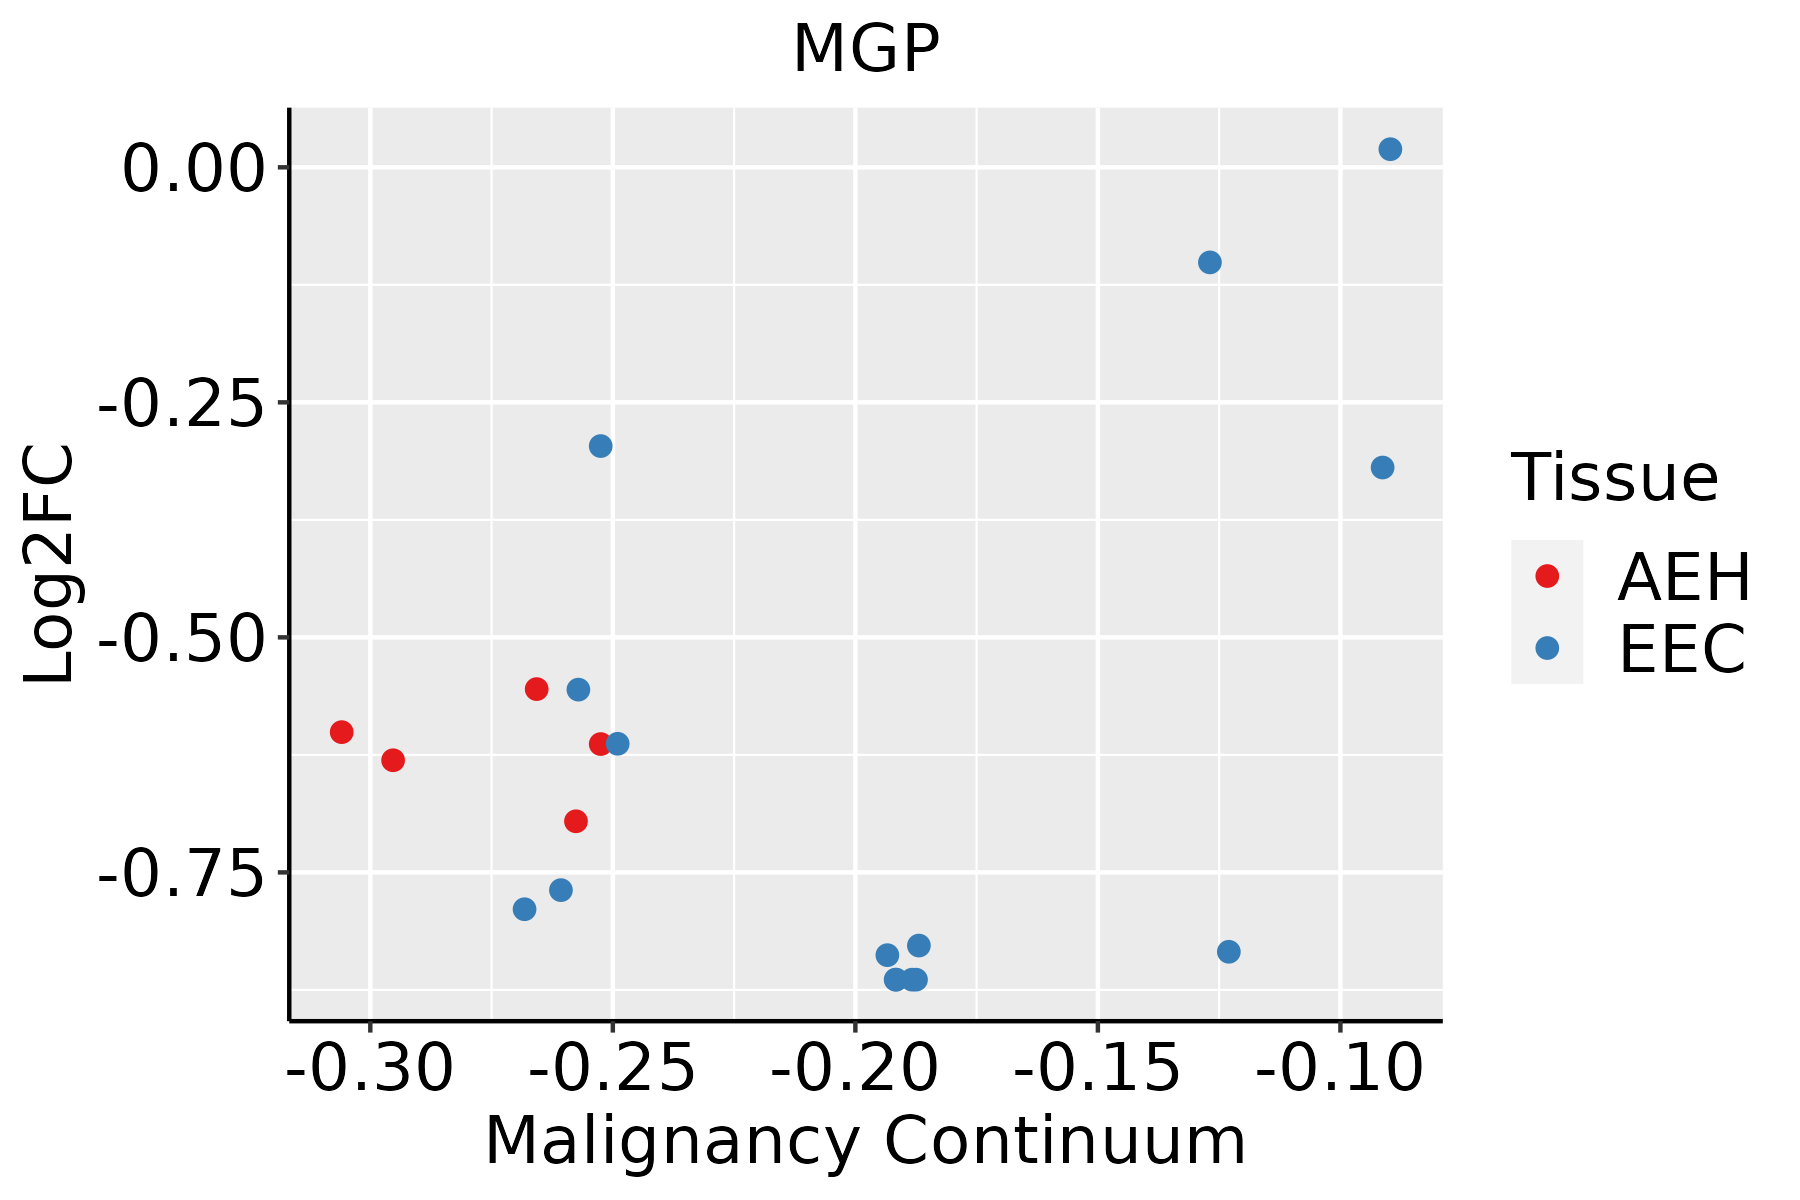 | AEH: Atypical endometrial hyperplasia |
| EEC: Endometrioid Cancer | ||
| Esophagus |  | ESCC: Esophageal squamous cell carcinoma |
| HGIN: High-grade intraepithelial neoplasias | ||
| LGIN: Low-grade intraepithelial neoplasias | ||
| Oral Cavity | 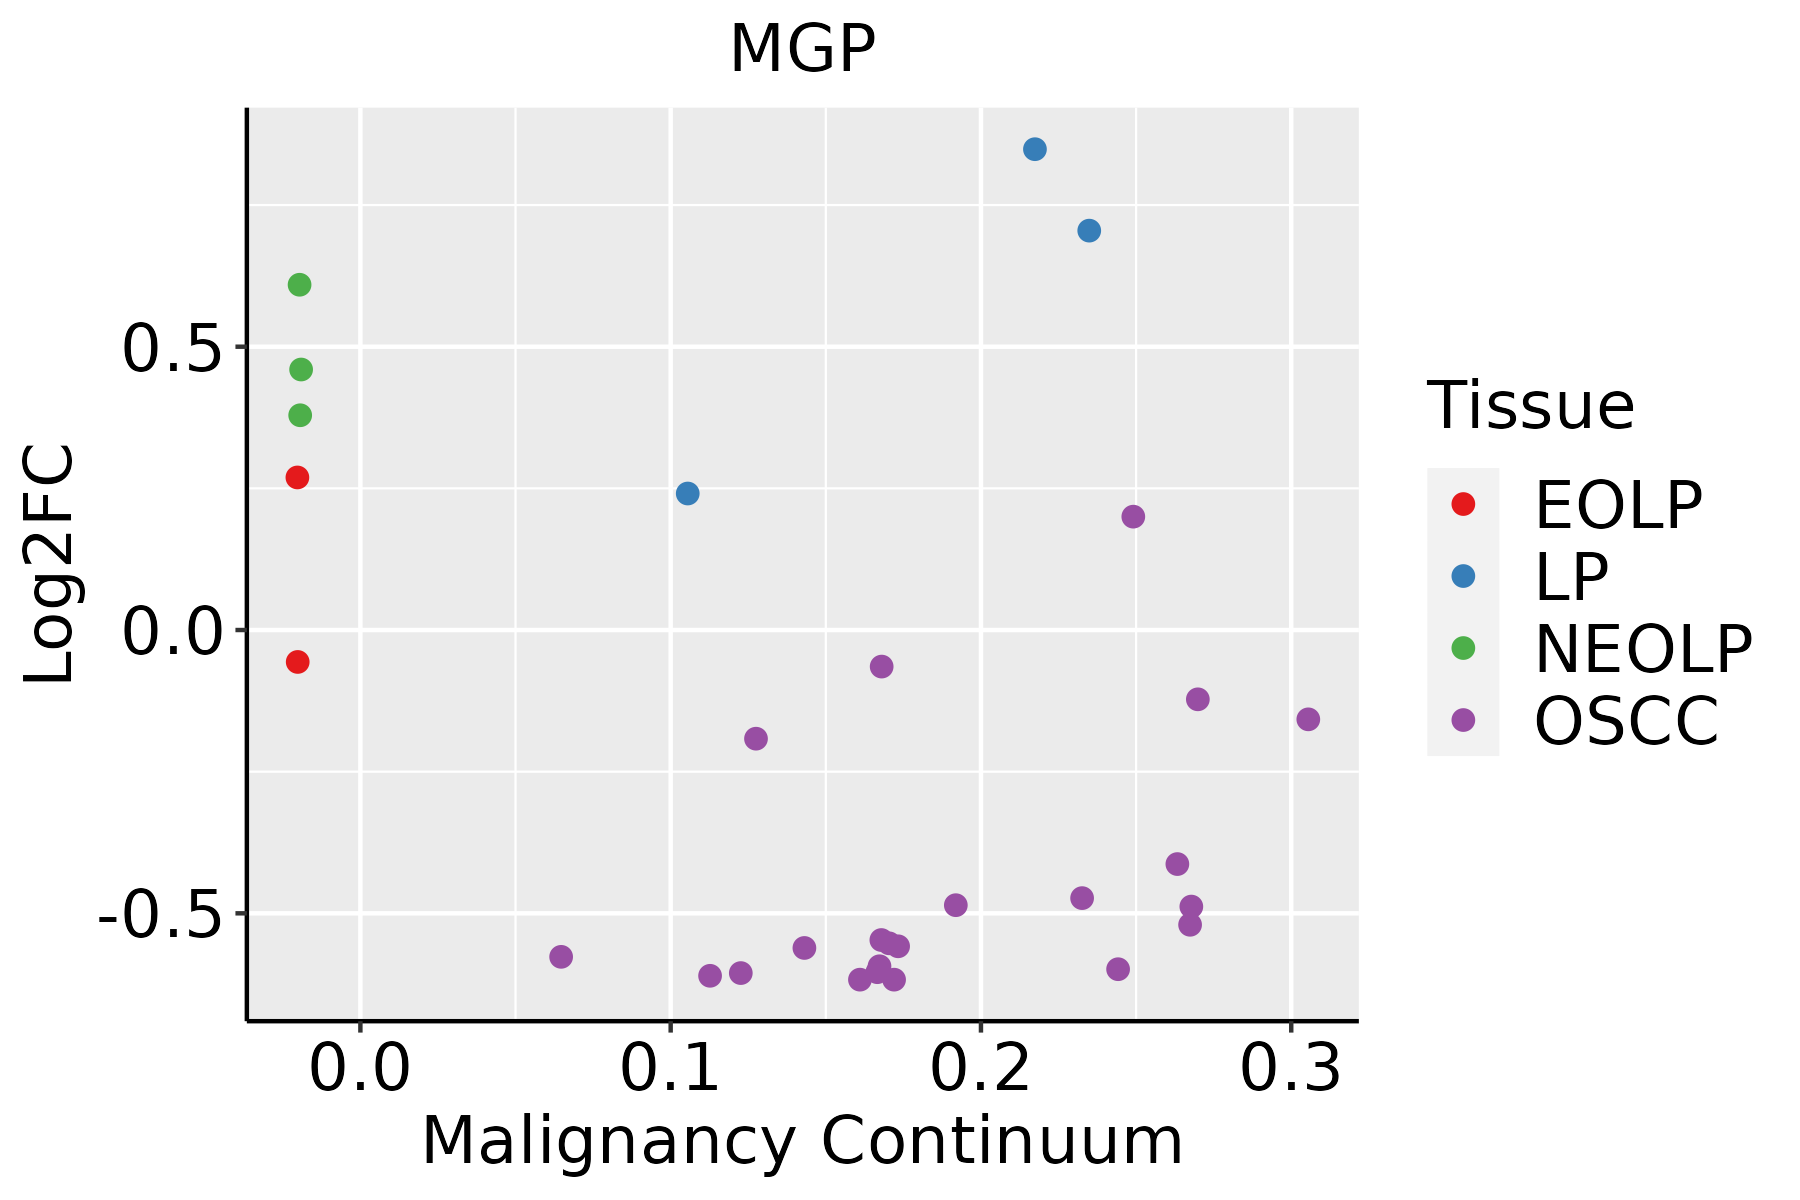 | EOLP: Erosive Oral lichen planus |
| LP: leukoplakia | ||
| NEOLP: Non-erosive oral lichen planus | ||
| OSCC: Oral squamous cell carcinoma | ||
| Prostate | 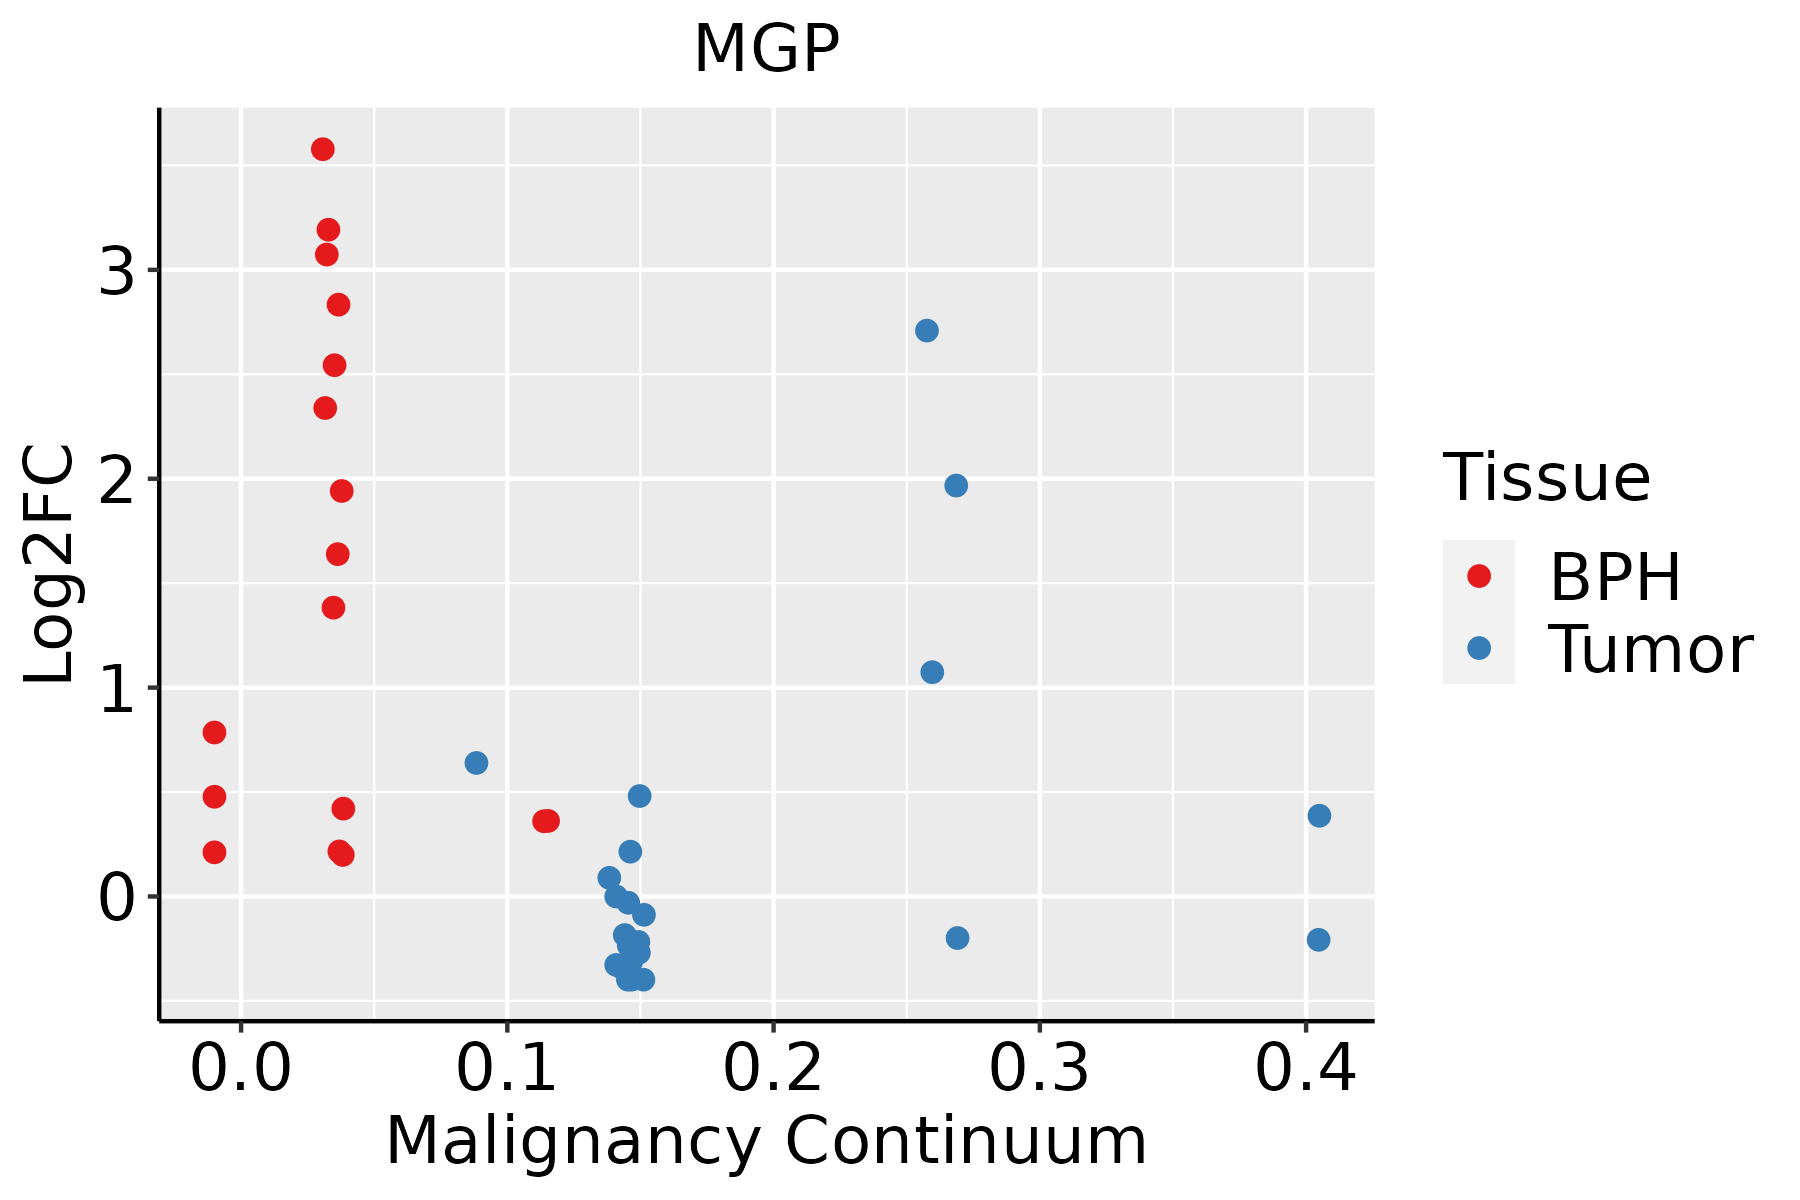 | BPH: Benign Prostatic Hyperplasia |
| Skin | 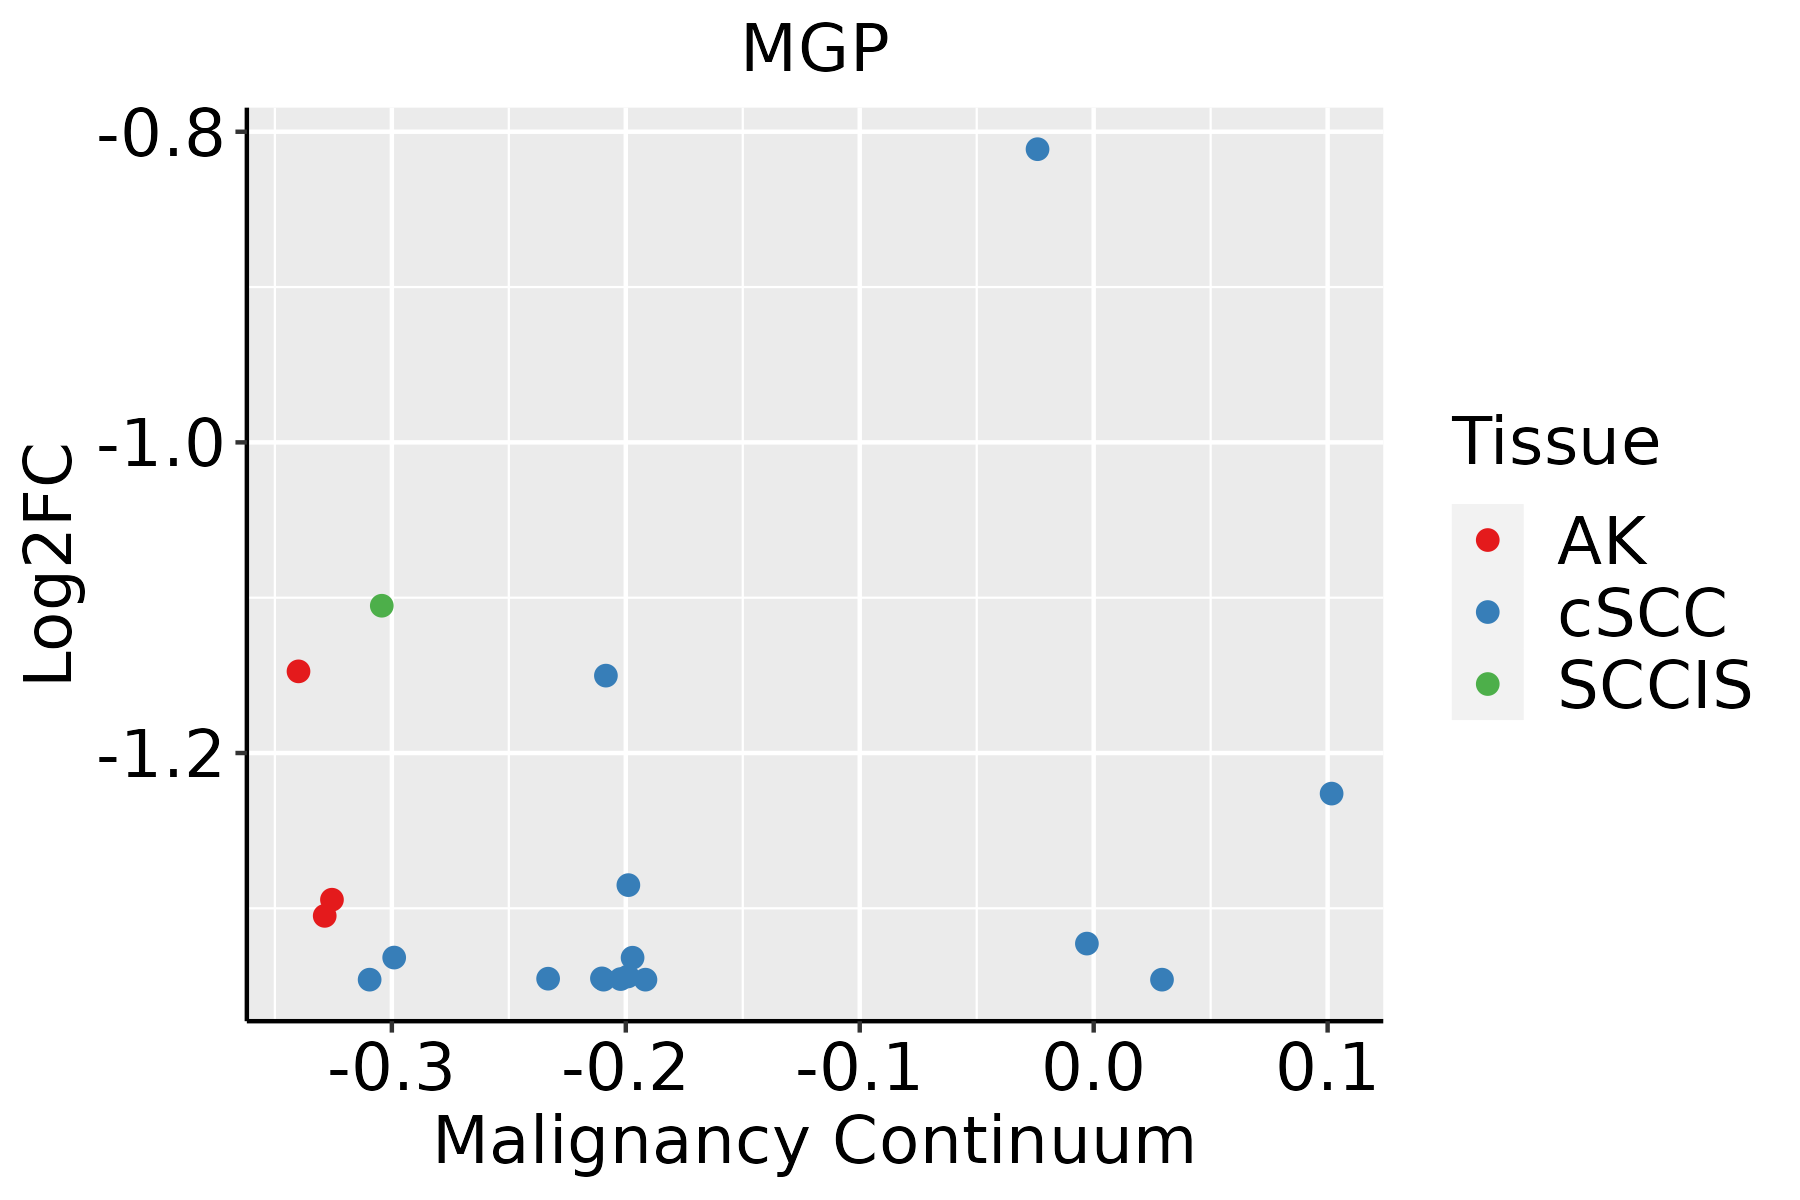 | AK: Actinic keratosis |
| cSCC: Cutaneous squamous cell carcinoma | ||
| SCCIS:squamous cell carcinoma in situ | ||
| Thyroid | 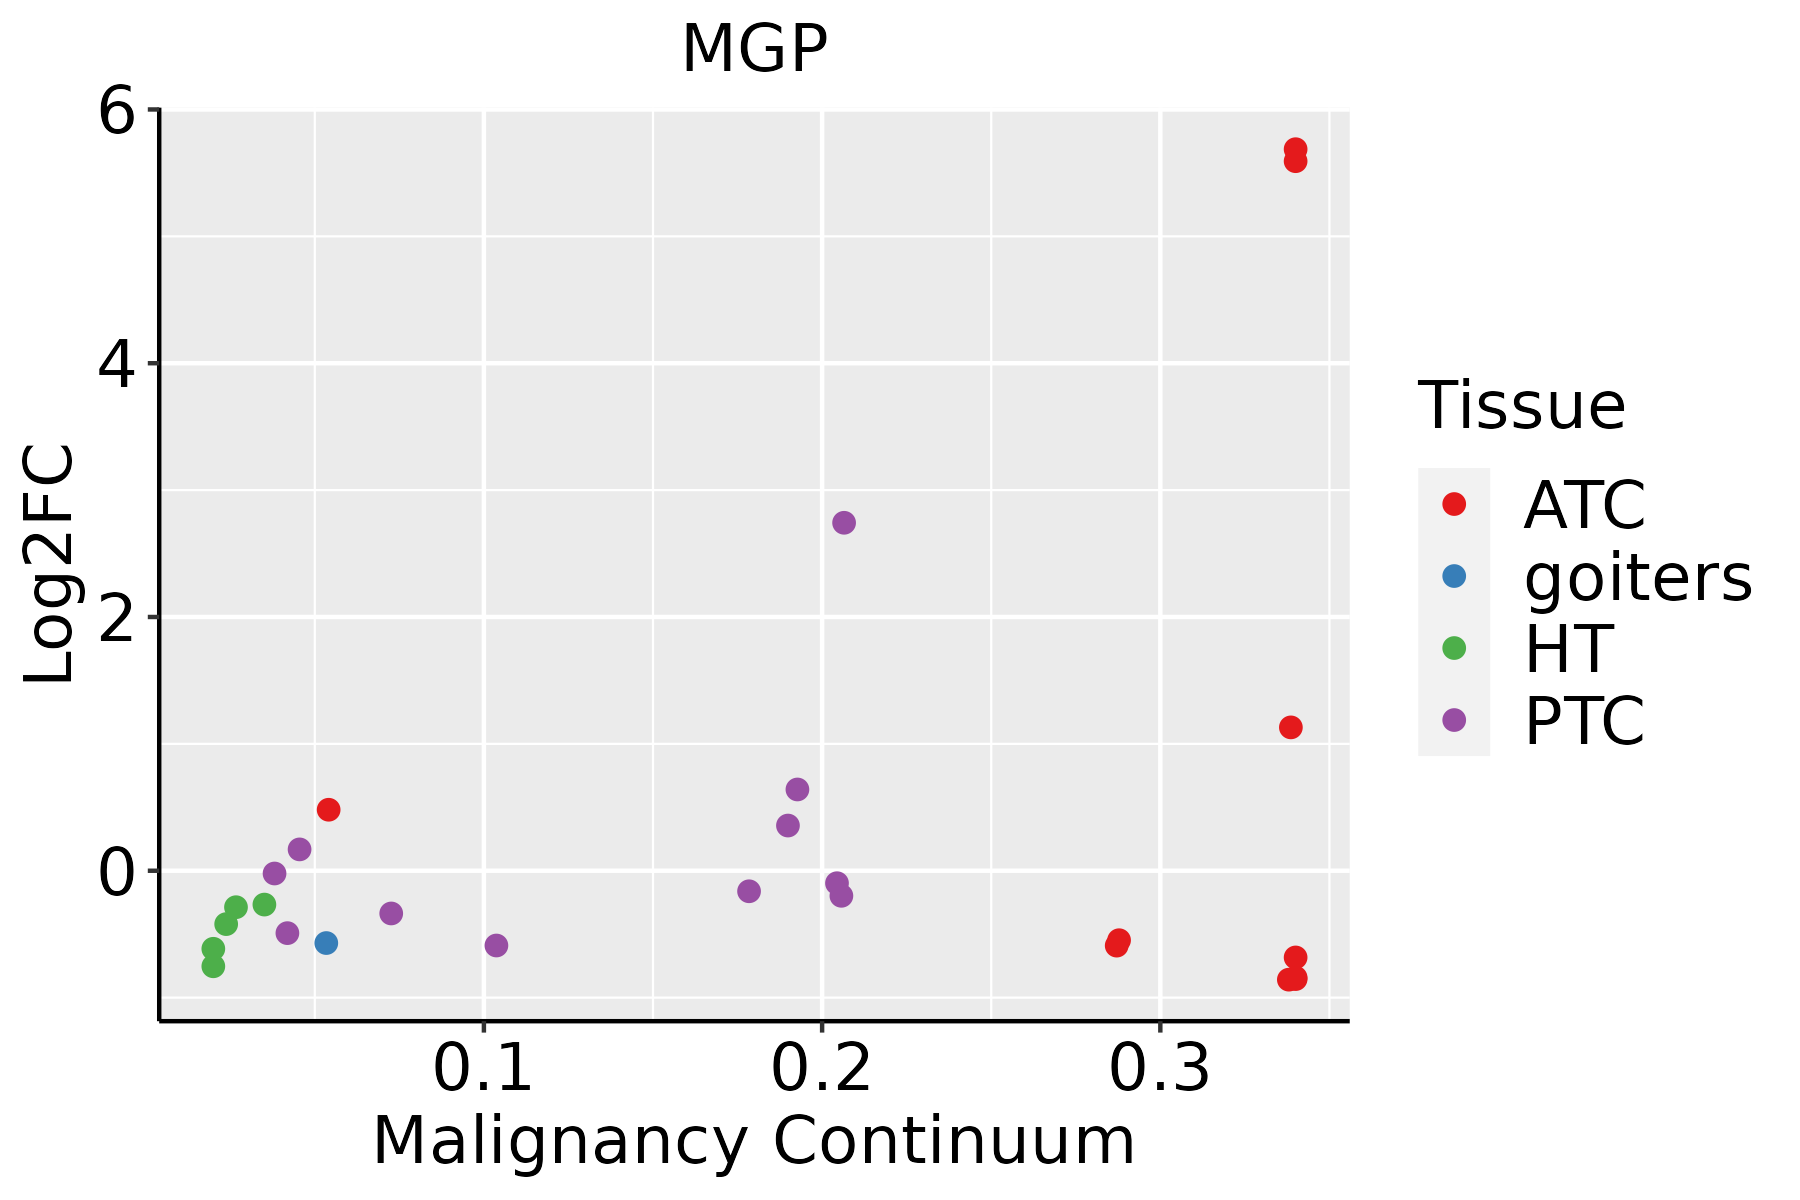 | ATC: Anaplastic thyroid cancer |
| HT: Hashimoto's thyroiditis | ||
| PTC: Papillary thyroid cancer |
| ∗log2FC in expression of this searched gene in stem-like cells from each diseased tissue sample relative to stem-like cells in normal samples in each tissue plotted against the malignancy continuum. Samples are colored based on if they are from different disease stage. |
Top |
Malignant transformation related pathway analysis |
| Find out the enriched GO biological processes and KEGG pathways involved in transition from healthy to precancer to cancer |
| Tissue | Disease Stage | Enriched GO biological Processes |
| Colorectum | AD |  |
| Colorectum | SER |  |
| Colorectum | MSS |  |
| Colorectum | MSI-H |  |
| Colorectum | FAP |  |
| ∗Top 15 enriched GO BP terms are showed in the bar plot of each disease state in each tissue. Each row represents a significant GO biological process which is colored according to the -log10(p.adjust). |
| Page: 1 2 3 4 5 6 7 8 9 |
| GO ID | Tissue | Disease Stage | Description | Gene Ratio | Bg Ratio | pvalue | p.adjust | Count |
| GO:00015036 | Breast | Precancer | ossification | 36/1080 | 408/18723 | 7.53e-03 | 4.98e-02 | 36 |
| GO:000150311 | Breast | IDC | ossification | 50/1434 | 408/18723 | 6.51e-04 | 8.04e-03 | 50 |
| GO:000150321 | Breast | DCIS | ossification | 45/1390 | 408/18723 | 4.98e-03 | 3.72e-02 | 45 |
| GO:00015038 | Endometrium | AEH | ossification | 78/2100 | 408/18723 | 1.54e-06 | 4.85e-05 | 78 |
| GO:0061448 | Endometrium | AEH | connective tissue development | 44/2100 | 252/18723 | 1.92e-03 | 1.51e-02 | 44 |
| GO:0070167 | Endometrium | AEH | regulation of biomineral tissue development | 20/2100 | 97/18723 | 5.00e-03 | 3.14e-02 | 20 |
| GO:00302822 | Endometrium | AEH | bone mineralization | 23/2100 | 119/18723 | 6.32e-03 | 3.75e-02 | 23 |
| GO:0110149 | Endometrium | AEH | regulation of biomineralization | 20/2100 | 99/18723 | 6.34e-03 | 3.76e-02 | 20 |
| GO:00312141 | Endometrium | AEH | biomineral tissue development | 30/2100 | 169/18723 | 7.31e-03 | 4.18e-02 | 30 |
| GO:01101481 | Endometrium | AEH | biomineralization | 30/2100 | 171/18723 | 8.63e-03 | 4.71e-02 | 30 |
| GO:000150313 | Endometrium | EEC | ossification | 79/2168 | 408/18723 | 2.72e-06 | 7.67e-05 | 79 |
| GO:00614481 | Endometrium | EEC | connective tissue development | 44/2168 | 252/18723 | 3.51e-03 | 2.36e-02 | 44 |
| GO:00701671 | Endometrium | EEC | regulation of biomineral tissue development | 20/2168 | 97/18723 | 7.11e-03 | 4.07e-02 | 20 |
| GO:01101491 | Endometrium | EEC | regulation of biomineralization | 20/2168 | 99/18723 | 8.95e-03 | 4.81e-02 | 20 |
| GO:00302821 | Endometrium | EEC | bone mineralization | 23/2168 | 119/18723 | 9.19e-03 | 4.94e-02 | 23 |
| GO:000150317 | Esophagus | ESCC | ossification | 232/8552 | 408/18723 | 3.00e-06 | 3.40e-05 | 232 |
| GO:00487052 | Esophagus | ESCC | skeletal system morphogenesis | 120/8552 | 220/18723 | 4.90e-03 | 1.89e-02 | 120 |
| GO:00512161 | Esophagus | ESCC | cartilage development | 103/8552 | 190/18723 | 1.08e-02 | 3.67e-02 | 103 |
| GO:000150310 | Oral cavity | OSCC | ossification | 203/7305 | 408/18723 | 5.54e-06 | 6.19e-05 | 203 |
| GO:000150331 | Oral cavity | NEOLP | ossification | 81/2005 | 408/18723 | 2.67e-08 | 1.15e-06 | 81 |
| Page: 1 2 3 |
| Pathway ID | Tissue | Disease Stage | Description | Gene Ratio | Bg Ratio | pvalue | p.adjust | qvalue | Count |
| Page: 1 |
Top |
Cell-cell communication analysis |
| Identification of potential cell-cell interactions between two cell types and their ligand-receptor pairs for different disease states |
| Ligand | Receptor | LRpair | Pathway | Tissue | Disease Stage |
| Page: 1 |
Top |
Single-cell gene regulatory network inference analysis |
| Find out the significant the regulons (TFs) and the target genes of each regulon across cell types for different disease states |
| TF | Cell Type | Tissue | Disease Stage | Target Gene | RSS | Regulon Activity |
| ∗The dot plots of a searched regulon are shown for all cell subpopulations in each disease state of each tissue based on the regulon specific score inferred using pySCENIC and by calculating the average expression. |
| Page: 1 |
Top |
Somatic mutation of malignant transformation related genes |
| Annotation of somatic variants for genes involved in malignant transformation |
| Hugo Symbol | Variant Class | Variant Classification | dbSNP RS | HGVSc | HGVSp | HGVSp Short | SWISSPROT | BIOTYPE | SIFT | PolyPhen | Tumor Sample Barcode | Tissue | Histology | Sex | Age | Stage | Therapy Types | Drugs | Outcome |
| MGP | SNV | Missense_Mutation | rs112598629 | c.43N>T | p.Val15Leu | p.V15L | P08493 | protein_coding | tolerated(0.11) | benign(0.041) | TCGA-AN-A03X-01 | Breast | breast invasive carcinoma | Female | >=65 | I/II | Unknown | Unknown | SD |
| MGP | SNV | Missense_Mutation | rs112598629 | c.43N>T | p.Val15Leu | p.V15L | P08493 | protein_coding | tolerated(0.11) | benign(0.041) | TCGA-AO-A0JE-01 | Breast | breast invasive carcinoma | Female | <65 | III/IV | Chemotherapy | doxorubicin | SD |
| MGP | SNV | Missense_Mutation | rs112598629 | c.43G>T | p.Val15Leu | p.V15L | P08493 | protein_coding | tolerated(0.11) | benign(0.041) | TCGA-BH-A0BW-01 | Breast | breast invasive carcinoma | Female | >=65 | I/II | Chemotherapy | adriamycin | CR |
| MGP | insertion | Frame_Shift_Ins | novel | c.334_335insCACC | p.Gly112AlafsTer8 | p.G112Afs*8 | P08493 | protein_coding | TCGA-A8-A07R-01 | Breast | breast invasive carcinoma | Female | >=65 | III/IV | Ancillary | zoledronic | SD | ||
| MGP | insertion | Frame_Shift_Ins | novel | c.333_334insATTCTCTTGTCTGGCT | p.Gly112IlefsTer12 | p.G112Ifs*12 | P08493 | protein_coding | TCGA-A8-A07R-01 | Breast | breast invasive carcinoma | Female | >=65 | III/IV | Ancillary | zoledronic | SD | ||
| MGP | SNV | Missense_Mutation | novel | c.113C>T | p.Ser38Phe | p.S38F | P08493 | protein_coding | tolerated_low_confidence(0.1) | benign(0.364) | TCGA-FU-A3YQ-01 | Cervix | cervical & endocervical cancer | Female | <65 | I/II | Unknown | Unknown | SD |
| MGP | SNV | Missense_Mutation | c.256C>T | p.Arg86Cys | p.R86C | P08493 | protein_coding | deleterious(0) | probably_damaging(0.931) | TCGA-AA-A02R-01 | Colorectum | colon adenocarcinoma | Female | >=65 | I/II | Unknown | Unknown | PD | |
| MGP | SNV | Missense_Mutation | rs550754490 | c.274N>A | p.Glu92Lys | p.E92K | P08493 | protein_coding | deleterious(0) | probably_damaging(0.999) | TCGA-AZ-4315-01 | Colorectum | colon adenocarcinoma | Male | <65 | I/II | Unknown | Unknown | SD |
| MGP | SNV | Missense_Mutation | rs753350275 | c.316C>T | p.Arg106Cys | p.R106C | P08493 | protein_coding | tolerated(0.17) | probably_damaging(0.983) | TCGA-CM-4744-01 | Colorectum | colon adenocarcinoma | Male | >=65 | I/II | Unknown | Unknown | SD |
| MGP | SNV | Missense_Mutation | rs753350275 | c.316N>T | p.Arg106Cys | p.R106C | P08493 | protein_coding | tolerated(0.17) | probably_damaging(0.983) | TCGA-CM-5860-01 | Colorectum | colon adenocarcinoma | Male | <65 | I/II | Ancillary | leucovorin | SD |
| Page: 1 2 3 |
Top |
Related drugs of malignant transformation related genes |
| Identification of chemicals and drugs interact with genes involved in malignant transfromation |
| (DGIdb 4.0) |
| Entrez ID | Symbol | Category | Interaction Types | Drug Claim Name | Drug Name | PMIDs |
| Page: 1 |

Copyright 2023-Present -The University of Texas Health Science Center at Houston |