| Tissue | Expression Dynamics | Abbreviation |
| Esophagus | 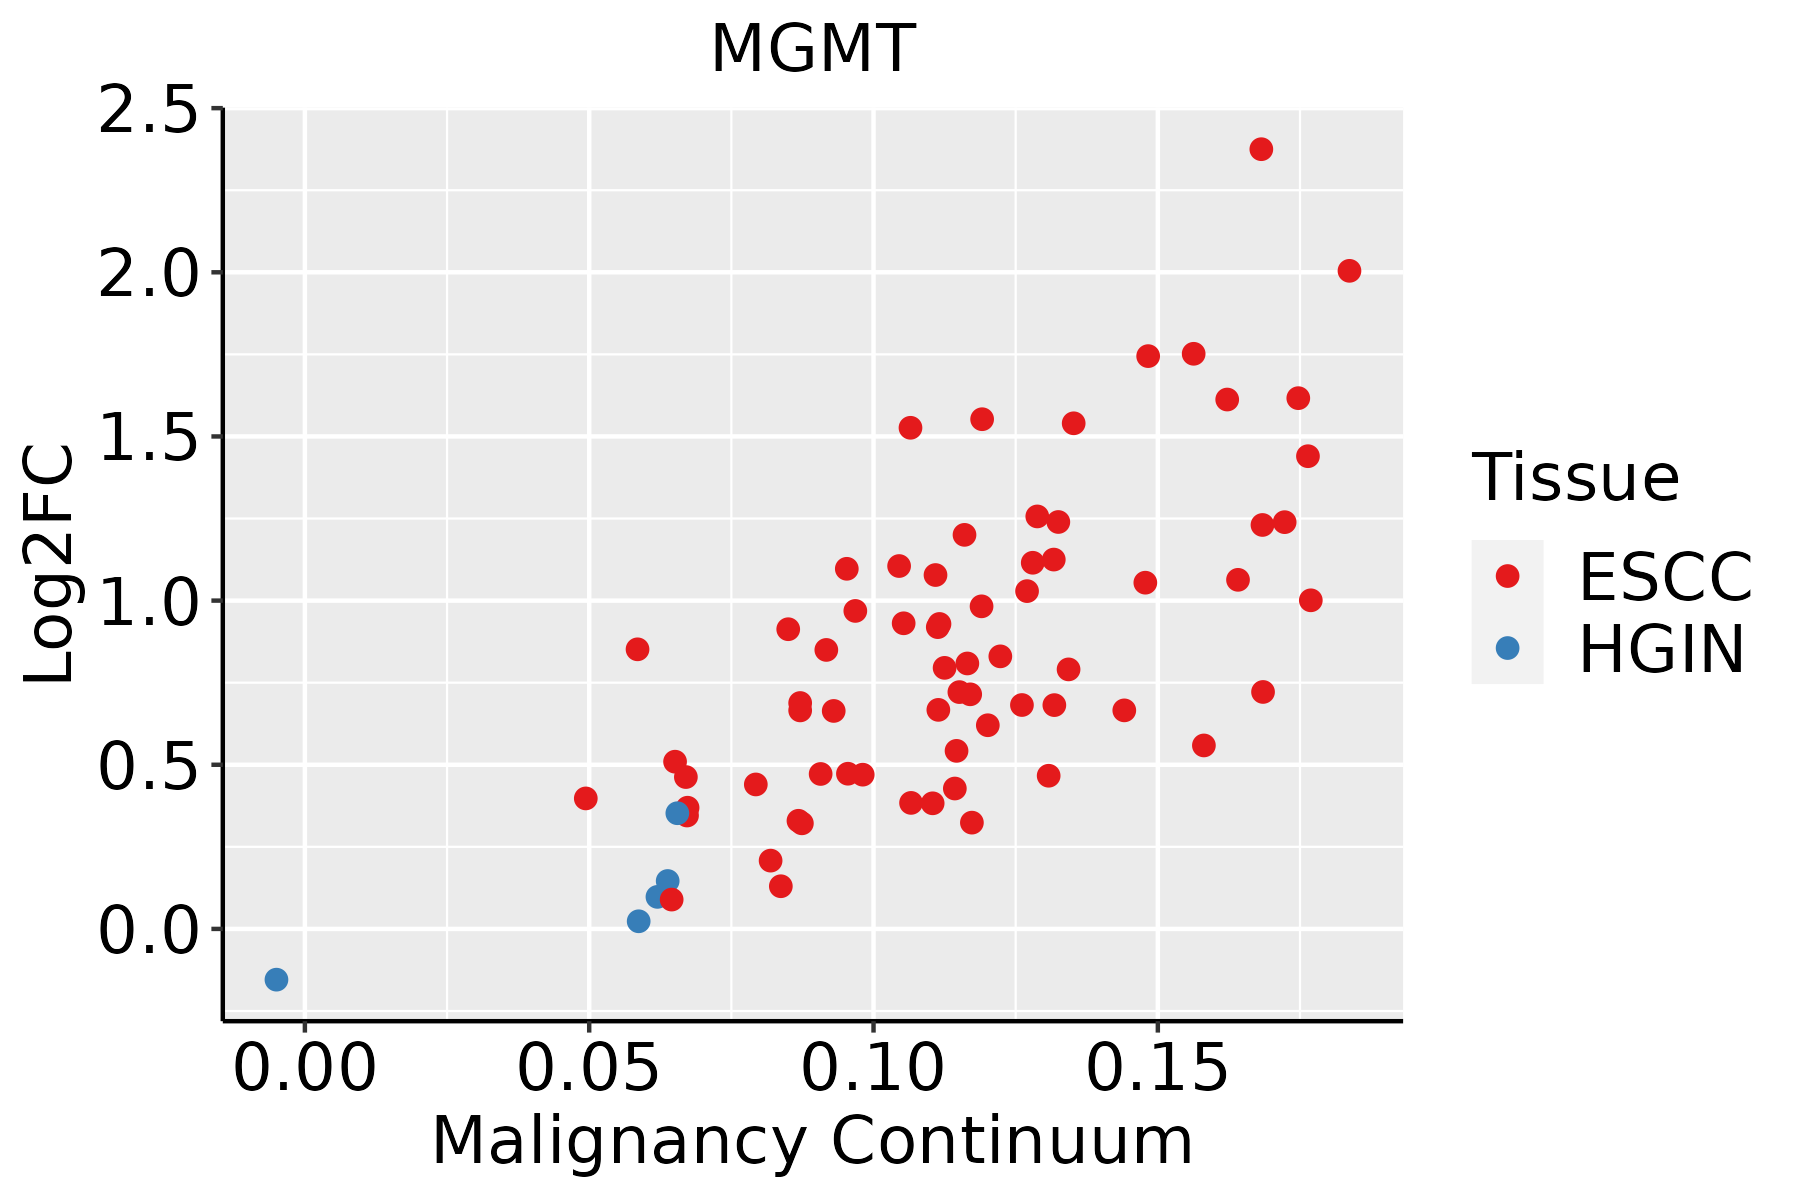 | ESCC: Esophageal squamous cell carcinoma |
| HGIN: High-grade intraepithelial neoplasias |
| LGIN: Low-grade intraepithelial neoplasias |
| GC | 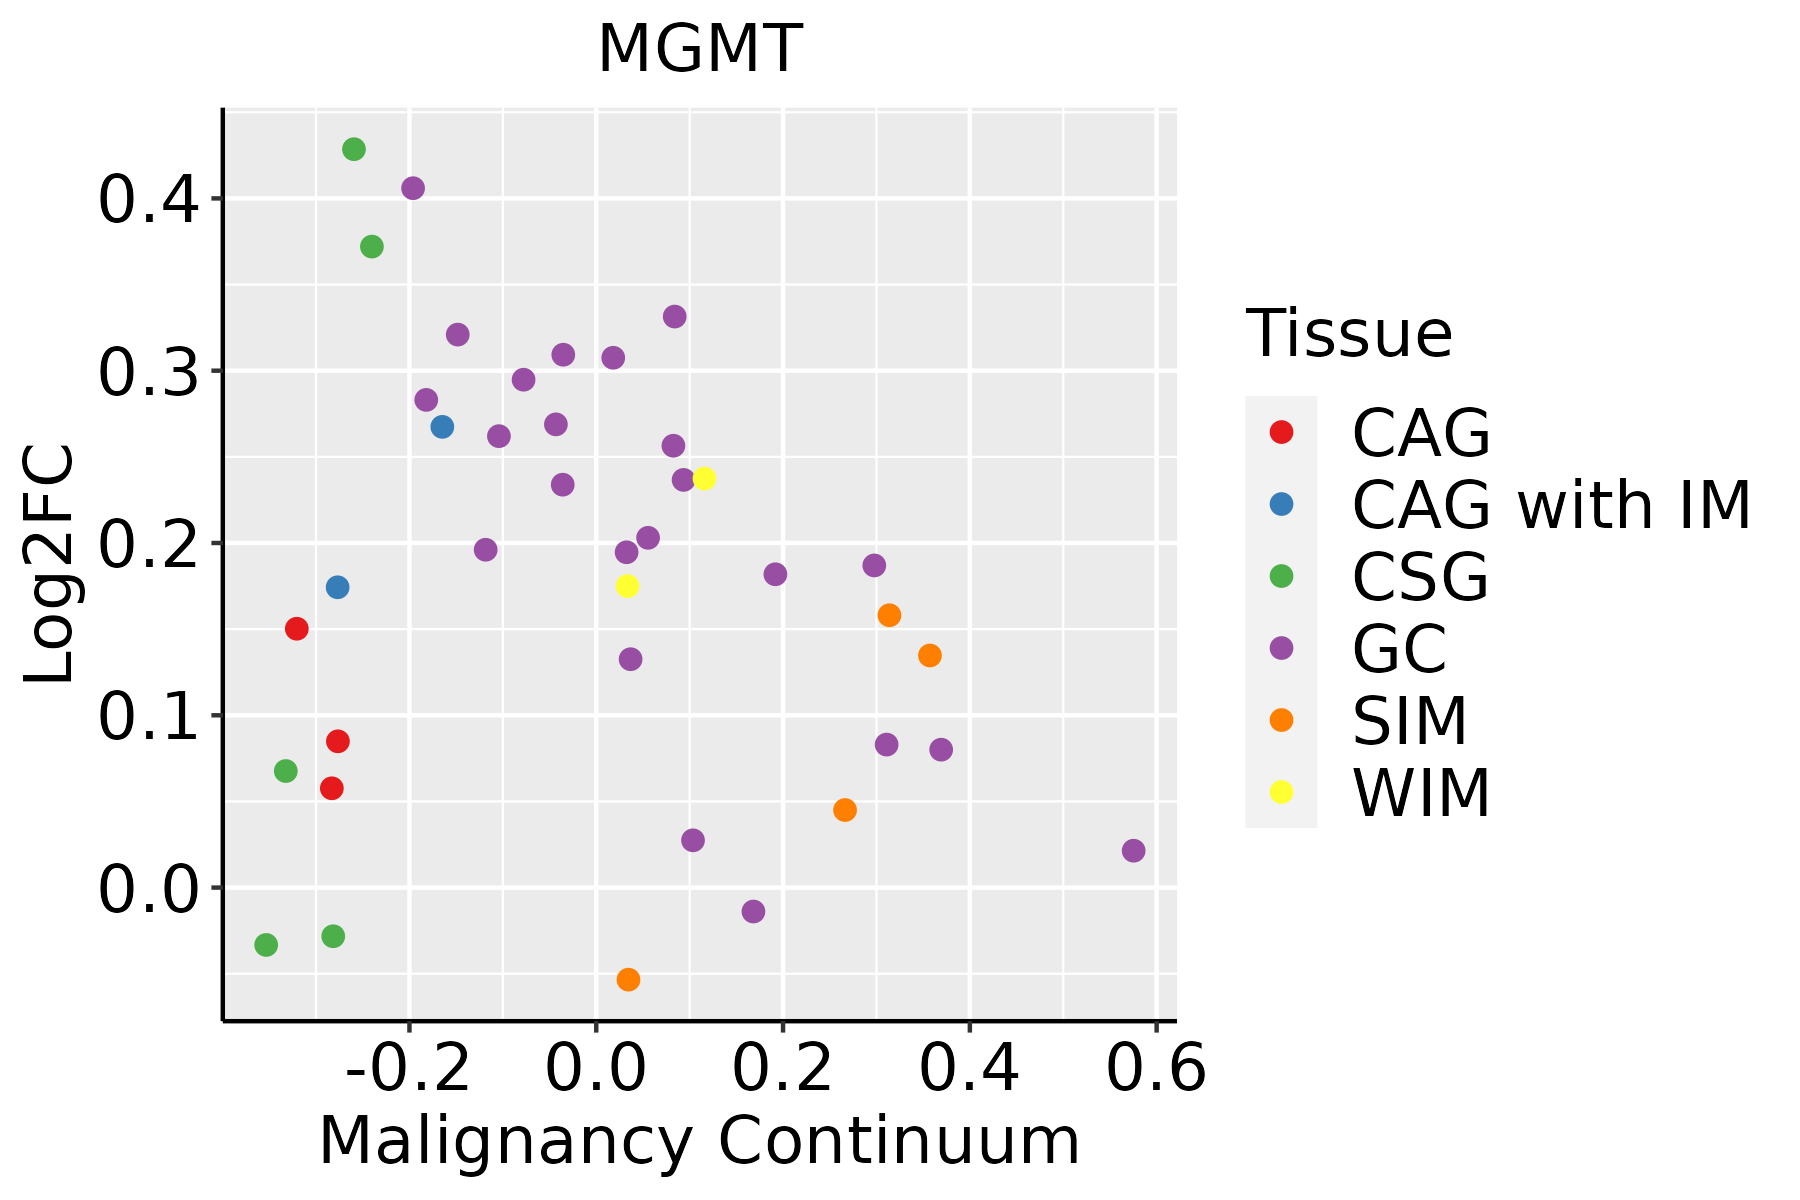 | CAG: Chronic atrophic gastritis |
| CAG with IM: Chronic atrophic gastritis with intestinal metaplasia |
| CSG: Chronic superficial gastritis |
| GC: Gastric cancer |
| SIM: Severe intestinal metaplasia |
| WIM: Wild intestinal metaplasia |
| Liver | 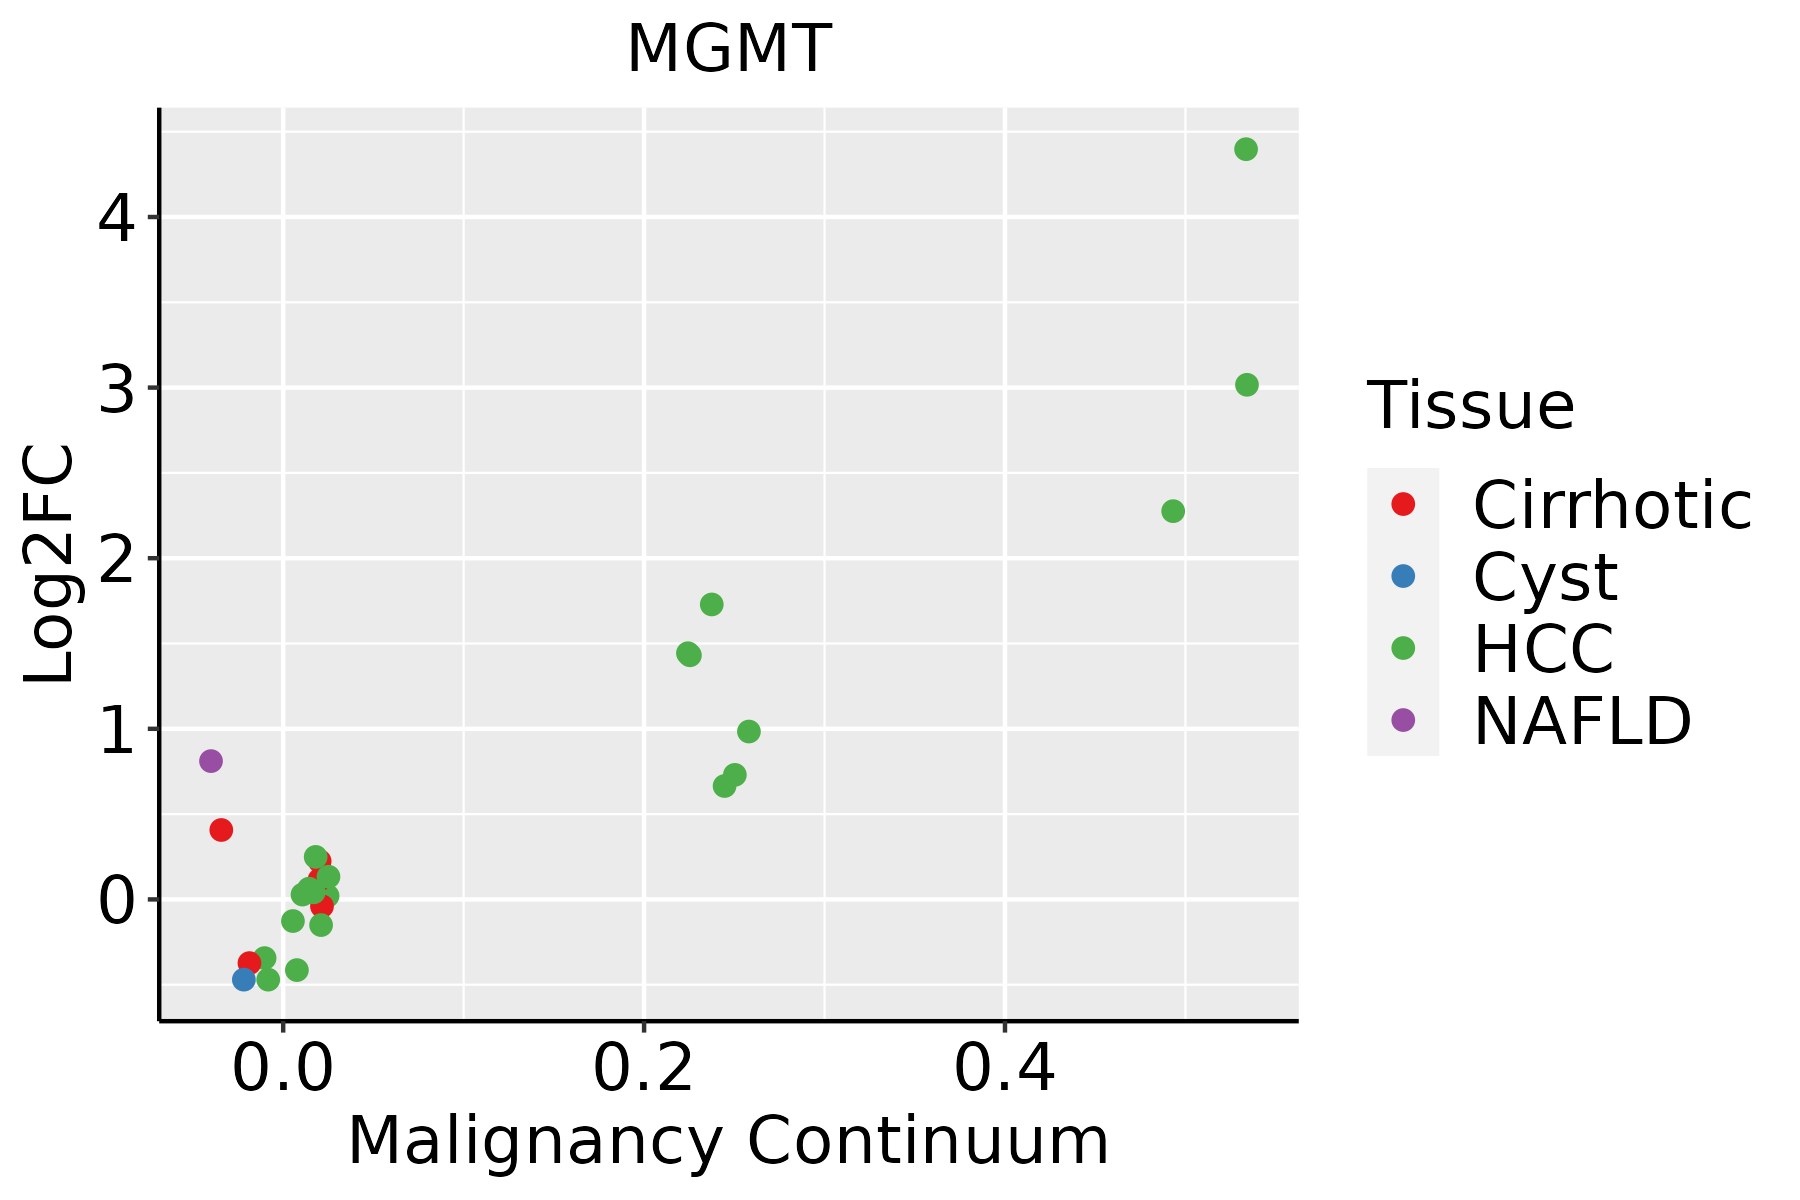 | HCC: Hepatocellular carcinoma |
| NAFLD: Non-alcoholic fatty liver disease |
| Oral Cavity |  | EOLP: Erosive Oral lichen planus |
| LP: leukoplakia |
| NEOLP: Non-erosive oral lichen planus |
| OSCC: Oral squamous cell carcinoma |
| Skin | 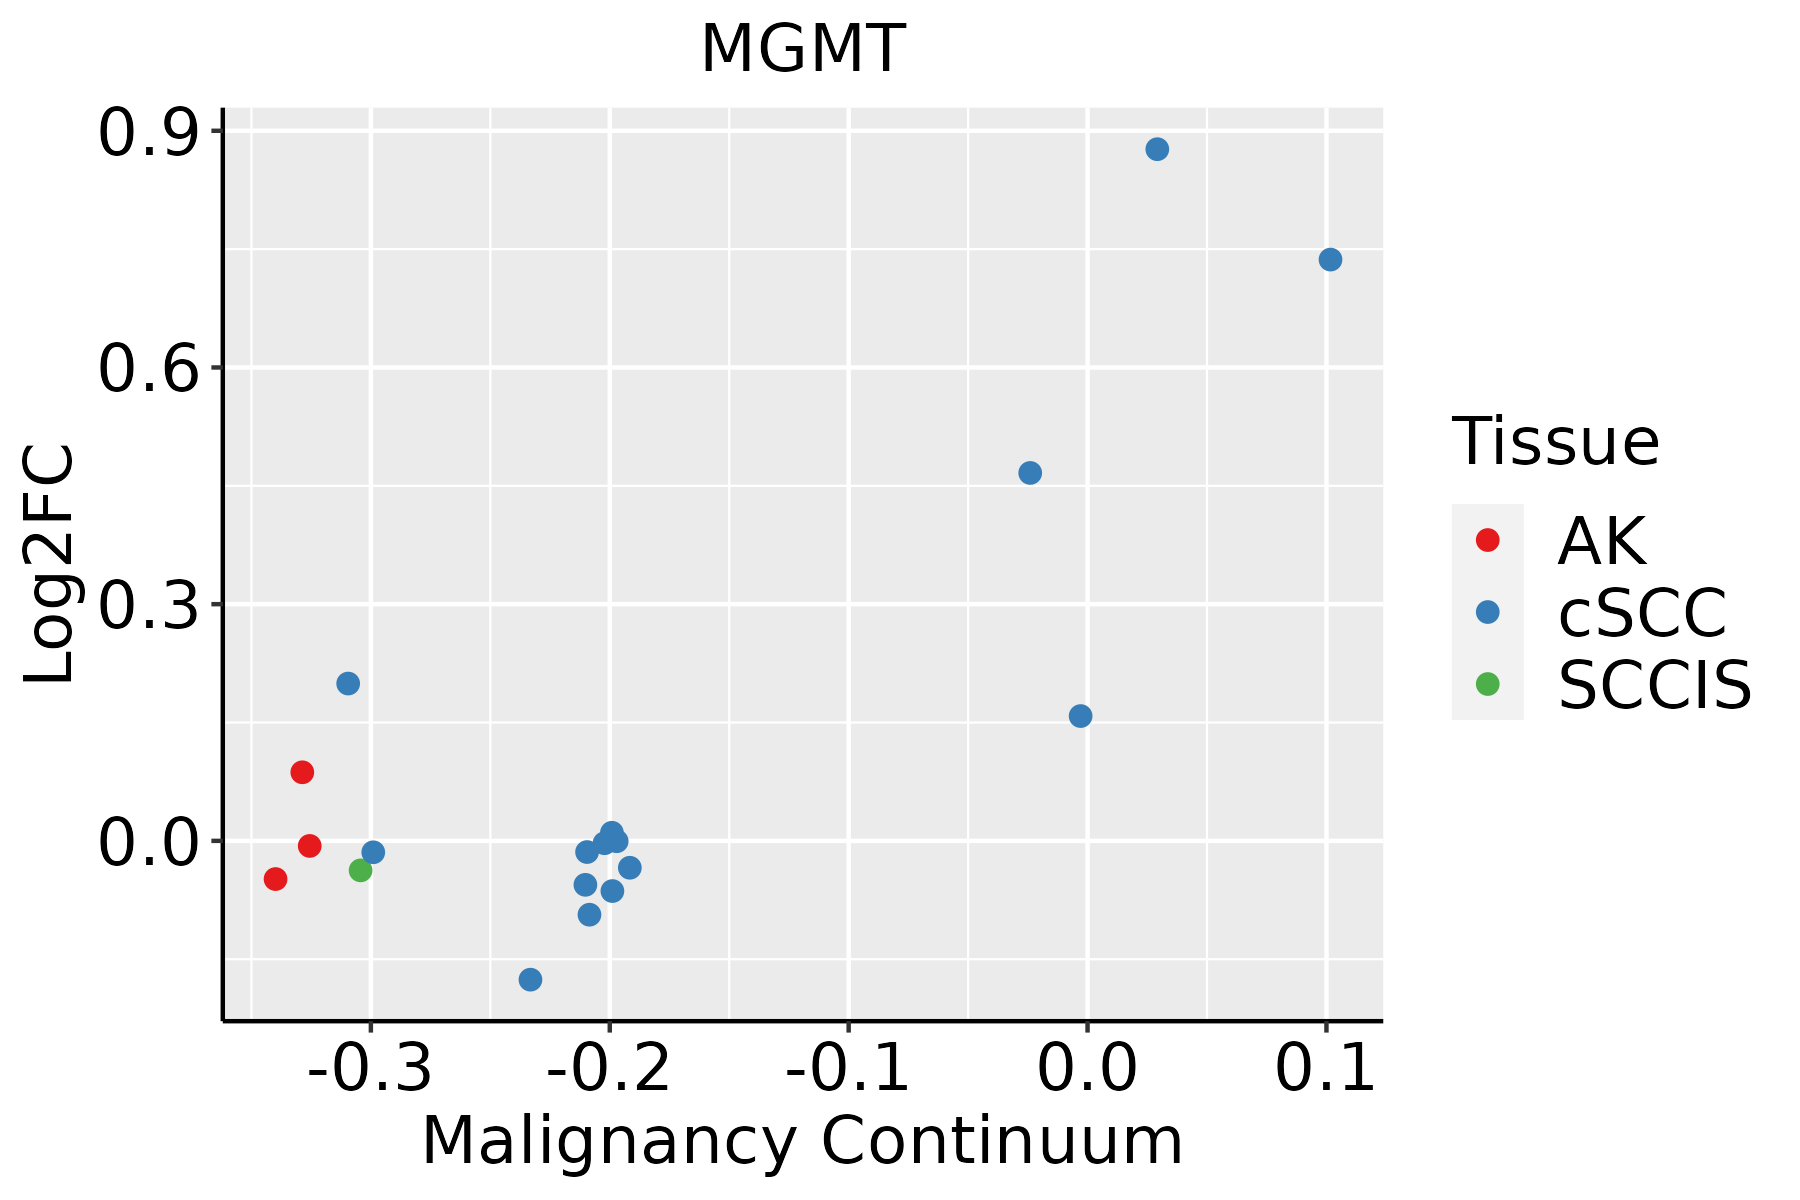 | AK: Actinic keratosis |
| cSCC: Cutaneous squamous cell carcinoma |
| SCCIS:squamous cell carcinoma in situ |
| Thyroid |  | ATC: Anaplastic thyroid cancer |
| HT: Hashimoto's thyroiditis |
| PTC: Papillary thyroid cancer |
| GO ID | Tissue | Disease Stage | Description | Gene Ratio | Bg Ratio | pvalue | p.adjust | Count |
| GO:0006979111 | Esophagus | ESCC | response to oxidative stress | 303/8552 | 446/18723 | 7.15e-22 | 1.30e-19 | 303 |
| GO:0062197111 | Esophagus | ESCC | cellular response to chemical stress | 234/8552 | 337/18723 | 5.37e-19 | 5.97e-17 | 234 |
| GO:0034599111 | Esophagus | ESCC | cellular response to oxidative stress | 197/8552 | 288/18723 | 3.76e-15 | 2.15e-13 | 197 |
| GO:005105215 | Esophagus | ESCC | regulation of DNA metabolic process | 232/8552 | 359/18723 | 2.40e-13 | 1.13e-11 | 232 |
| GO:001021217 | Esophagus | ESCC | response to ionizing radiation | 110/8552 | 148/18723 | 1.11e-12 | 4.78e-11 | 110 |
| GO:0048732111 | Esophagus | ESCC | gland development | 269/8552 | 436/18723 | 7.81e-12 | 2.95e-10 | 269 |
| GO:0031667111 | Esophagus | ESCC | response to nutrient levels | 289/8552 | 474/18723 | 9.25e-12 | 3.47e-10 | 289 |
| GO:005105417 | Esophagus | ESCC | positive regulation of DNA metabolic process | 139/8552 | 201/18723 | 1.20e-11 | 4.33e-10 | 139 |
| GO:2000116111 | Esophagus | ESCC | regulation of cysteine-type endopeptidase activity | 158/8552 | 235/18723 | 1.67e-11 | 5.90e-10 | 158 |
| GO:0043281111 | Esophagus | ESCC | regulation of cysteine-type endopeptidase activity involved in apoptotic process | 143/8552 | 209/18723 | 2.12e-11 | 7.31e-10 | 143 |
| GO:000931419 | Esophagus | ESCC | response to radiation | 277/8552 | 456/18723 | 4.42e-11 | 1.43e-09 | 277 |
| GO:00434143 | Esophagus | ESCC | macromolecule methylation | 199/8552 | 316/18723 | 3.44e-10 | 9.57e-09 | 199 |
| GO:2001020110 | Esophagus | ESCC | regulation of response to DNA damage stimulus | 145/8552 | 219/18723 | 5.97e-10 | 1.50e-08 | 145 |
| GO:007121419 | Esophagus | ESCC | cellular response to abiotic stimulus | 206/8552 | 331/18723 | 7.52e-10 | 1.88e-08 | 206 |
| GO:010400419 | Esophagus | ESCC | cellular response to environmental stimulus | 206/8552 | 331/18723 | 7.52e-10 | 1.88e-08 | 206 |
| GO:0052547111 | Esophagus | ESCC | regulation of peptidase activity | 275/8552 | 461/18723 | 7.54e-10 | 1.88e-08 | 275 |
| GO:00322592 | Esophagus | ESCC | methylation | 222/8552 | 364/18723 | 2.26e-09 | 5.09e-08 | 222 |
| GO:007147816 | Esophagus | ESCC | cellular response to radiation | 122/8552 | 186/18723 | 3.07e-08 | 5.73e-07 | 122 |
| GO:0052548111 | Esophagus | ESCC | regulation of endopeptidase activity | 253/8552 | 432/18723 | 3.68e-08 | 6.78e-07 | 253 |
| GO:000758410 | Esophagus | ESCC | response to nutrient | 114/8552 | 174/18723 | 9.43e-08 | 1.56e-06 | 114 |
| Hugo Symbol | Variant Class | Variant Classification | dbSNP RS | HGVSc | HGVSp | HGVSp Short | SWISSPROT | BIOTYPE | SIFT | PolyPhen | Tumor Sample Barcode | Tissue | Histology | Sex | Age | Stage | Therapy Types | Drugs | Outcome |
| MGMT | SNV | Missense_Mutation | rs768667991 | c.380G>A | p.Arg127Lys | p.R127K | P16455 | protein_coding | tolerated(0.31) | benign(0.059) | TCGA-BH-A0HK-01 | Breast | breast invasive carcinoma | Female | >=65 | I/II | Hormone Therapy | arimidex | SD |
| MGMT | SNV | Missense_Mutation | rs374717890 | c.446N>T | p.Ala149Val | p.A149V | P16455 | protein_coding | deleterious(0) | probably_damaging(1) | TCGA-S3-AA0Z-01 | Breast | breast invasive carcinoma | Female | <65 | I/II | Ancillary | neulasta | CR |
| MGMT | SNV | Missense_Mutation | | c.610G>C | p.Gly204Arg | p.G204R | P16455 | protein_coding | deleterious(0.02) | possibly_damaging(0.719) | TCGA-EA-A43B-01 | Cervix | cervical & endocervical cancer | Female | <65 | I/II | Chemotherapy | cisplatin | CR |
| MGMT | SNV | Missense_Mutation | rs544050191 | c.119G>A | p.Arg40His | p.R40H | P16455 | protein_coding | tolerated(0.55) | benign(0.013) | TCGA-AZ-4315-01 | Colorectum | colon adenocarcinoma | Male | <65 | I/II | Unknown | Unknown | SD |
| MGMT | SNV | Missense_Mutation | | c.80N>C | p.Leu27Ser | p.L27S | P16455 | protein_coding | tolerated_low_confidence(0.77) | benign(0.039) | TCGA-AZ-6601-01 | Colorectum | colon adenocarcinoma | Male | >=65 | I/II | Unknown | Unknown | PD |
| MGMT | SNV | Missense_Mutation | rs544050191 | c.119N>A | p.Arg40His | p.R40H | P16455 | protein_coding | tolerated(0.55) | benign(0.013) | TCGA-A5-A0G2-01 | Endometrium | uterine corpus endometrioid carcinoma | Female | <65 | III/IV | Unknown | Unknown | SD |
| MGMT | SNV | Missense_Mutation | rs748040489 | c.473C>T | p.Ala158Val | p.A158V | P16455 | protein_coding | tolerated(0.17) | benign(0.208) | TCGA-AP-A1DV-01 | Endometrium | uterine corpus endometrioid carcinoma | Female | <65 | I/II | Unknown | Unknown | SD |
| MGMT | SNV | Missense_Mutation | rs373120552 | c.583N>A | p.Val195Met | p.V195M | P16455 | protein_coding | tolerated(0.23) | benign(0.318) | TCGA-AX-A2HA-01 | Endometrium | uterine corpus endometrioid carcinoma | Female | <65 | I/II | Unknown | Unknown | SD |
| MGMT | SNV | Missense_Mutation | rs748040489 | c.473N>T | p.Ala158Val | p.A158V | P16455 | protein_coding | tolerated(0.17) | benign(0.208) | TCGA-B5-A11E-01 | Endometrium | uterine corpus endometrioid carcinoma | Female | <65 | I/II | Unknown | Unknown | SD |
| MGMT | SNV | Missense_Mutation | novel | c.298T>C | p.Tyr100His | p.Y100H | P16455 | protein_coding | deleterious(0) | probably_damaging(1) | TCGA-DI-A1BU-01 | Endometrium | uterine corpus endometrioid carcinoma | Female | <65 | I/II | Chemotherapy | paclitaxel | SD |
| Entrez ID | Symbol | Category | Interaction Types | Drug Claim Name | Drug Name | PMIDs |
| 4255 | MGMT | CLINICALLY ACTIONABLE, DRUGGABLE GENOME, DNA REPAIR, ENZYME | | CHLORAMBUCIL | CHLORAMBUCIL | 8621235 |
| 4255 | MGMT | CLINICALLY ACTIONABLE, DRUGGABLE GENOME, DNA REPAIR, ENZYME | | CPT-11 | IRINOTECAN HYDROCHLORIDE | 11802813 |
| 4255 | MGMT | CLINICALLY ACTIONABLE, DRUGGABLE GENOME, DNA REPAIR, ENZYME | | GENISTEIN | GENISTEIN | 16203797 |
| 4255 | MGMT | CLINICALLY ACTIONABLE, DRUGGABLE GENOME, DNA REPAIR, ENZYME | | NITROSOUREAS | | 9393761 |
| 4255 | MGMT | CLINICALLY ACTIONABLE, DRUGGABLE GENOME, DNA REPAIR, ENZYME | | CDDP | CISPLATIN | 16043385 |
| 4255 | MGMT | CLINICALLY ACTIONABLE, DRUGGABLE GENOME, DNA REPAIR, ENZYME | | TGFBETA1 | | 11262404 |
| 4255 | MGMT | CLINICALLY ACTIONABLE, DRUGGABLE GENOME, DNA REPAIR, ENZYME | | DOX | | 1387586 |
| 4255 | MGMT | CLINICALLY ACTIONABLE, DRUGGABLE GENOME, DNA REPAIR, ENZYME | | ANTIOXIDANT | | 17016661 |
| 4255 | MGMT | CLINICALLY ACTIONABLE, DRUGGABLE GENOME, DNA REPAIR, ENZYME | | temozolomide | TEMOZOLOMIDE | 24444404 |
| 4255 | MGMT | CLINICALLY ACTIONABLE, DRUGGABLE GENOME, DNA REPAIR, ENZYME | | CARMUSTINE | CARMUSTINE | 11070098 |


